Premium, Discount, and Equilibrium
Every chart you look at asks you the same two questions: at what price would you prefer to buy this asset, and at what price would you prefer to sell it? You don't need a genius to comprehend that you want to buy low and sell high. This sounds trivial, but 90% of people lose money because they do the opposite — they buy high and sell low.
Premium, Discount, and Equilibrium is the framework that fixes that. It tells you where in a range the risk-to-reward is on your side, where smart money is buying or selling, and where algorithms keep dragging price back to. Get this right and you stop selling bottoms after buying tops.
This lesson builds on the law of Supply & Demand Zones Intro and connects directly into 💎Supply & Demand Trading and 🎁Supply & Demand — those are the levels; this is the strategy you wrap around them.
IMPORTANT NOTE. There is a lot of talk around the Fib tool in this lesson. The fib has a dedicated lesson in the future of this course. For now, just go along with what is being taught. This is technically part of Module 3 - Supply and demand. It is hard to talk around the fib when it's such a crucial tool with this concept. Everything to do with the fib is explained more in-depth in the future.
The Core Definitions
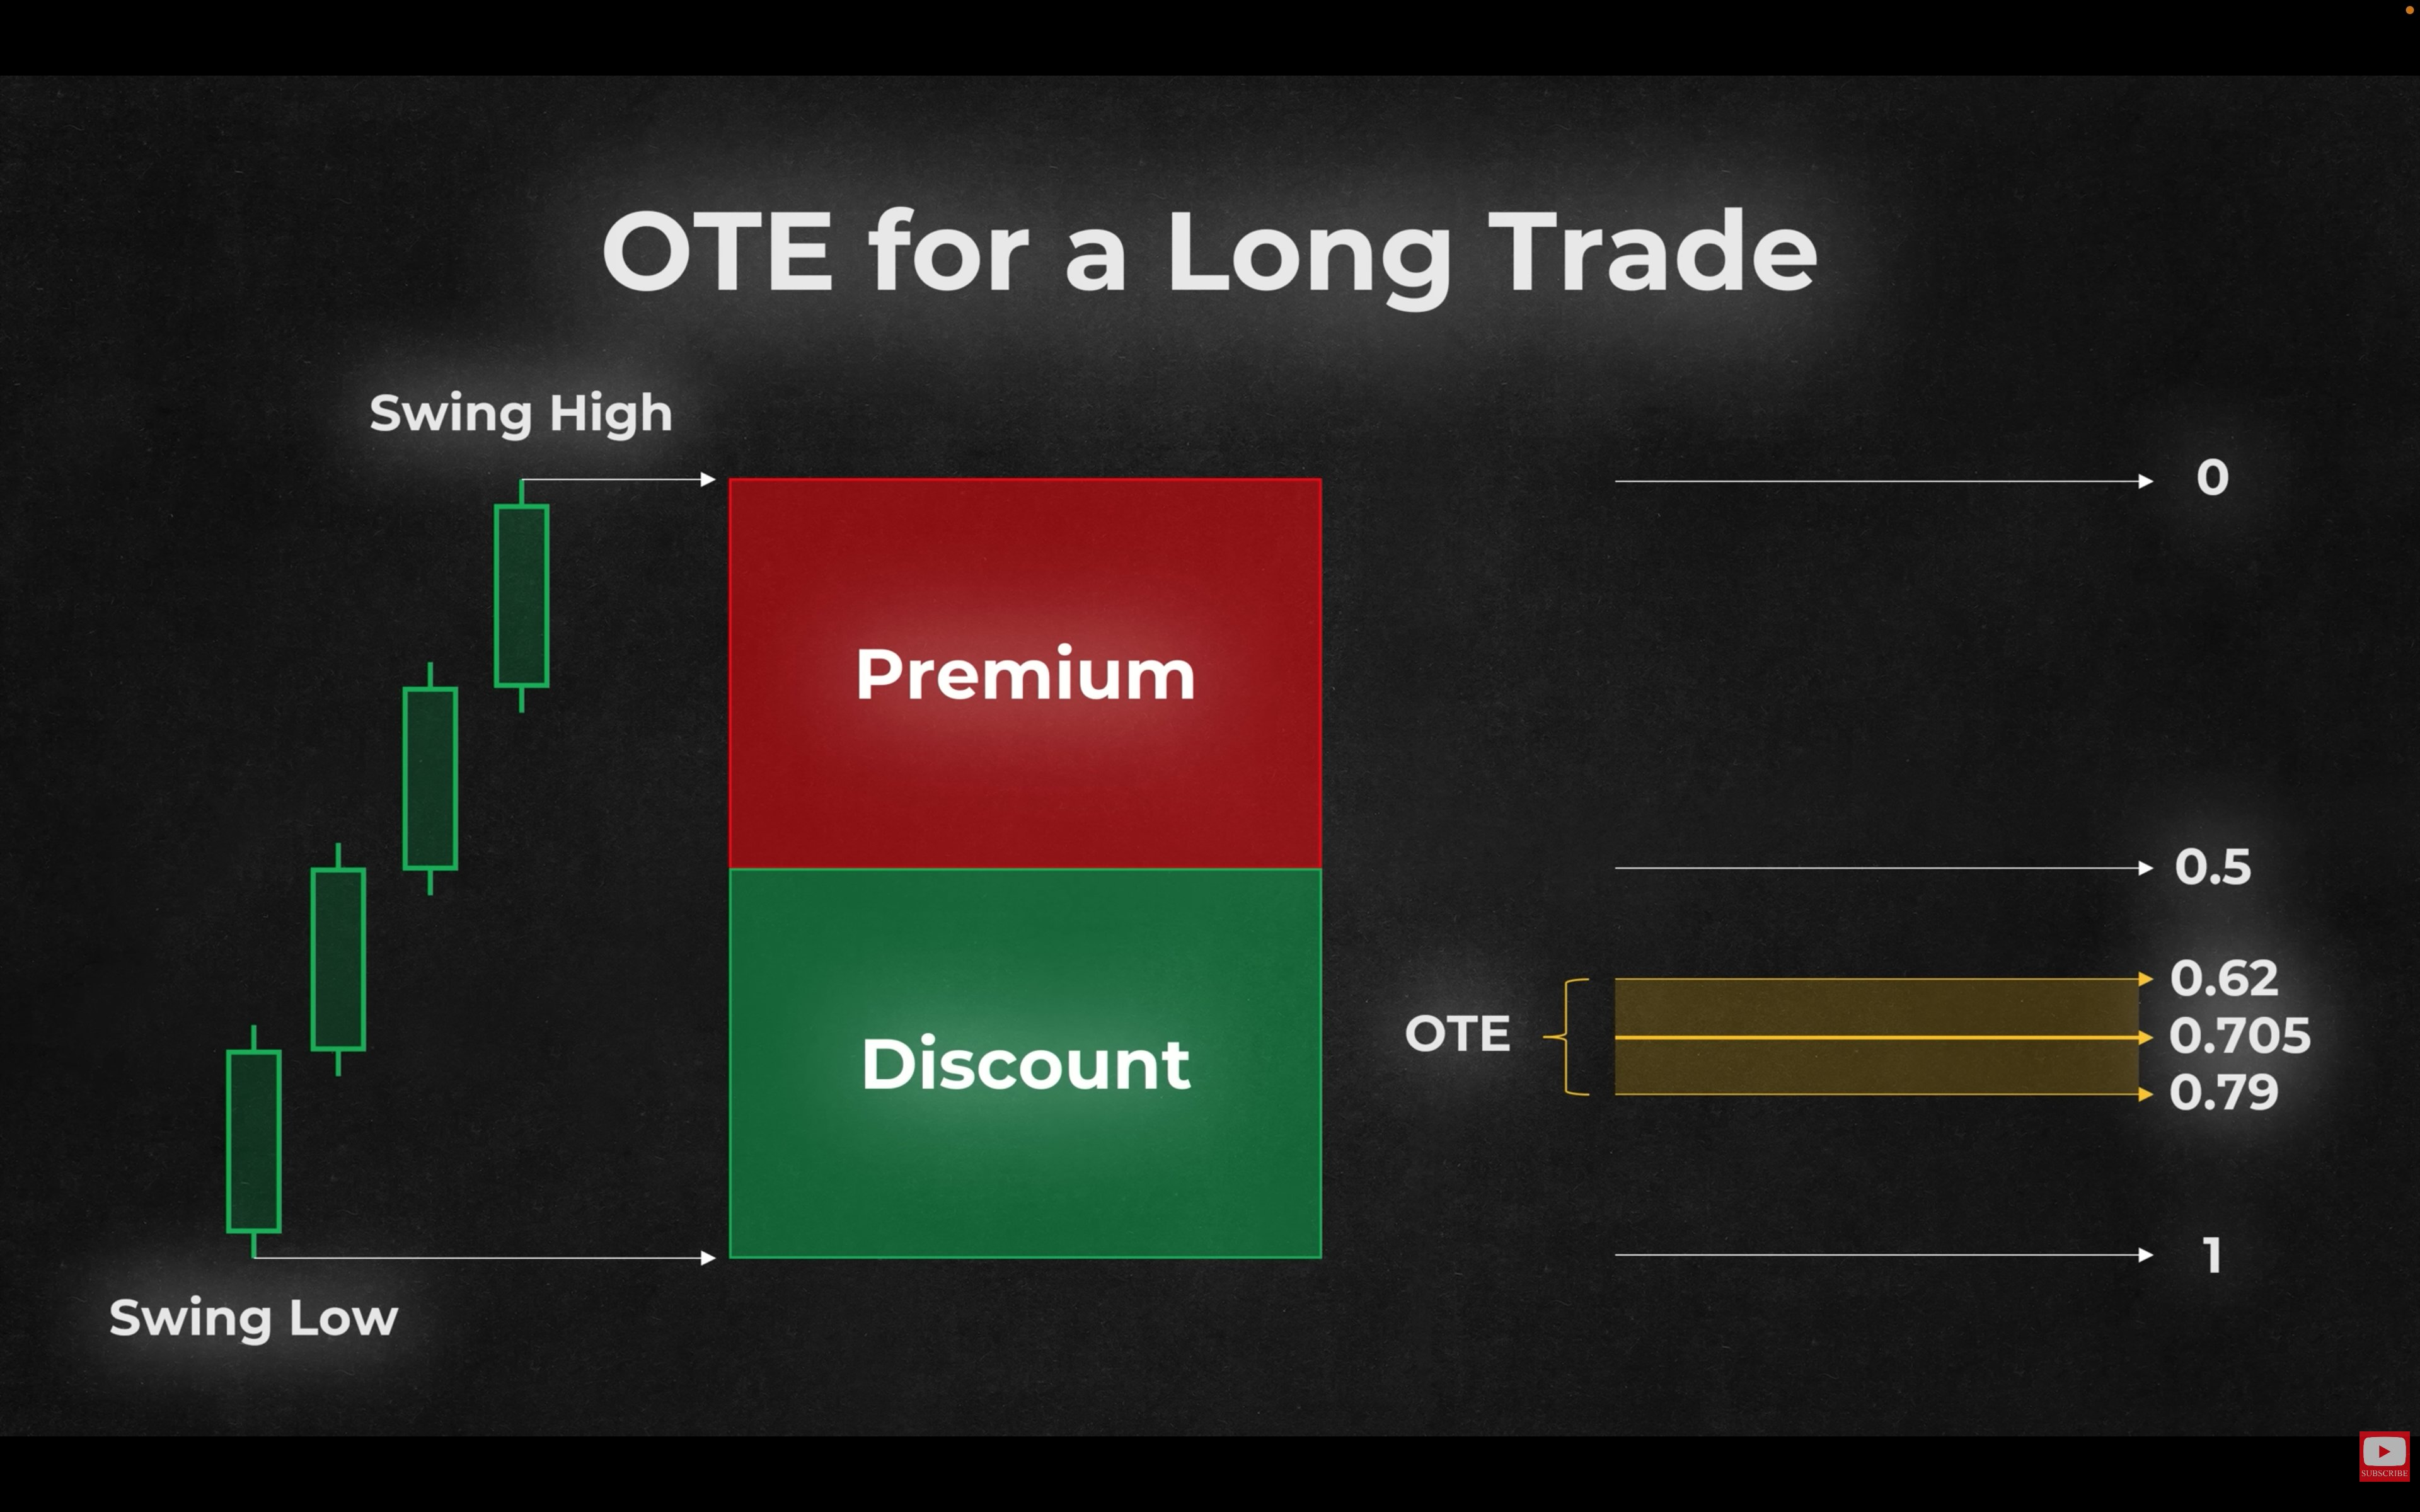
Set the Fibonacci tool from the range high to the range low. That single action divides the chart into three zones:
- Above 0.5 = Premium
- Below 0.5 = Discount
- 0.5 = Equilibrium
So Range High is Premium and Range Low is Discount. Stretch the extremes a little further and you get Extreme Premium (which lines up with HTF Supply) and Extreme Discount (which lines up with HTF Demand). That's why this whole concept is heavily linked to 🎁Supply & Demand — premium and discount tell you the where; supply and demand tell you the why.
The rules are blunt:
- On a premium area, you look for shorts. On an extreme premium area, YOU LOOK FOR SHORTS.
- On a discount area, you look for longs. On an extreme discount area, YOU LOOK FOR LONGS.
I don't take a long if the price isn't in the discount zone. I don't take a short if the price isn't in the premium zone. That's the OTE — Optimal Trade Entry: longs at discount, shorts at premium.
The main purpose of using discount and premium zones is to show where the risk-to-reward ratio is more favorable. The lower you buy and the higher you sell, the better the R/R, but with experience you'll get better at timing such key events.
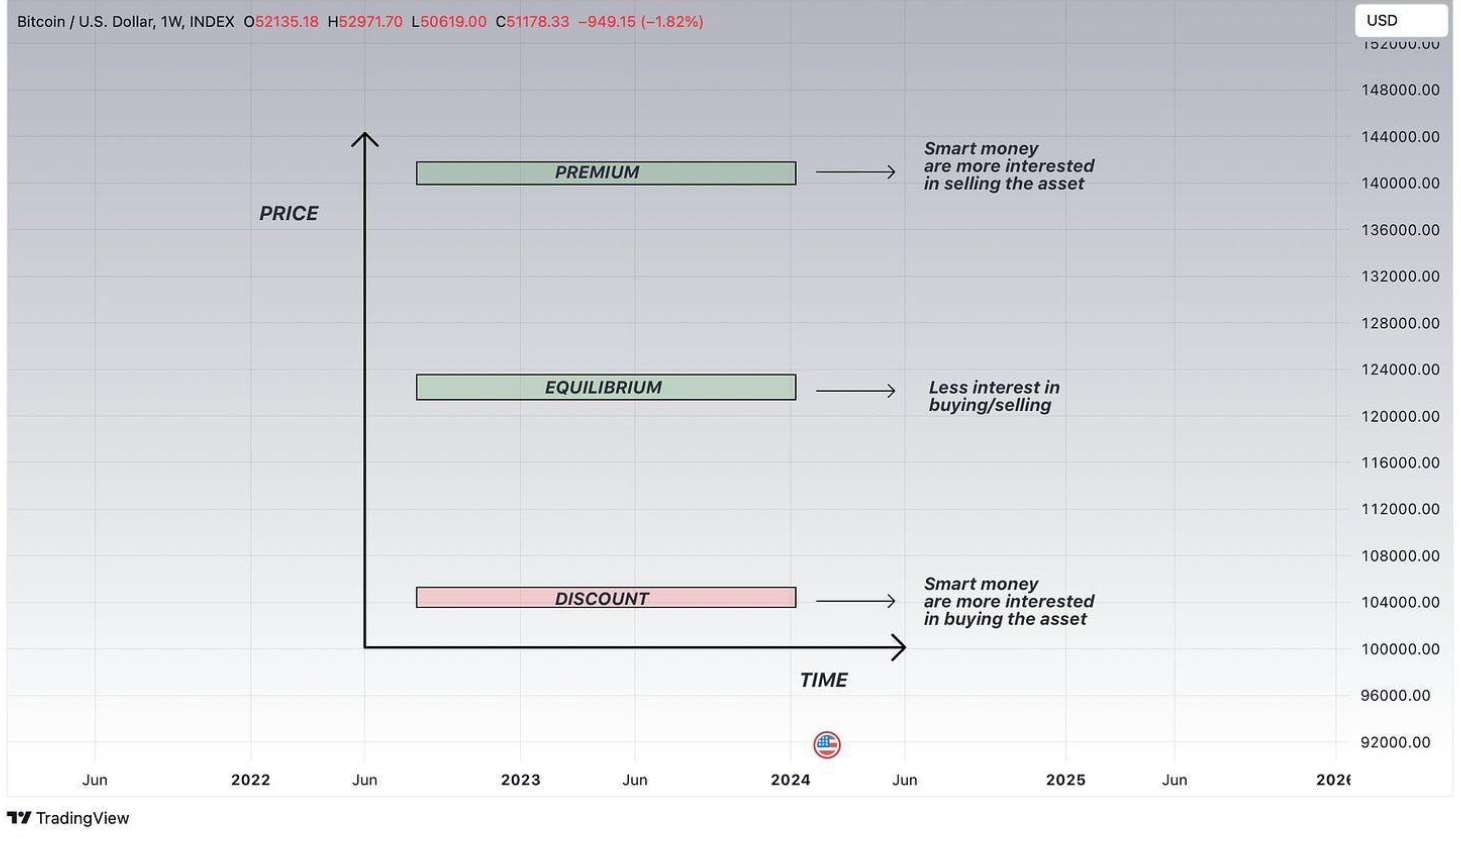
Why It Works: Whales, Smart Money, and Bag-Holders
It's not complicated: whales buy at extreme discount while deploying bearish news and unload at extreme premium while deploying bullish news.
When an asset is at a discount, that's when it's deemed cheap, and that's when whales like to buy/long their assets — that's accumulation. When an asset is at a premium, that's when it's deemed expensive, and that's when whales like to sell/short — that's distribution. The more price goes to the premium area, the more smart money is inclined to sell. The more price goes down to the discount area, the more smart money is interested in buying.
There are also tells that don't require a chart at all:
- You know prices are at Premium to extreme-Premium when Billionaires are shillin' their bags.
- You know prices are at Discount to extreme-Discount when Billionaires are quiet about cryptocurrencies.
Should be common sense. But it's good that it isn't. Someone has to buy our bags.
You win this game when you can be on time to buy at HTF Demand and sell at HTF Supply. You wait for an extreme Discount level and buy + look for long opportunities. You wait for an extreme Premium level and sell + look for short opportunities.
This doesn't mean it's a certainty the bottom is in. But anyone equipped with 🎁Supply & Demand knowledge is on the right side. You find the opportunities, profit, and then run as far as you can with the profit — otherwise you might just round-trip, as all 💎🙌 do.
Two Important Cautions on the Word "Cheap"
Price at a discount zone does not mean it's cheap. Price 65% from ATH does not mean it's cheap. These are positional terms — they describe location relative to the range, not absolute value.
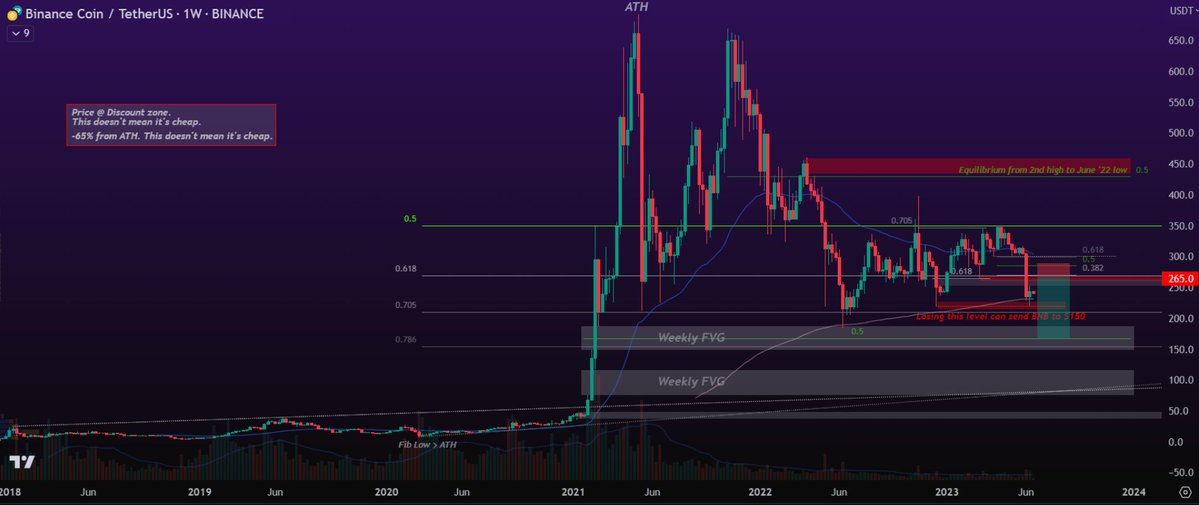
So discount/premium is a probability framework, not a guarantee. You're not buying because the asset is cheap; you're buying because the location skews R/R in your favor.
How to Apply It: Find the Range, Drop the Fib
The workflow is mechanical:
- Identify the range. Find the SL (swing low) and SH (swing high).
- Drop the 🔷Fibonacci Levels tool. Below the equilibrium is your discount zone where you buy/long. Above the equilibrium is your premium zone where you sell/short.
- Place the Fib tool from the SL to SH so your Fib levels line up inside your discount zone, or place it from the SH to SL so the levels line up inside your premium zone — that's how you build Confluence.
This matters because the Fib levels will line up with key levels (Support & Resistance), helping you identify where and when to execute. You will learn more about all there is to Fib retracement mechanics in a future lesson. For now, just follow along
There is not just one range within price action — there are multiple ranges within ranges. Best to look at the HTF because that's where you'll make the most money, and that's where smart money operates. I suggest you apply this concept to HTFs because that's the TF used by smart money and the one that rules the charts. You can apply it to LTFs too, of course.
Worked Example: Bitcoin Range from the 2020-2022 Cycle
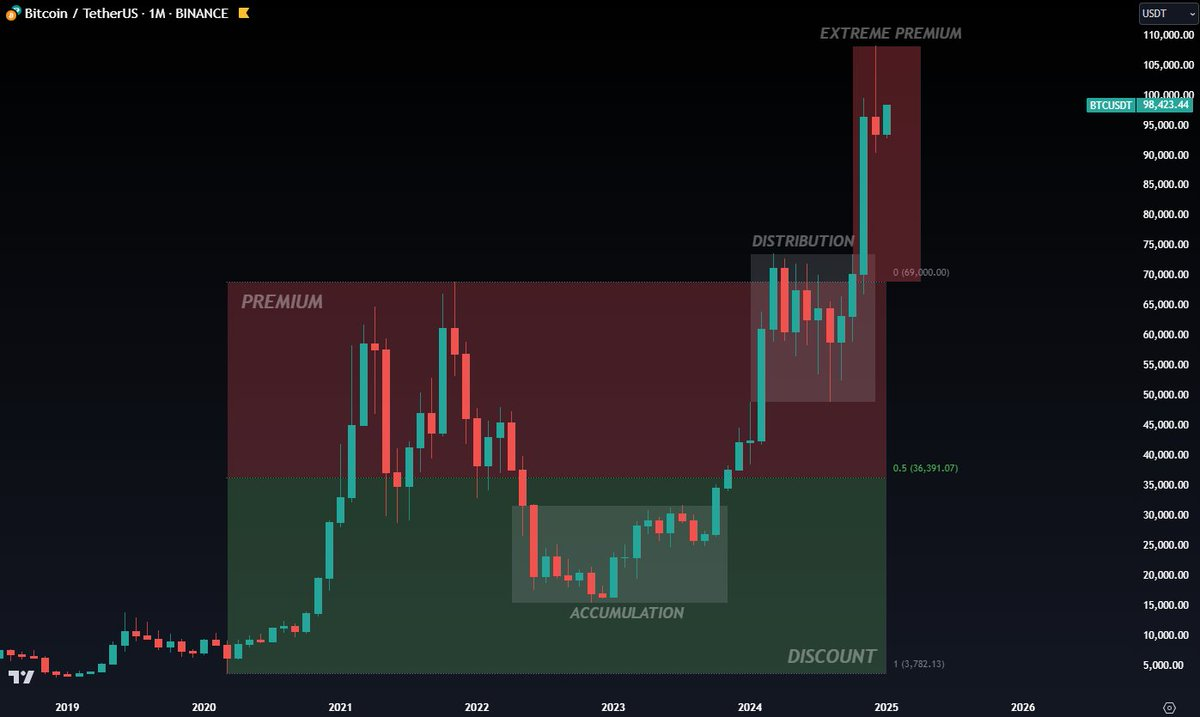
Place the SL at $3.8k and the SH at $69k from the last cycle. Anything below the equilibrium ($36k) is at a discount. You'd accumulate in the discount zone and scale out as price moves into premium.
If you're a passive investor, you can DCA in the discounted zone — as long as you know how to scale out in the premium zone. Don't DCA blindly without knowing how to properly get in and out of the market. Read the market.
If you want to be more accurate, identify the key levels and wait for the market structure to shift for confirmation before buying — especially for altcoins. Without that confirmation from key levels and market structure, never buy an altcoin. They're too volatile and unpredictable.
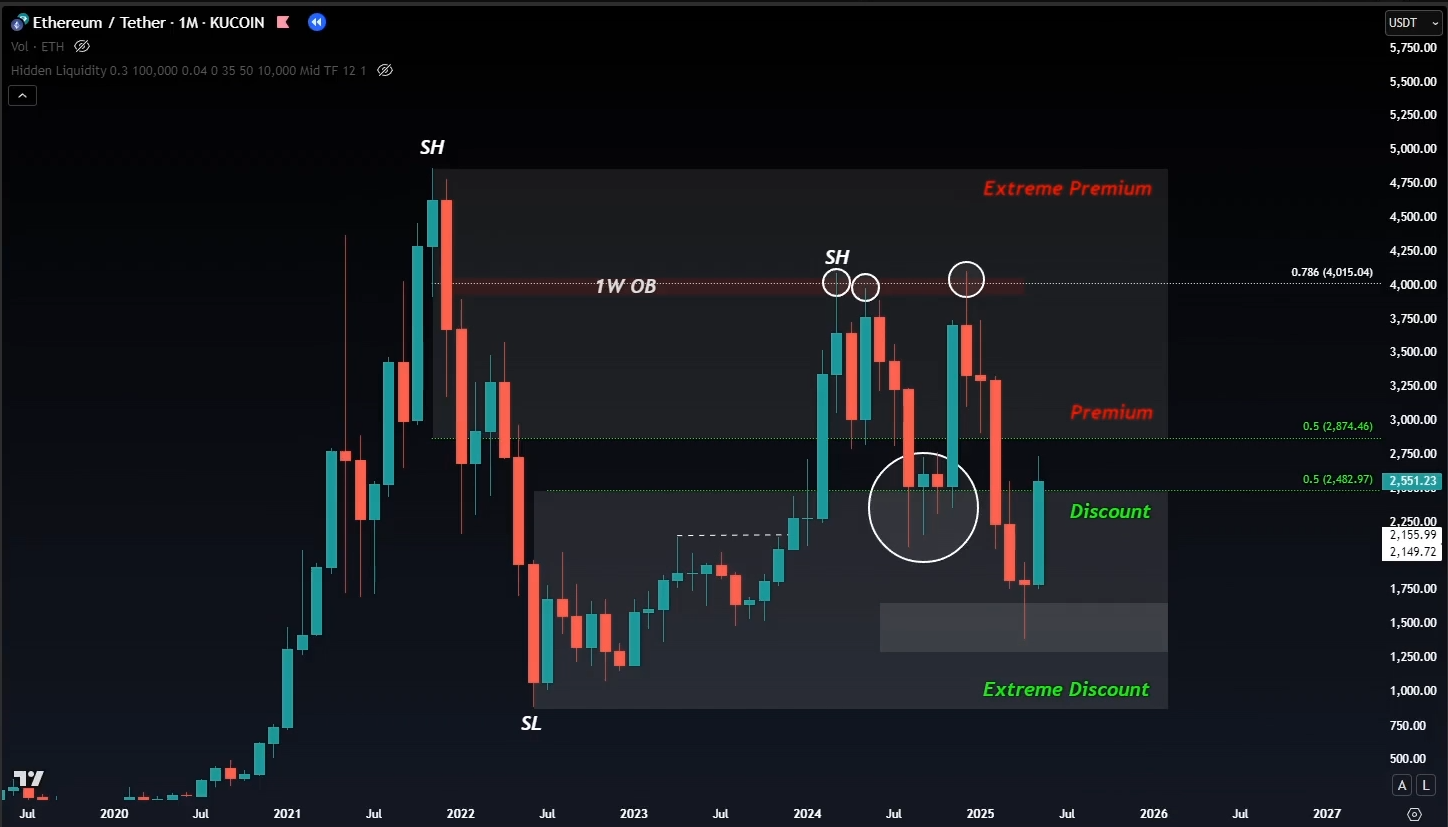
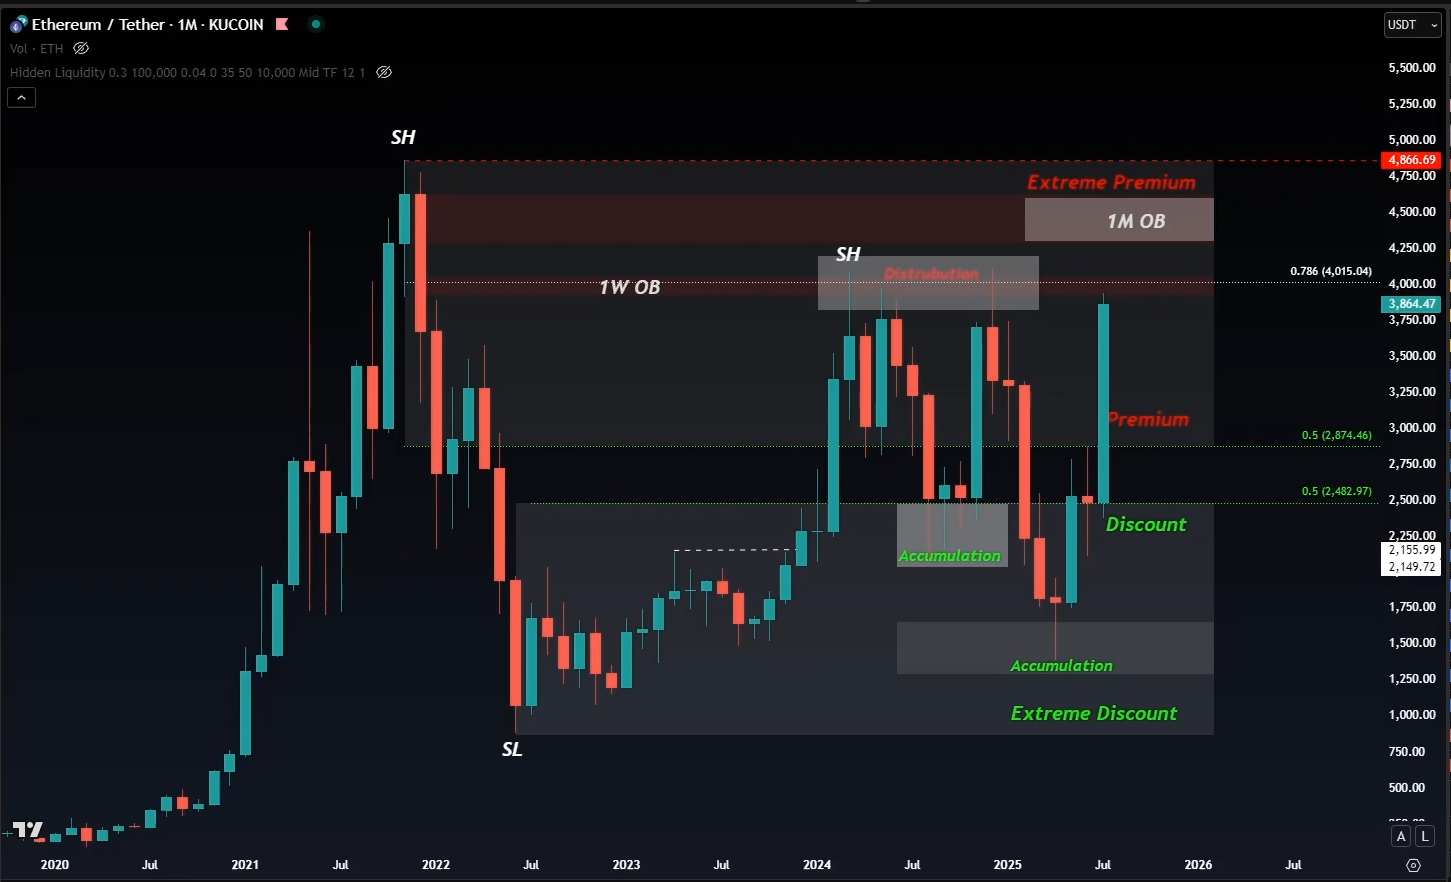
Worked Example: Ethereum Through the Same Lens
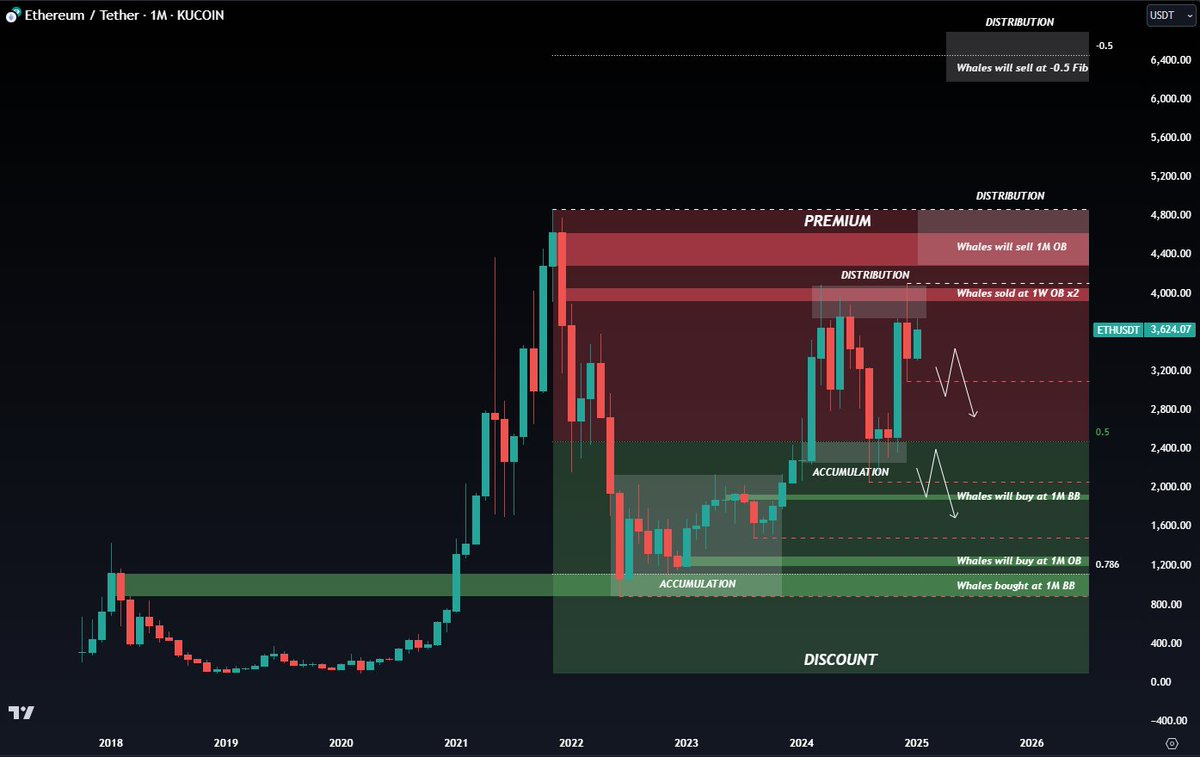
Pretend we're near the top of the cycle in Q4 2021. SL at $86, SH at $4.86k. Anything below the equilibrium ($2.43k) is at a discount where whales have an interest in buying. The bullish market finished in Nov '21, and now you know the most reasonable place to buy.
Liquidity sits at the 1M BB, and macro charts (BTC, TV totals, USDT.D) help justify timing. We already know we're in a discounted zone, so it's a good time to accumulate and then distribute in the premium zone — same playbook as the whales.
Refining the Entry: MSS, Order Blocks, and Confluence
The framework gets sharper when you add confirmation. Take the same Bitcoin range, but now we're near the 2022 lows and don't truly know if it's the bottom. Bitcoin is starting to attract whales as it hits the demand area (14k–20k), and the RSI is rising while PA falls.
We can do better — for an insane R/R.
First, wait for a MSS to confirm the market wants to move into an uptrend. On the weekly TF, PA closed above its PSH at around 21.5k. Now identify a key level that PA may want to take before moving up.
Going back to premium and discount: identify the newly created range, place the Fib tool from a SL to a SH, and now any order block that lines up with the equilibrium or below is an opportunity to buy/long at a discounted price.
Starting from the HTF, a 1M HOB was left behind during the accumulation phase with a 0.5 Fib right in the middle — that's Confluence. Refine to the 1D TF and you find a 1D OB hidden by 2 FVGs, which was the perfect local bottom as PA tested this area after the MSS.
Another MSS printed shortly after at around 25k and 32k, which confirmed the uptrend bias — confluence to hold the position for the long run. Held with proper risk management, the current R/R would be 100+. Learn how to identify these from REFINEMENT, ORDER BLOCKS Basics, and MARKET STRUCTURE.
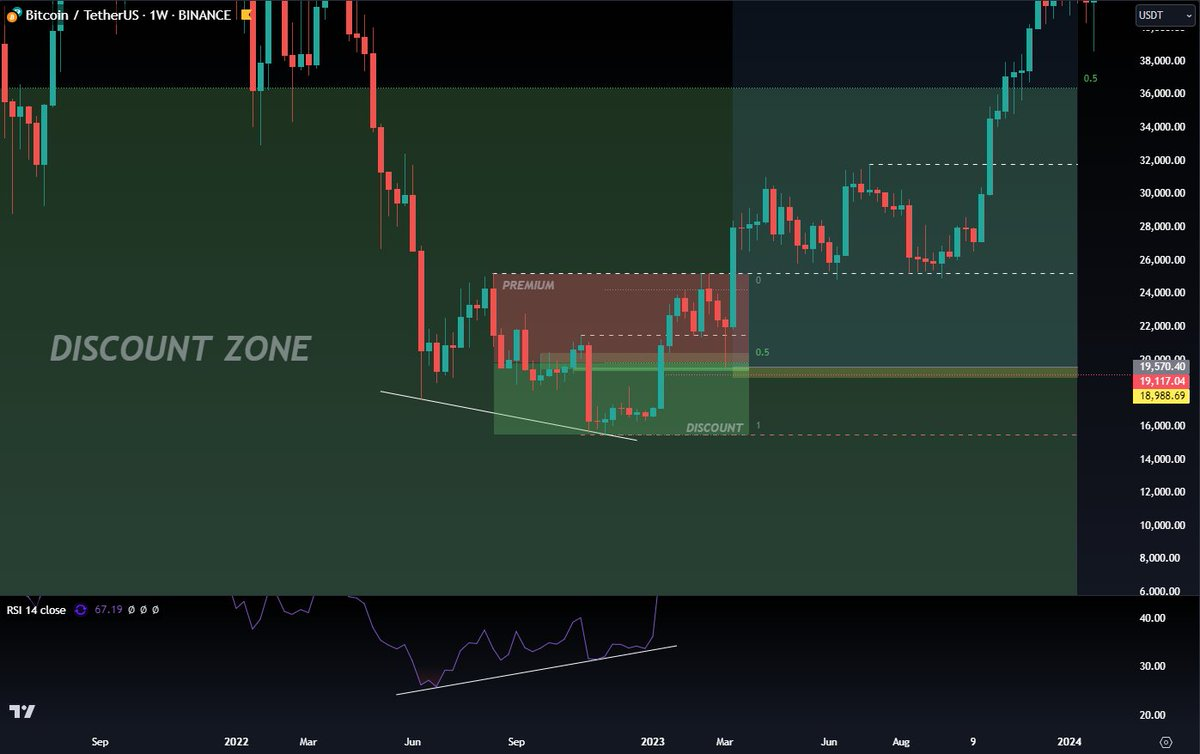
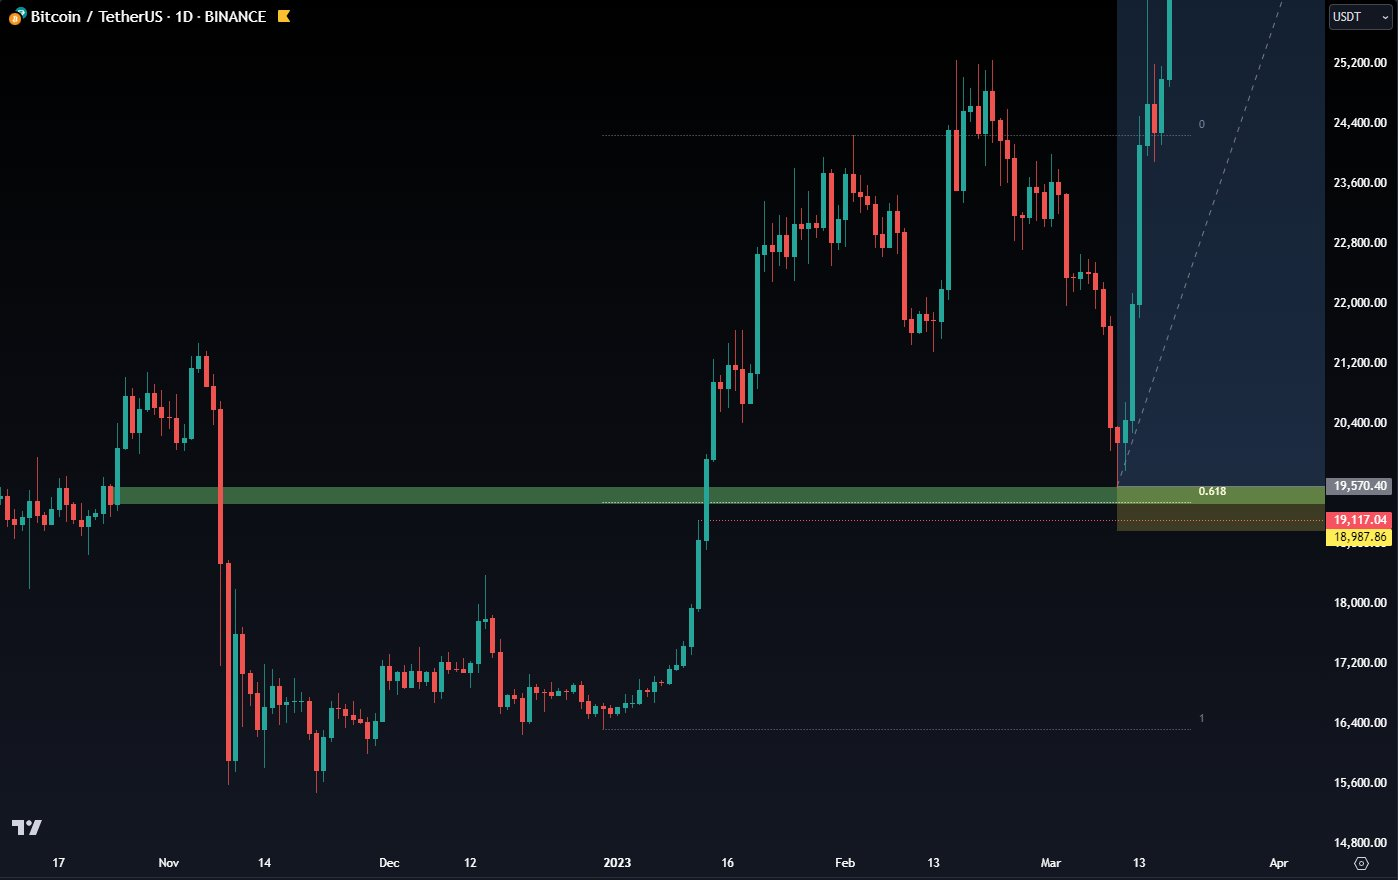
Equilibrium and Discount in Action
Here's a Bitcoin weekly chart post bear-market bottom.
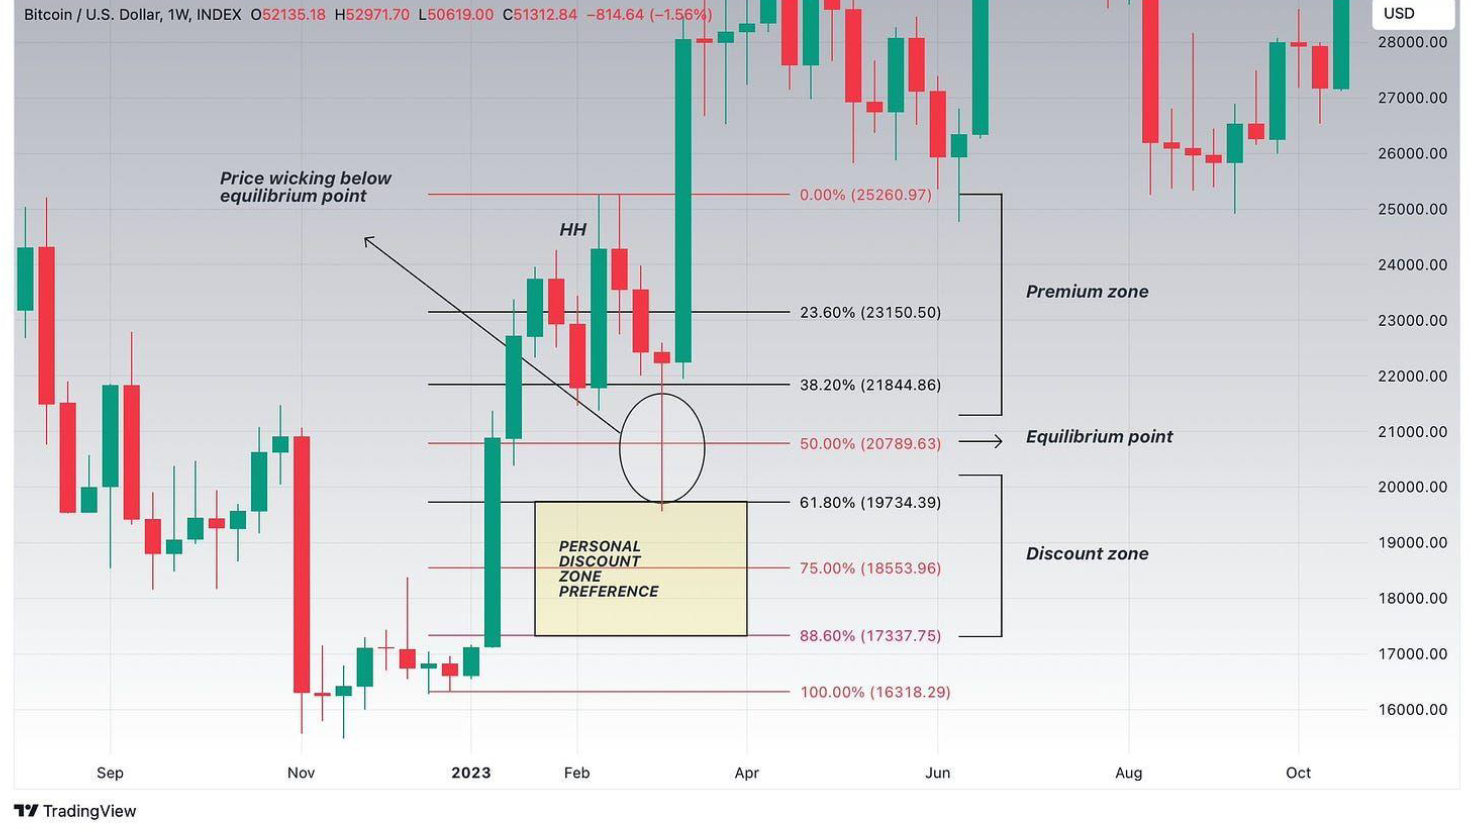
Price began to rise, initiating an impulse that surpassed the previous ones, flashing the start of an uptrend marked by a higher high. Then came the retracement. But until where?
Using the Fibonacci retracement tool and the principle of discount areas, we want to buy when price falls below the equilibrium point (0.5), preferably. Personally, I'll wait for price to reach the yellow box (0.886 / 0.75 / 0.618). You can set up these percentages on the Fib retracement tool. That's where I'm placing buy orders in an HTF uptrend.
In this case, Bitcoin wicked below 0.5 without giving much time for people to take advantage of the discount zone — that's a tell of strong momentum.
Take note: the price doesn't have to fall back below the equilibrium point every time. Sometimes price continues to rip regardless, not offering the possibility to buy at a discount. It's always a matter of probabilities.
Equilibrium and Premium: The Downtrend Mirror
The same logic flips in a downtrend.
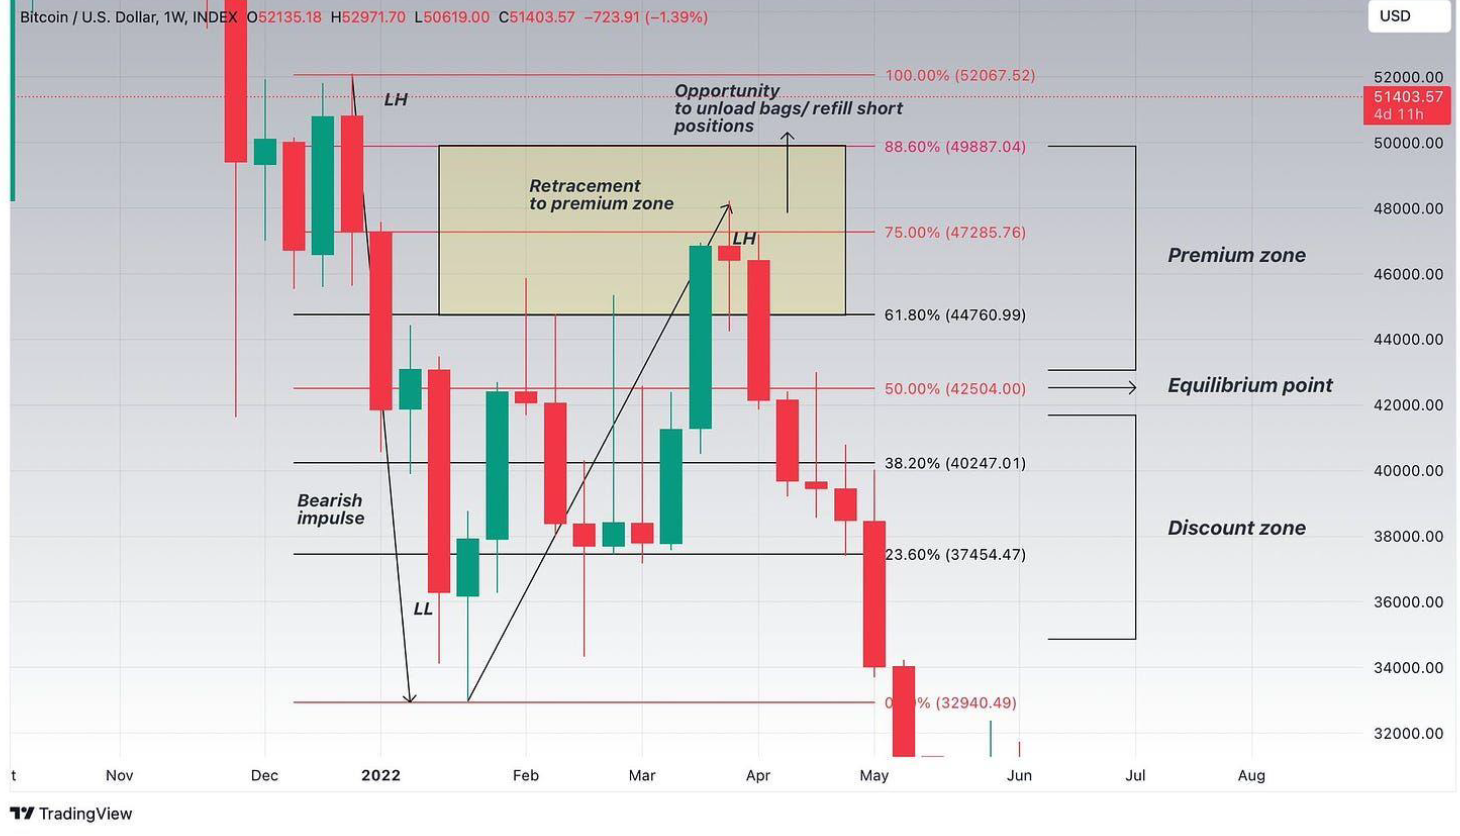
We had a BOMS (break of market structure) which led to a bearish impulse. Price then jumped back above the equilibrium point, entering the premium zone and providing a juicy area where to unload bags (0.886 / 0.75 / 0.618). Same caveat: no guarantee price retraces to premium levels, but if it does, the radar should be on.
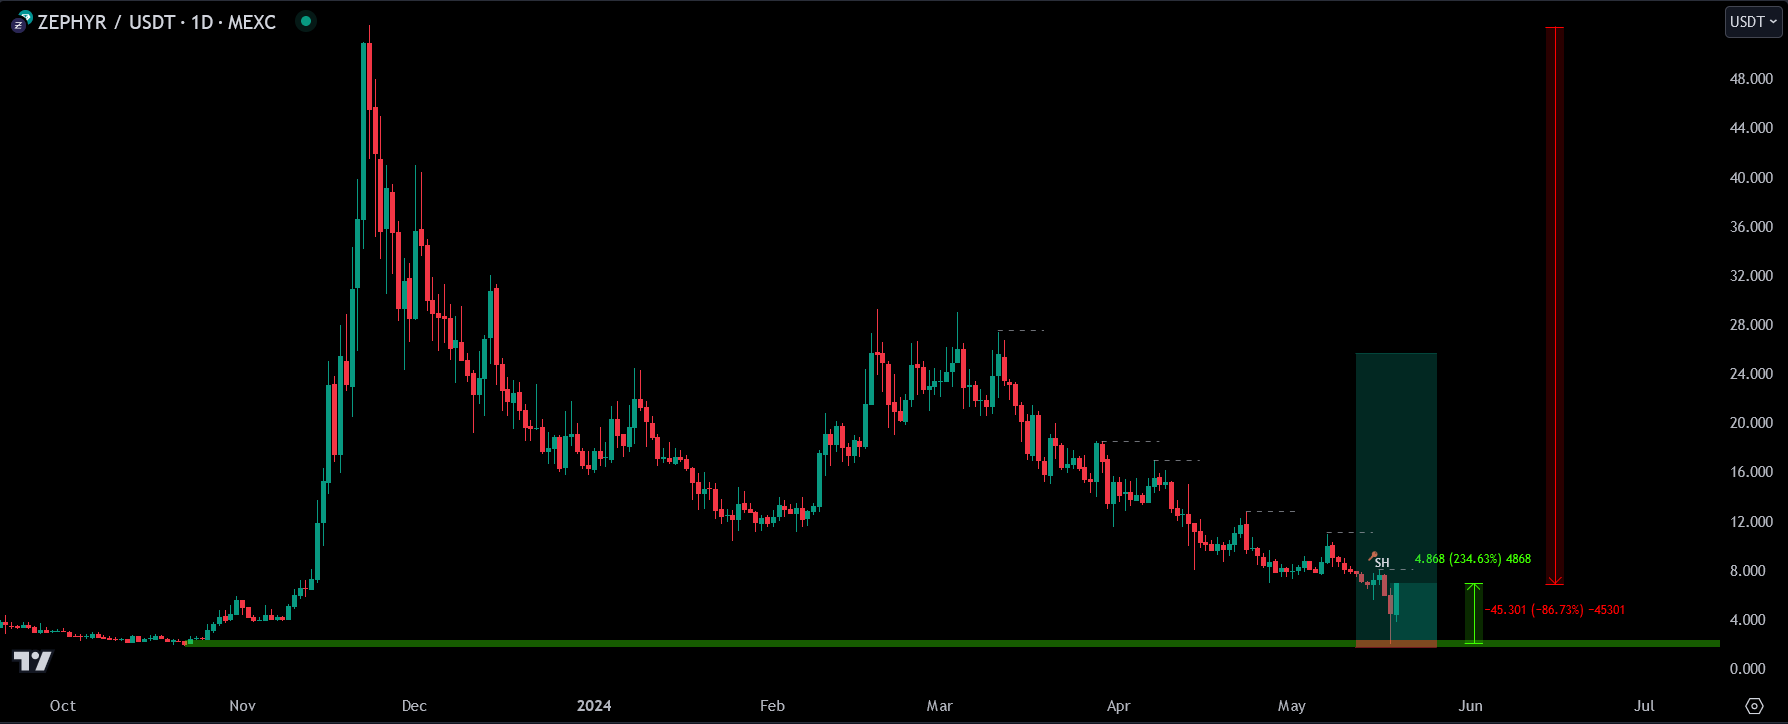
KUJI: A Clean Discount Buy
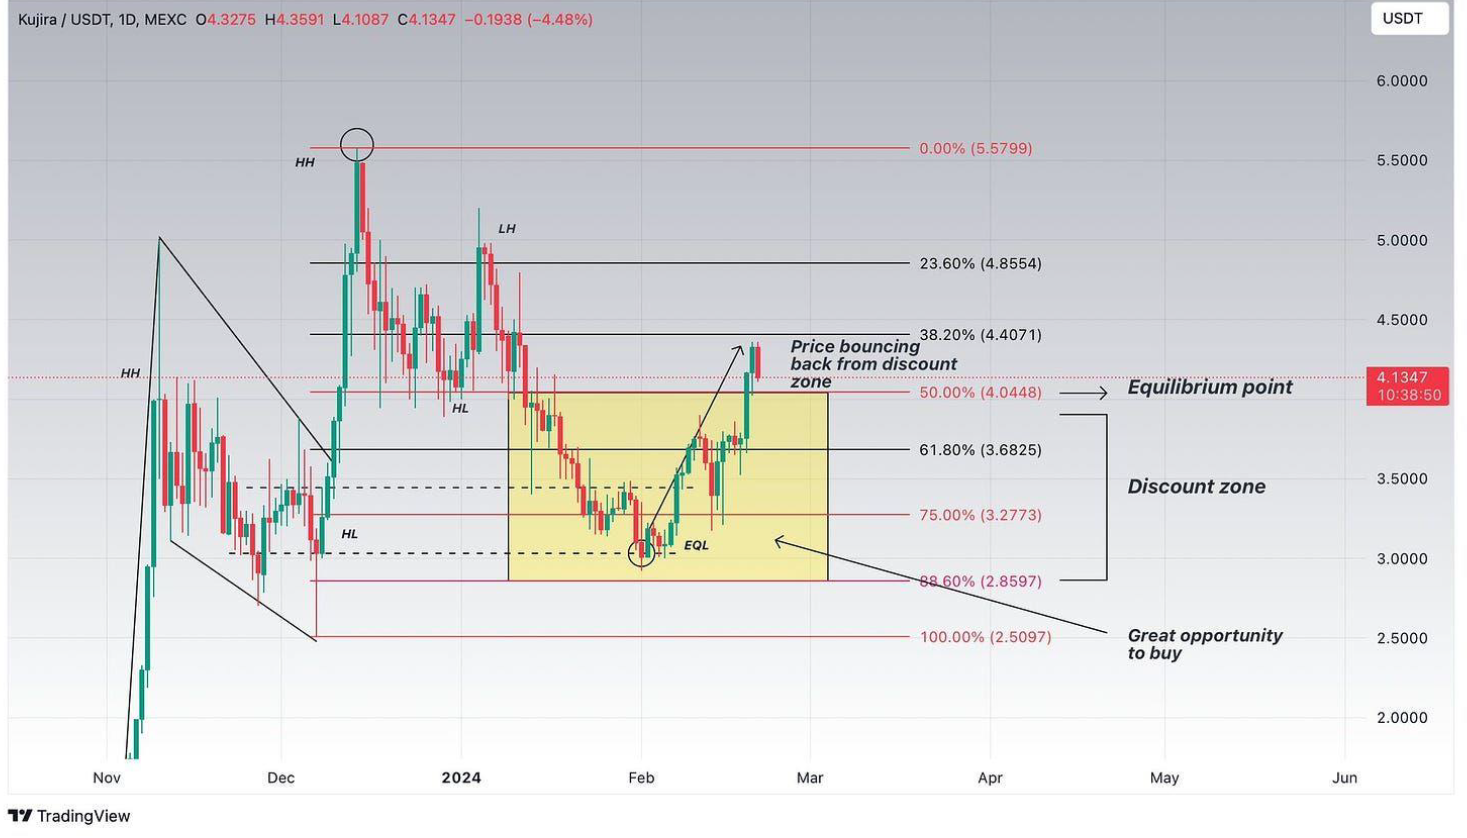
After starting its retracement from January's high, KUJI broke below the equilibrium point and fell toward the discount zone, printing an EQL (equal low) which confirmed the overall bullish structure. Buying inside the box gave a great opportunity — it bounced back above the 0.5 with roughly a +40% move.
Take note: if a trend is very strong, you might not get the discount entries you're waiting for. That's why P&D becomes even more powerful in a sideways/ranging market. Use this concept together with FVG, Imbalance and Market Structure.
Equilibrium: Why 0.5 Is Special
Beyond marking the boundary between discount and premium, the 0.5 fib has its own gravitational pull. 0.5 fib equilibrium is where Algos🐋 always go back to.
Algos want equilibrium in the markets. Not every single day, but when the market is too high for too long, or too low for too long, it always reverses, and the target is equilibrium @ 0.5 Fib.
This is an HTF play, to enter at the bottom if it gives one:
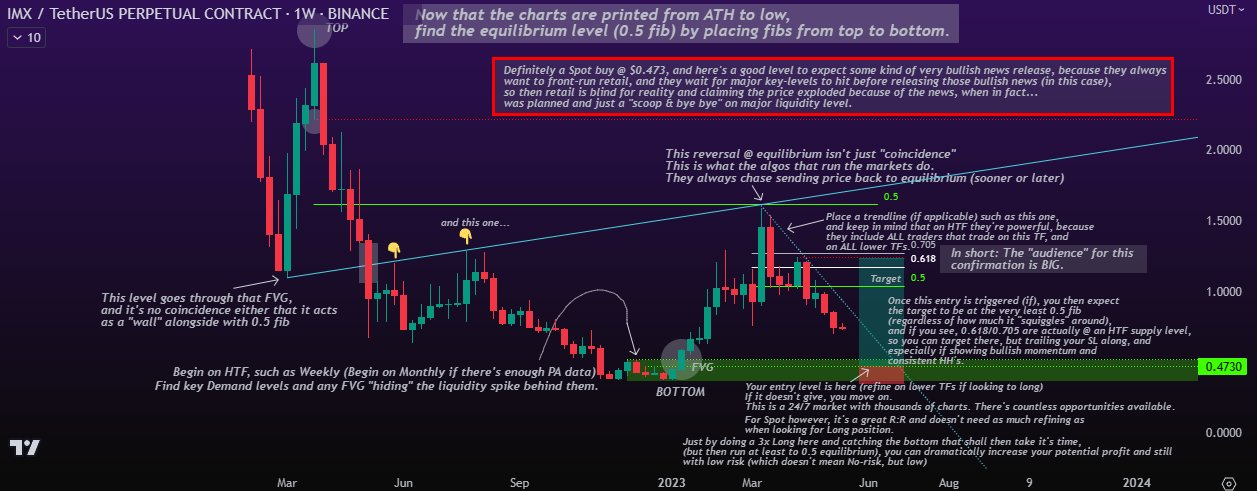
This reversal at equilibrium isn't just coincidence. This is what the algos that run the markets do — they always chase sending price back to equilibrium, sooner or later.
Why is the equilibrium of an FVG or order block stronger than, say, the beginning of an OB? Just how algos work. Backtest on it or gain experience and you'll notice it.
A practical detail: when calculating the 0.5 fib of an order block, use the body, not the wick. You'll find that's how I draw it on charts.
When an OB sits behind an FVG and becomes a bullish BB, you can target the BB's 0.5 fib for bullish continuation:

And the equilibrium of OBs/BBs is much weaker on LTFs vs HTFs, which is the same lesson we keep returning to — the higher the timeframe, the cleaner the algo behavior.
Examples of Algos Hunting Equilibrium
A Bitcoin example from Nov 2023 showing price magnetized to 0.5:
Refinement and the Only Fib I Use on Order Blocks
The other fib levels you see on charts have specific roles:
- 0.62 and 0.79 are just rounded numbers — not the same as the exact 0.618 and 0.786.
- The other fib levels (0.618, 0.705, 0.786) are useful to find liquidity levels. Then you zoom in to find a 0.5 fib on the OB.
My favorite fib level is 0.5, especially when in confluence with an OB. The only fib on OBs I use is 0.5.
Refining is by finding more key levels on lower TFs, starting with the highest TF possible. The answer is in watching closely through different timeframes.
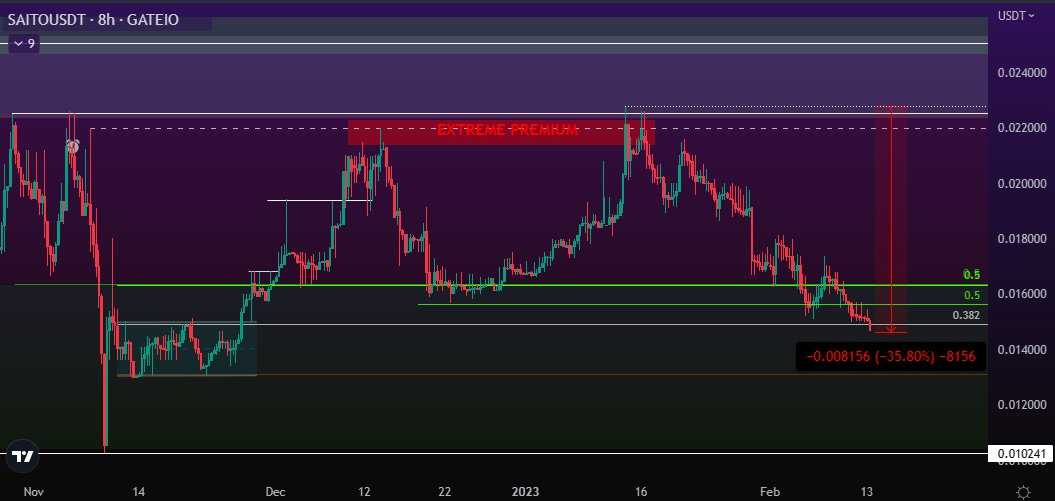
Real-Time Example: SAITO at 0.382
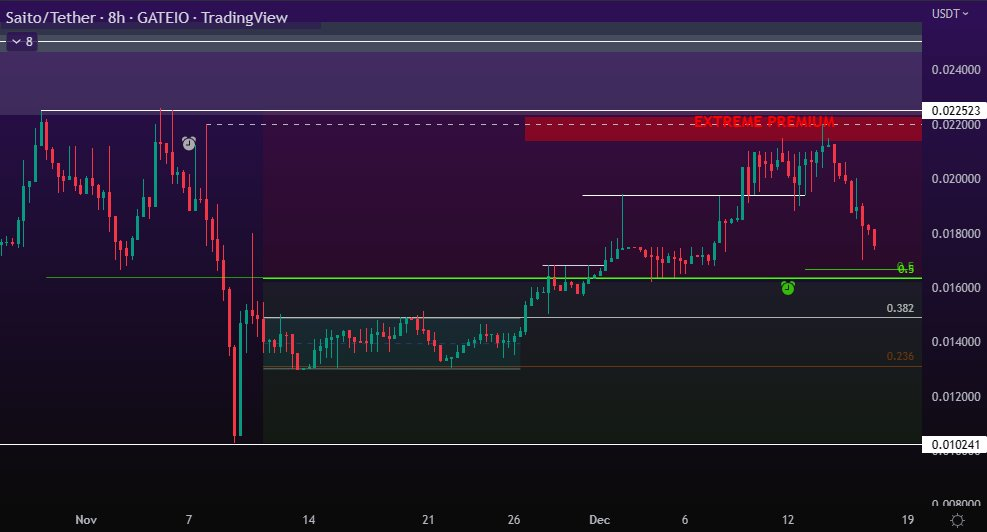
SAITO reversed exactly where expected — be adding again below the 0.382 fib. Goal: free fat bag.
Two months later:
In this game it's all about being patient and knowledgeable. Permabull noobs live in denial and don't accept or understand how the liquidity games work. Shared the bottom and the top early.
Real-Time Example: Extreme Premium with Parabola Break
Extreme premium, broke the parabola — target 0.5 fib. Same principle, different chart: when price is way out at extreme premium and the structure cracks, the magnet is equilibrium.
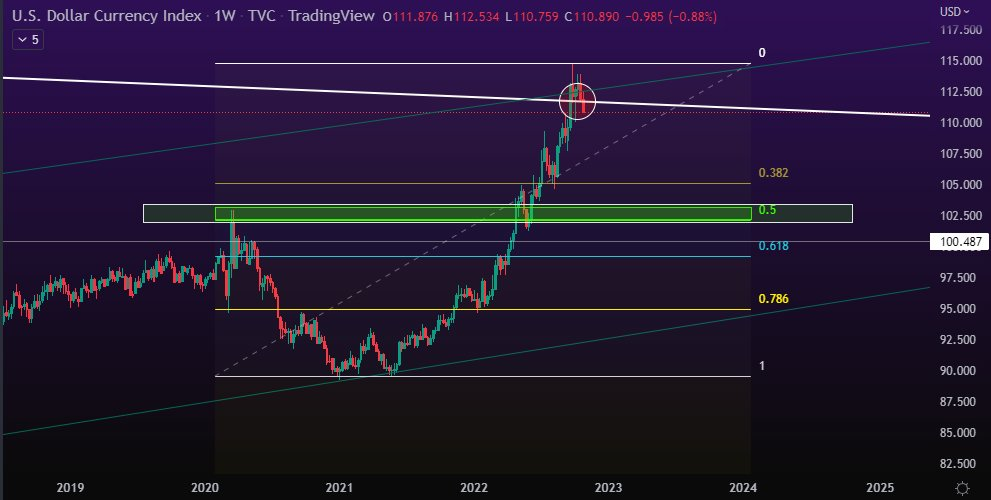
Real-Time Example: Bitcoin HTF Macro
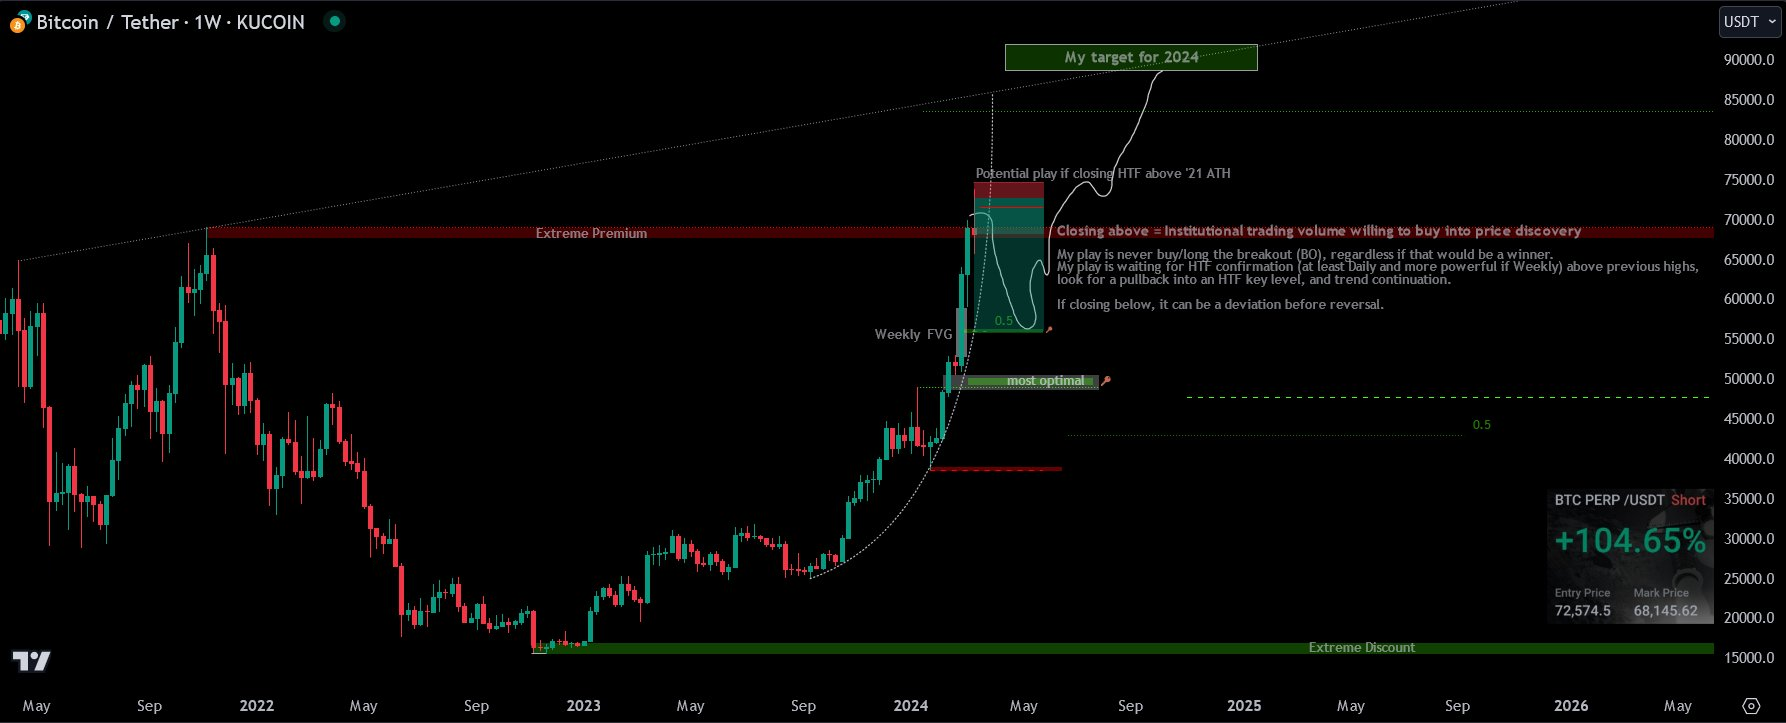
Bitcoin HTF macro: deviation above the '21 high confirmed on HTF. For further upside, the ideal scenario for long opportunities is an HTF close above ATH + pullback into a key level (the entry) before continuation. Breakout longs got rekt as usual.
The two most significant key levels are at the 0.5 fib of the Weekly FVG and $49,000ish. If those levels print, that's where I long on 2-5% size. Trailing a short at the moment.
Real-Time Example: AR at Extreme Discount
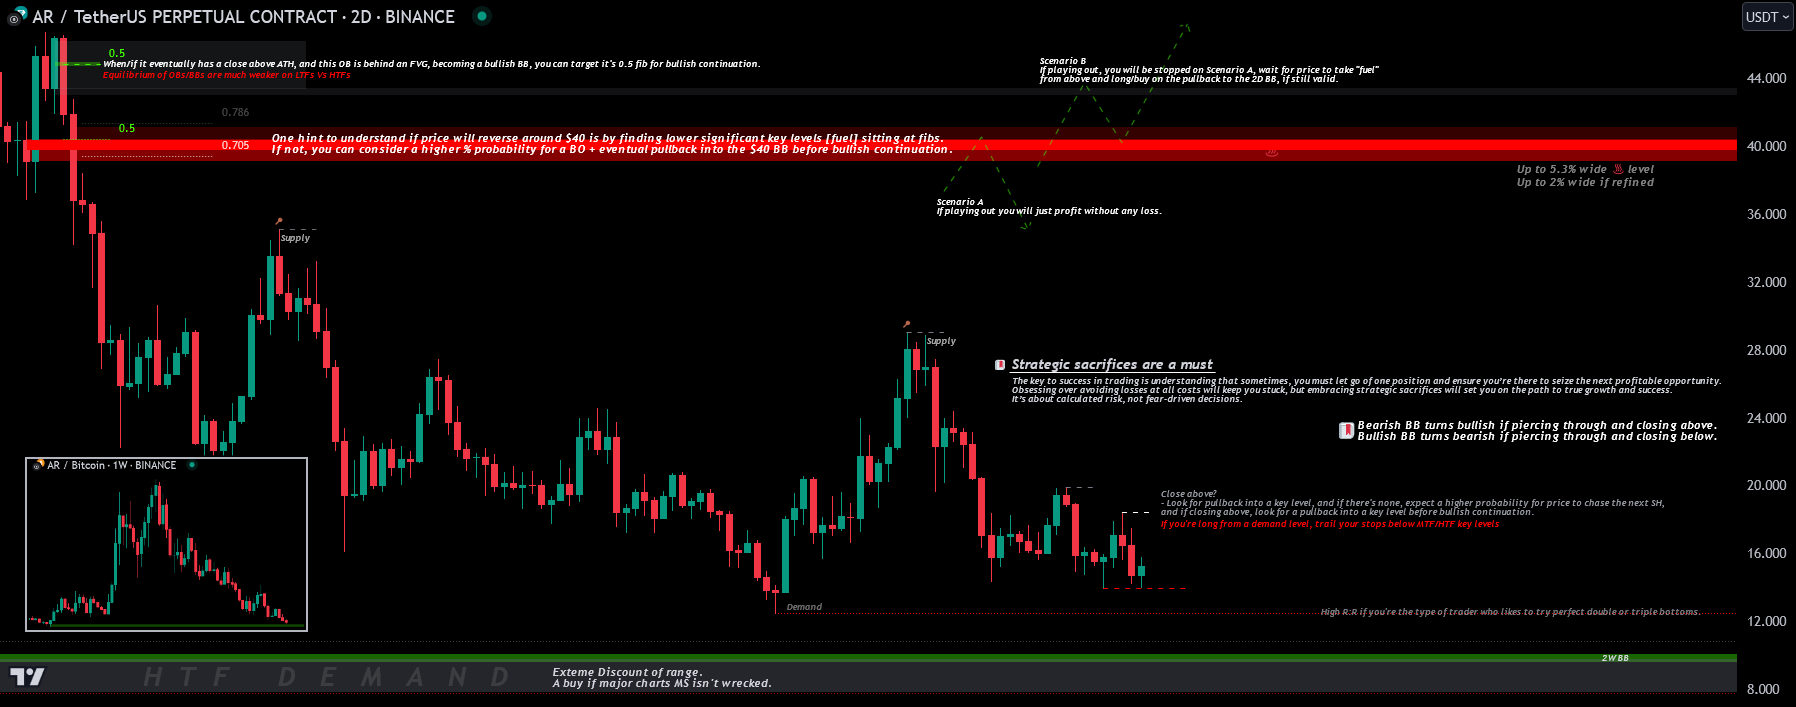
Extreme Discount of range. A buy if major charts MS isn't wrecked. That qualifier matters — extreme discount alone isn't a green light; the broader market structure has to support it.
Limit Orders at HTF Reversal Levels
If a level is HTF — and especially if starting from monthly — it's powerful. You can consider a limit order for such "optimal" levels with a % of your account and a SL. The monthly reversal level on IMX and the weekly reversal level on APT 🎁 are two examples.
These aren't only powerful levels — they're near "extreme discount" and front-run basic 🎁Supply & Demand traders. That front-running is the whole point of 🔷Premium & Discount: you're getting in before the obvious zone gets retail attention.
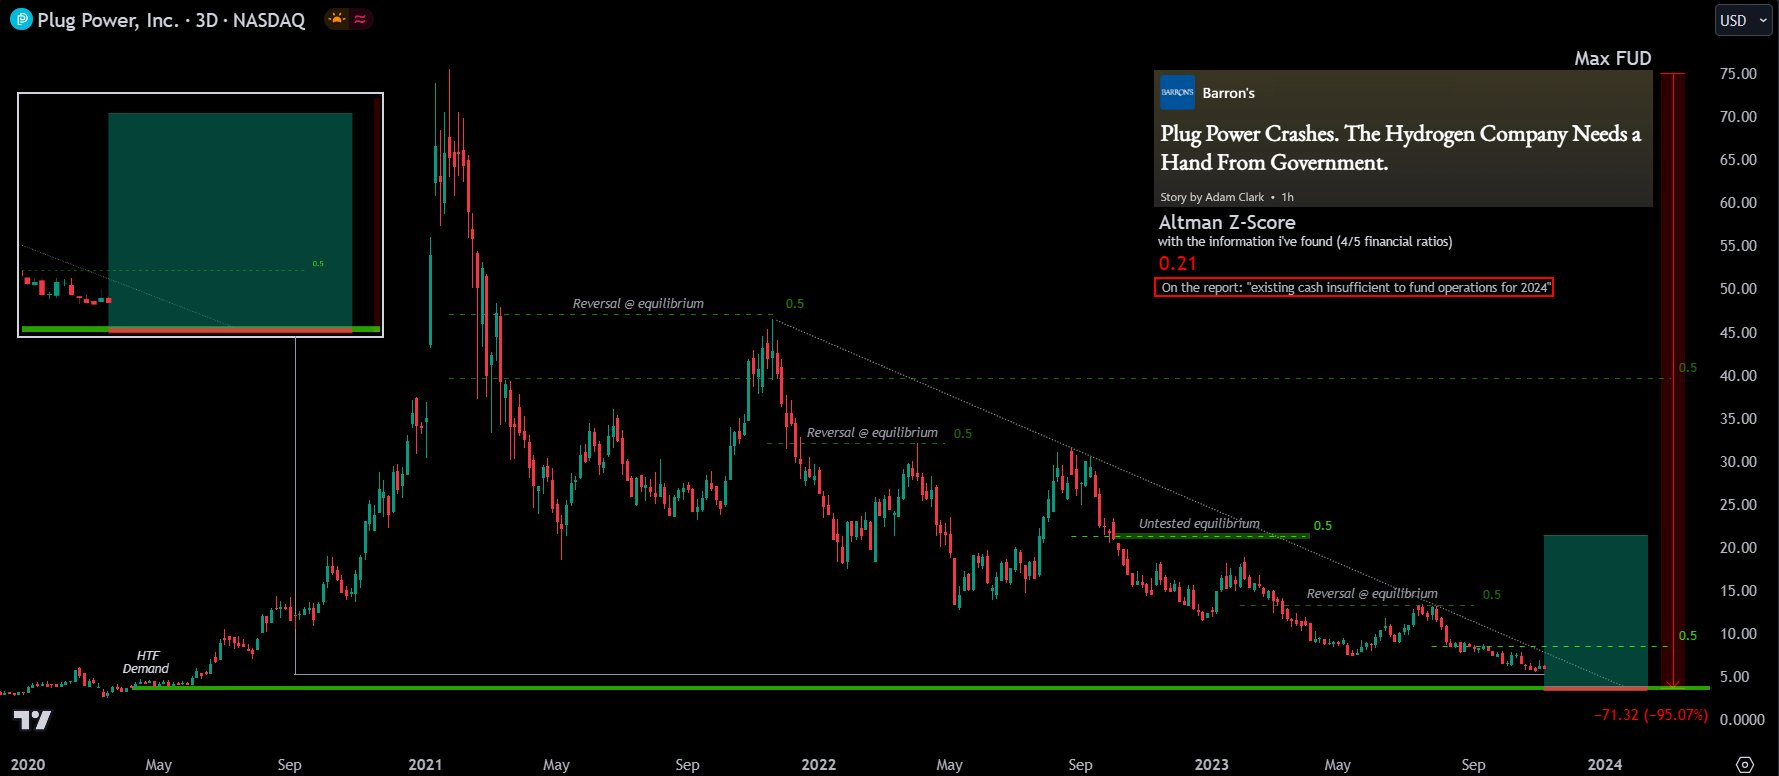
Extreme Premium: What It Looks Like in the Wild
The hardest discipline isn't buying discount — it's selling premium. When the tape is euphoric and influencers are shilling, the framework is screaming distribution.
The setup at extreme premium is always the same: bearish news goes quiet, an endless flood of bullish hopium designed to squeeze retail into buying more alts after parabolic runs. Same playbook every time — flood reasons to hold and long while obvious macro supply and market structure get ignored.
The framing is unchanged: whales buy at extreme discount while deploying bearish news and unload at extreme premium while deploying bullish news.
Charts just refine the entries and exits. The rest is common sense.
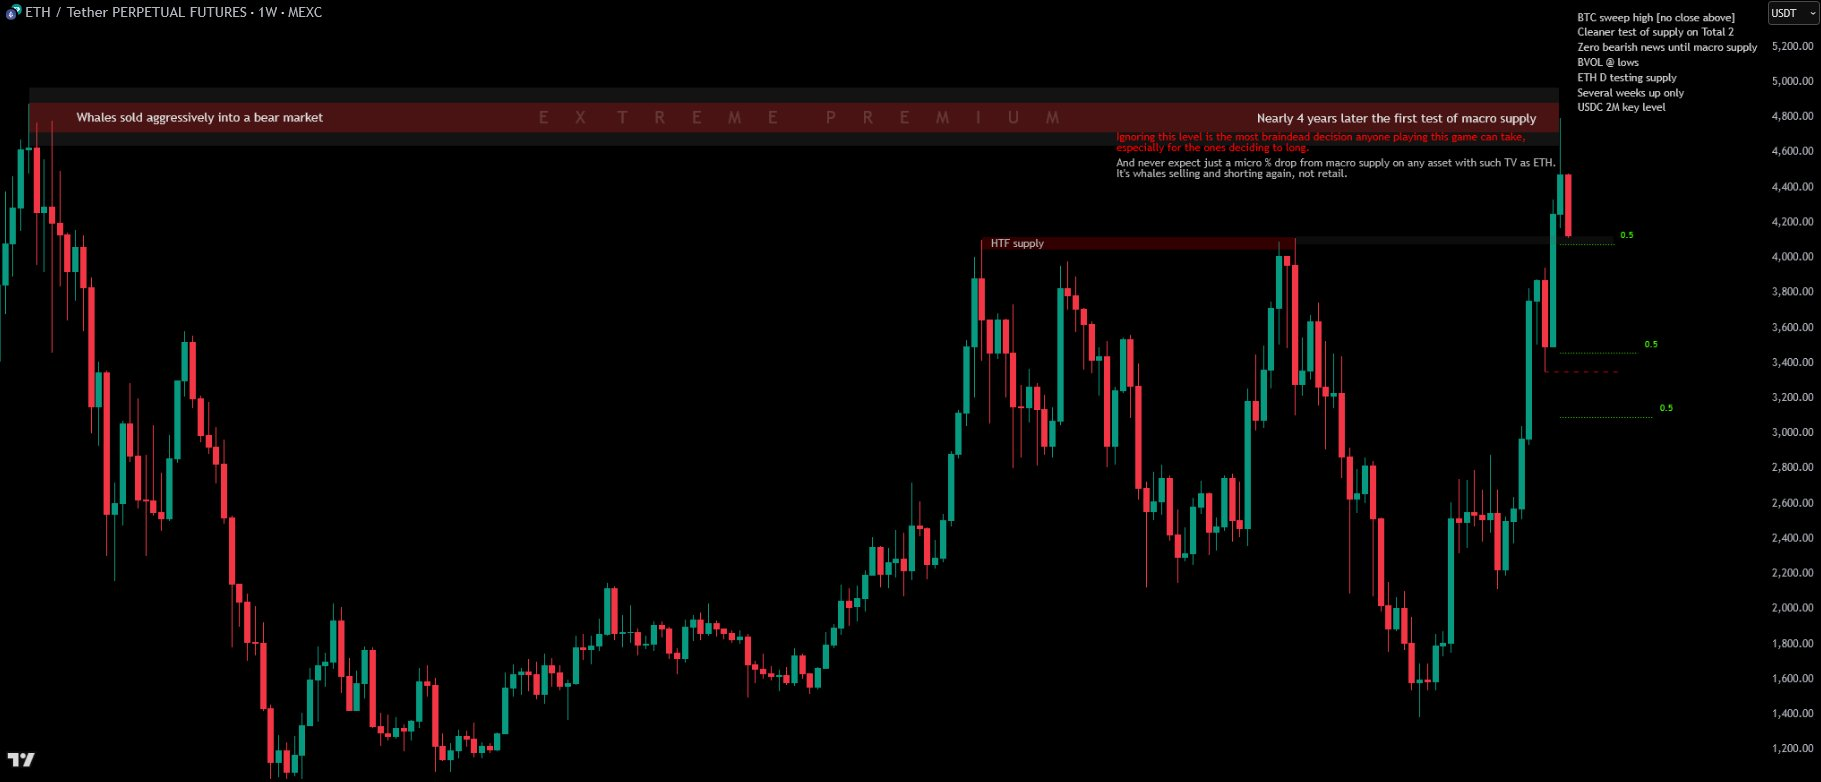
ETH's first hit to macro supply in years at $4,800 — nearly four years later, the first test of macro supply. Ignoring this level is the most braindead decision anyone playing this game can take, especially for the ones deciding to long. And never expect just a micro % drop from macro supply on any asset with such TV as ETH. It's whales selling and shorting, not retail.
When Bitcoin hits no-man's-land — between zones — you trail bullish positions only while HTF structure holds. The answers lie in ETH and the majors, not BTC.
A cluster of confluence at extreme premium often looks like:
- BTC sweep high (no close above)
- Cleaner test of supply on Total 2
- Zero bearish news until macro supply
- BVOL at lows
- ETH D testing supply
- Several weeks up only
- USDC 2M key level
This is the inverse of an extreme-discount confluence. When you see it, smart money is unloading. Whales unloading means they're all playing for the same team behind the scenes — orchestrating exits while the herd believes in "organic PA" and "fair markets."
If the real market makers are selling, it's definitely not to get back in after a 10% drop. They also short, and their timing is better than everyone else's, for obvious reasons. And it's all happening at the extreme premium of the macro range.
Putting It Together
The framework reduces to a few stable rules. Set the Fib from range high to range low — above 0.5 is premium, below 0.5 is discount, 0.5 itself is equilibrium. Buy at discount; sell at premium; expect equilibrium to act as the magnet algorithms target sooner or later.
For accuracy, wait for market structure to shift, find an order block lining up with equilibrium or below, and stack confluences across timeframes. Apply it to HTF first because that's where smart money operates, and use HTF key levels for limit orders sized appropriately with a stop.
Watch for the caveats. Discount doesn't mean cheap. Strong trends can skip the retrace entirely — premium and discount are most powerful in sideways and ranging markets. Use this concept together with FVG, Imbalance, and Market Structure — never alone, and always with invalidation in mind.
Again, the FIB is covered in a dedicated lesson in the future. There's much more utility then the FIB then what was just covered here. This includes how to actually draw / use the tool itself, so do not worry if you're sitting here confused how to even use it on your chart.
Find, wait, play, win, repeat.