Wyckoff Accumulation and Distribution
When you watch institutional money turn a market — at the bottom of a bear cycle, or at the top of a bull run — you're watching a process. Big players don't fill huge positions in a single candle. They take weeks or months. And while they're filling, price sits in a range, ranges produce specific behaviors, and those behaviors have names.
That is what Wyckoff gave us. Not a magic indicator, but a vocabulary for the institutional logic that creates the supply and demand zones you'll trade off later. This lesson walks through the Wyckoff Method from the top down — the philosophy, the laws, the events inside accumulation and distribution ranges, and finally the simplified schematics that translate Wyckoff into something tradable in modern crypto.
Why Wyckoff Still Matters
Richard Wyckoff's pioneering work in the early twentieth century was centered around one realization: stock price trends were driven primarily by institutional and other large operators who manipulate prices in their favor. Using his method, you can invest by capitalizing on the intentions of the large "smart money" interests, rather than being caught on the wrong side of the market.
The method focuses on market behavior via the combination of price action and volume. It's composed of four parts:
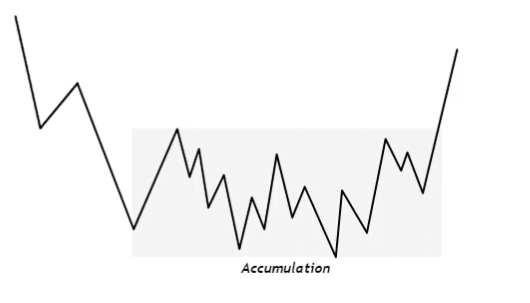
- Accumulation
- Markup
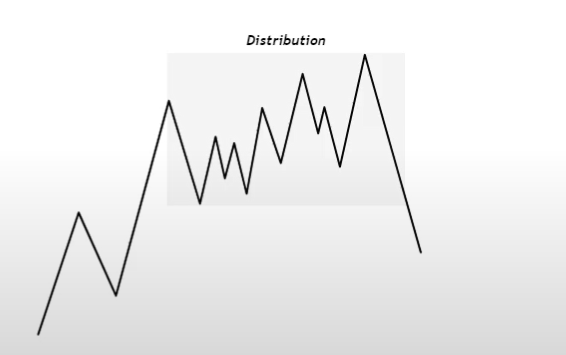
- Distribution
- Markdown
I'll go into detail on Accumulation and Distribution, because Markup and Markdown are merely the abrupt price movements that result from the two previous concepts. Markup is the consequence of an Accumulation. Markdown is the consequence of a Distribution.
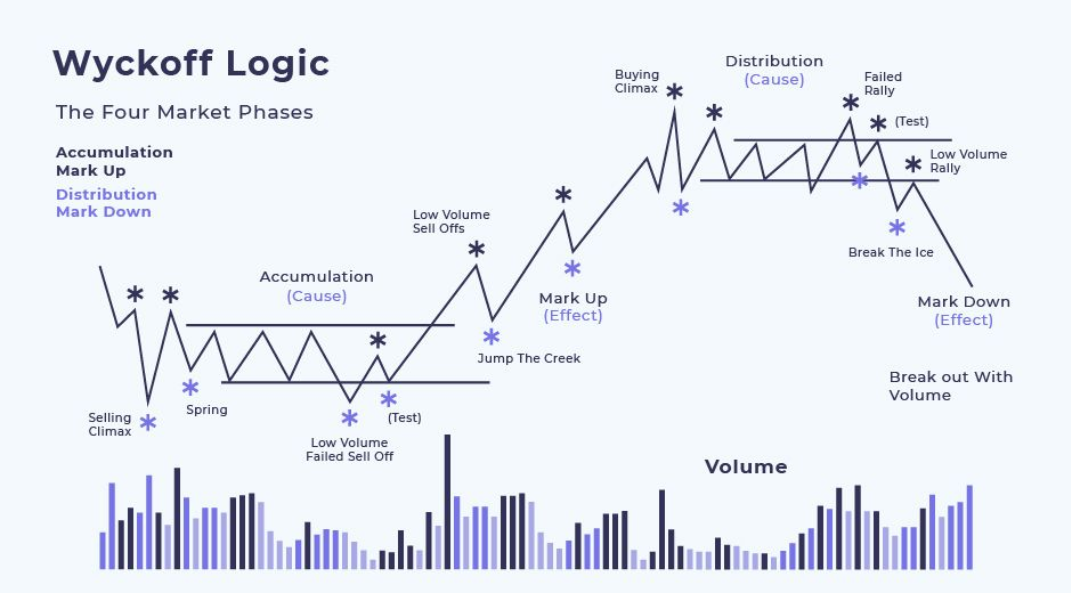
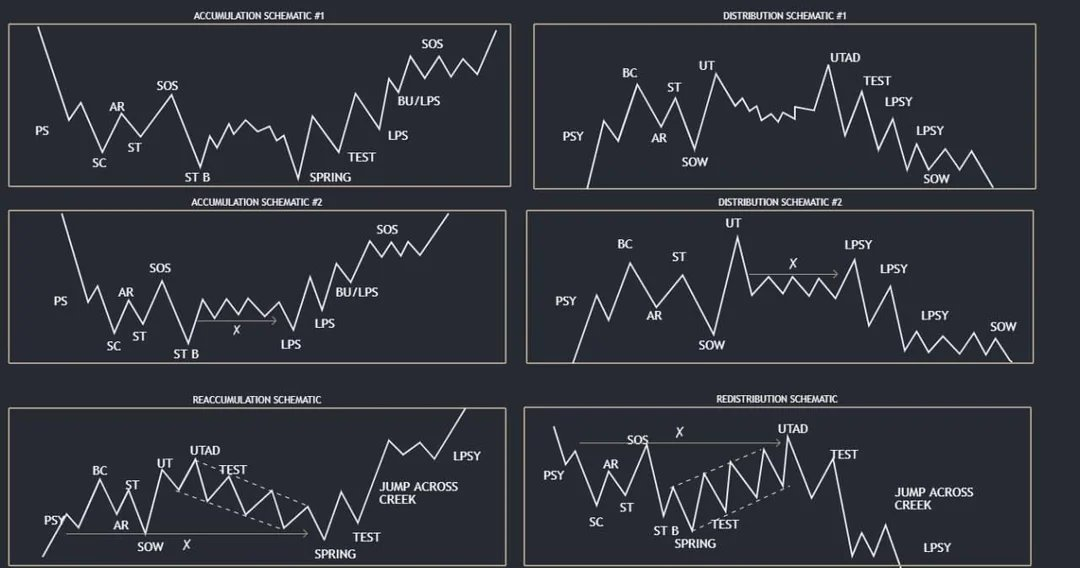
To anchor this in the bigger picture: an idealized Wyckoff schematic of how he conceptualized the large interests' preparation for and execution of bull and bear markets is depicted below.
The time to enter long orders is towards the end of the preparation for a price markup or bull market — the accumulation of large lines of stock. The time to initiate short positions is at the end of the preparation for price markdown.
The Composite Man
Wyckoff proposed a heuristic device to help understand price movements: the Composite Man. The idea is that all the fluctuations in the market and in all the various stocks should be studied as if they were the result of one operator. He sits behind the scenes, manipulates the stocks to your disadvantage if you don't understand the game, and to your great profit if you do.
Wyckoff advised retail traders to play the market the way the Composite Man played it. He observed that it doesn't actually matter if market moves are real or artificial — that is, the result of actual buying and selling by the public, or artificial buying and selling by larger operators. The pattern is the same.
Based on his observations of large operators, Wyckoff taught that:
- The Composite Man carefully plans, executes, and concludes his campaigns.
- He attracts the public to buy a stock in which he has already accumulated a sizeable line of shares — by making many transactions involving large numbers of shares, in effect advertising his stock by creating the appearance of a "broad market."
- You must study individual charts with the purpose of judging the behavior of the stock and the motives of those large operators who dominate it.
- With study and practice, you can acquire the ability to interpret the motives behind the action a chart portrays.
The Three Wyckoff Laws
The method rests on three fundamental laws.
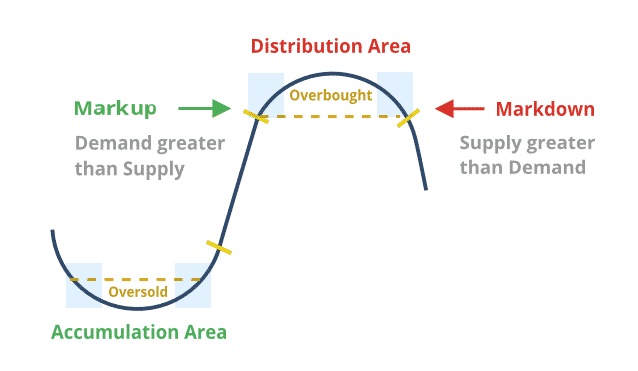
The Law of Supply and Demand determines price direction. When demand is greater than supply, prices rise. When supply is greater than demand, prices fall. Deceptively simple, but accurately evaluating supply and demand on bar charts — and understanding the implications of supply and demand patterns — takes considerable practice.
The Law of Cause and Effect helps you set price objectives by gauging the potential extent of a trend emerging from a trading range. The "cause" can be measured by the horizontal point count in a Point-and-Figure chart; the "effect" is the distance price moves corresponding to that count. The force of accumulation or distribution within a range works itself out in a subsequent trend up or down.
The Law of Effort Versus Result provides early warning of a possible trend change. Divergences between volume and price often signal a change in the direction of a price trend. For example, when there are several high-volume but narrow-range price bars after a substantial rally, with the price failing to make a new high, that suggests big interests are unloading shares in anticipation of a change in trend.
The chart below illustrates this in three reactions.
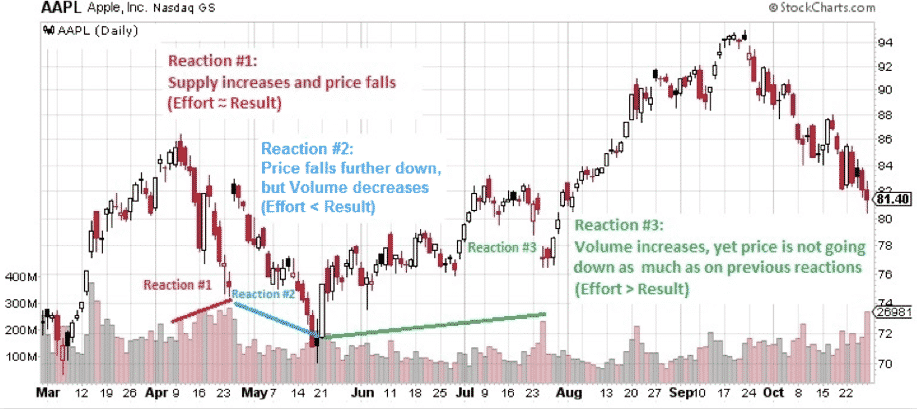
In the first reaction, prices fall on widespread bars and volume increases — harmony between volume (effort) and the decline in price (result). In the second reaction, price decreases by a similar amount but on smaller spreads and lower volume — reduced supply, suggesting potential for at least a short-term rally. In the third, the swing size decreases yet volume increases. Effort up, result down — large buyers absorbing supply in anticipation of continuation.
Trading Ranges and Equilibrium
Trading ranges are the engine room of Wyckoff. A TR is a place where the previous trend has been halted and there is relative equilibrium between supply and demand. Inside it, institutions and large professional interests prepare for their next bull or bear campaign.
In both accumulation and distribution TRs, the Composite Man is actively buying and selling. The difference:
- In accumulation, shares purchased outnumber those sold.
- In distribution, the opposite is true.
The extent of accumulation or distribution determines the cause — and thus the move — that unfolds when price leaves the TR. When sell orders exceed buy orders at any time, equilibrium is restored temporarily by a price decline to a level where supply and demand balance. The reverse happens on the way up.
This is a useful bridge to the broader curriculum on 🎁Supply & Demand, Market Structure (Intro), MARKET STRUCTURE, and RANGES Tips — the trading range is where supply and demand zones get manufactured, which is also why Supply & Demand (Wysetrade) explains why these levels matter.
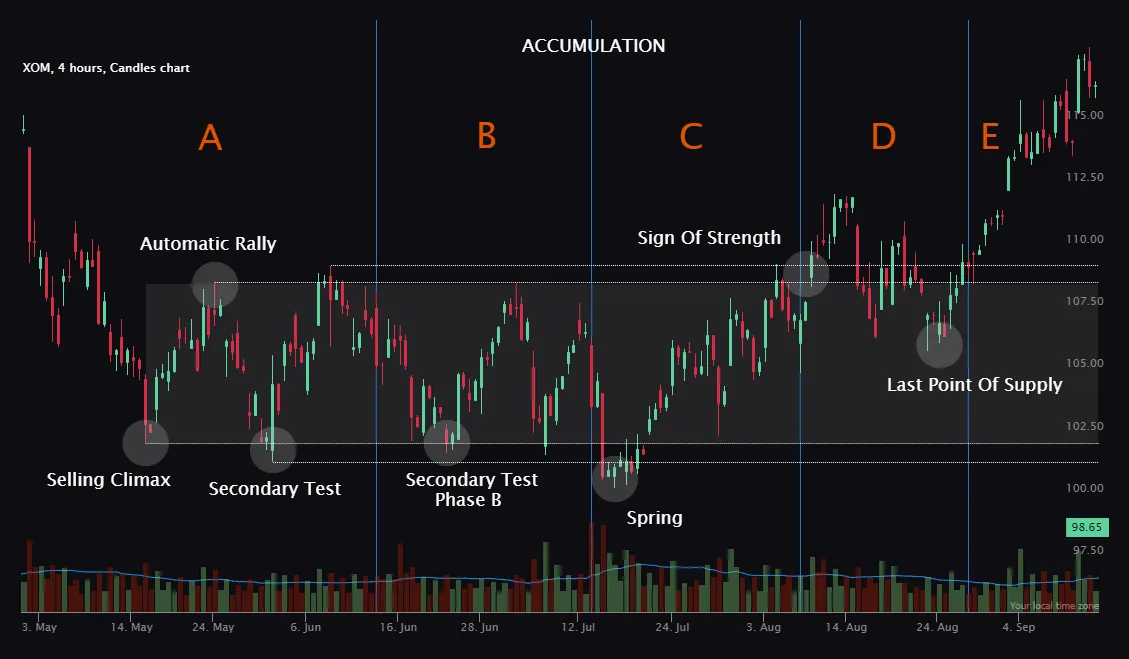
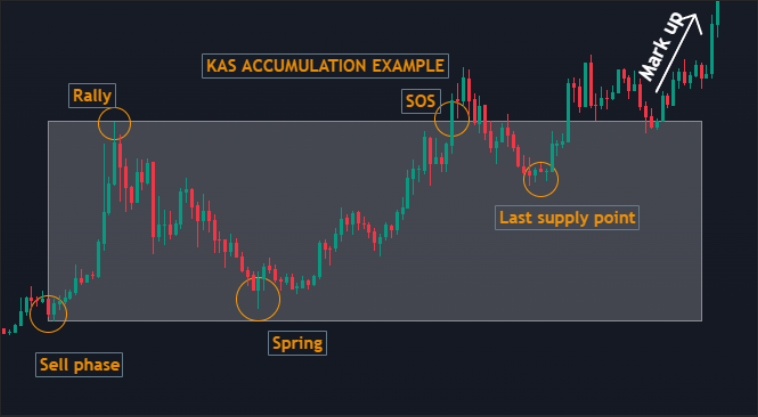
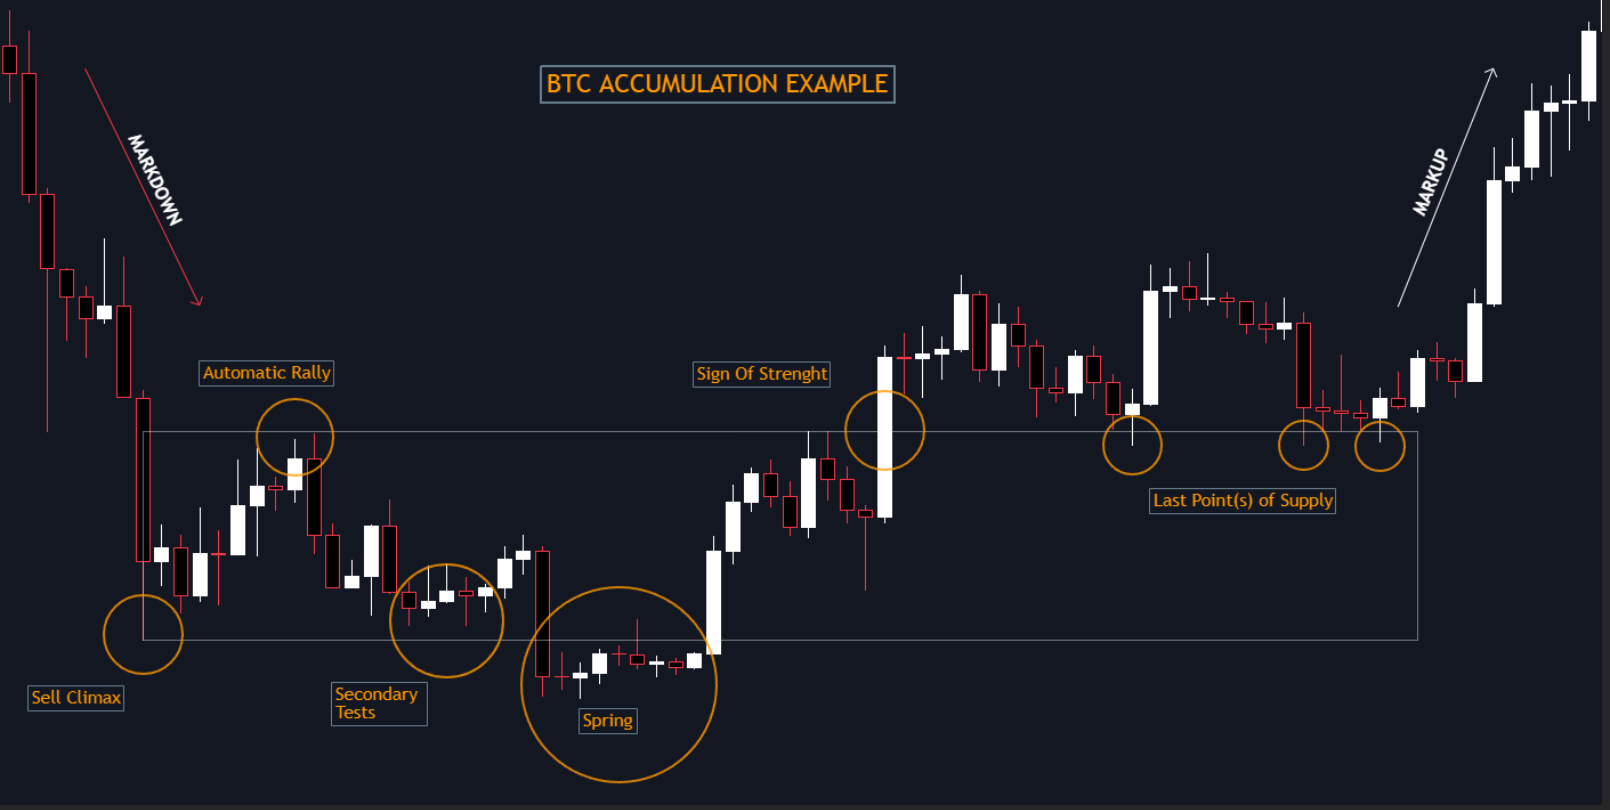
Accumulation: Events Inside the Range
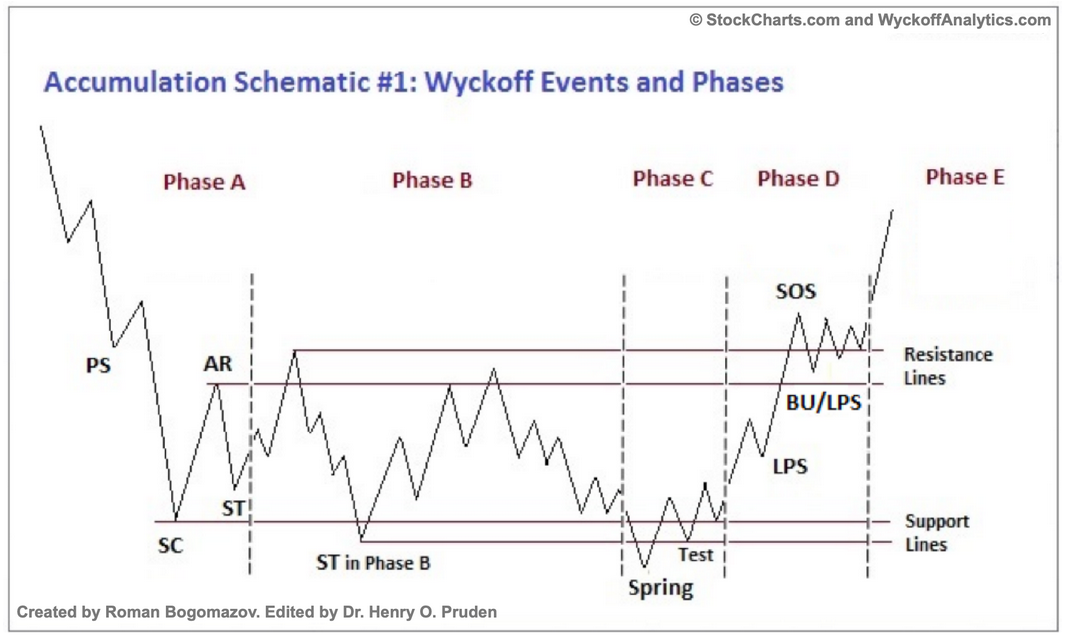
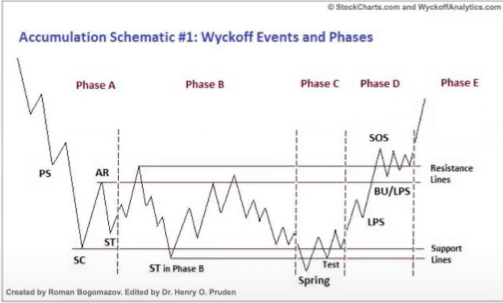
In an accumulation phase, institutions are buying. The range forms with higher lows and increasing demand. Below is the canonical events diagram.
Here are the terms you need to know.
- PS — preliminary support. Substantial buying begins to provide pronounced support after a prolonged down-move. Volume increases and price spread widens, signaling that the down-move may be approaching its end.
- SC — selling climax. The point at which widening spread and selling pressure usually climaxes, as heavy or panicky selling by the public is being absorbed by larger professional interests at or near a bottom. Often price will close well off the low in an SC, reflecting buying by these large interests.
- AR — automatic rally. Once intense selling pressure has greatly diminished, a wave of buying easily pushes prices up, further fueled by short covering. The high of this rally helps define the upper boundary of the accumulation TR.
- ST — secondary test. Price revisits the area of the SC to test the supply/demand balance. If a bottom is to be confirmed, volume and price spread should be significantly diminished as the market approaches support. It's common to have multiple STs after an SC.
- Test. Large operators always test the market for supply throughout a TR — STs, springs, and at key points during a price advance. If considerable supply emerges on a test, the market is often not ready to be marked up. A spring is often followed by one or more tests; a successful test typically makes a higher low on lesser volume.
- SOS — sign of strength. A price advance on increasing spread and relatively higher volume. Often an SOS takes place after a spring, validating the analyst's interpretation of that prior action.
- LPS — last point of support. The low of a reaction or pullback after an SOS. Backing up to an LPS means a pullback to support that was formerly resistance, on diminished spread and volume. There may be more than one LPS.
- BU — "back-up." Shorthand from Robert Evans, one of the leading teachers of the Wyckoff method. Evans analogized the SOS to a "jump across the creek" of price resistance; the "back up to the creek" represents both short-term profit-taking and a test for additional supply. A back-up commonly precedes a substantial price mark-up.
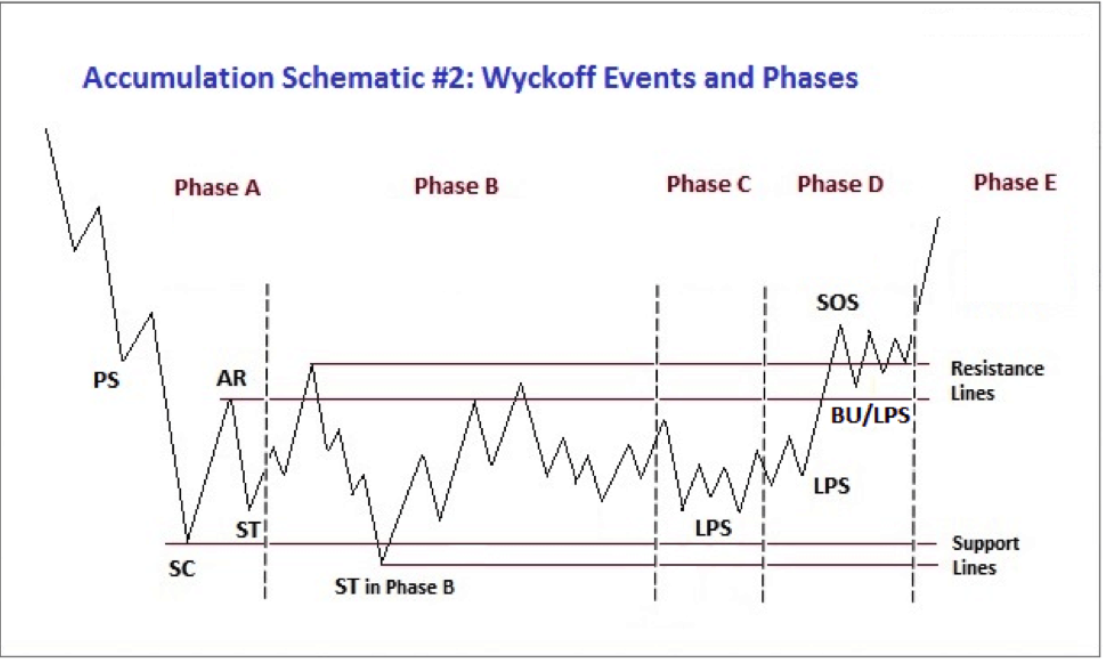
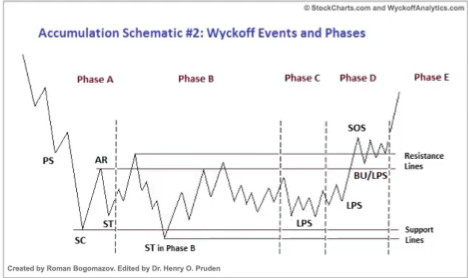
A note on springs and shakeouts: they usually occur late within a TR and allow dominant players to make a definitive test of available supply before a markup campaign unfolds. A Spring takes price below the low of the TR and then reverses to close within the TR — misleading the public about future direction and letting large interests acquire additional shares at bargain prices. A terminal shakeout is a spring on steroids. But neither springs nor shakeouts are required elements: Accumulation Schematic 1 depicts a spring, while Accumulation Schematic 2 shows a TR without a spring.
Accumulation: The Five Phases
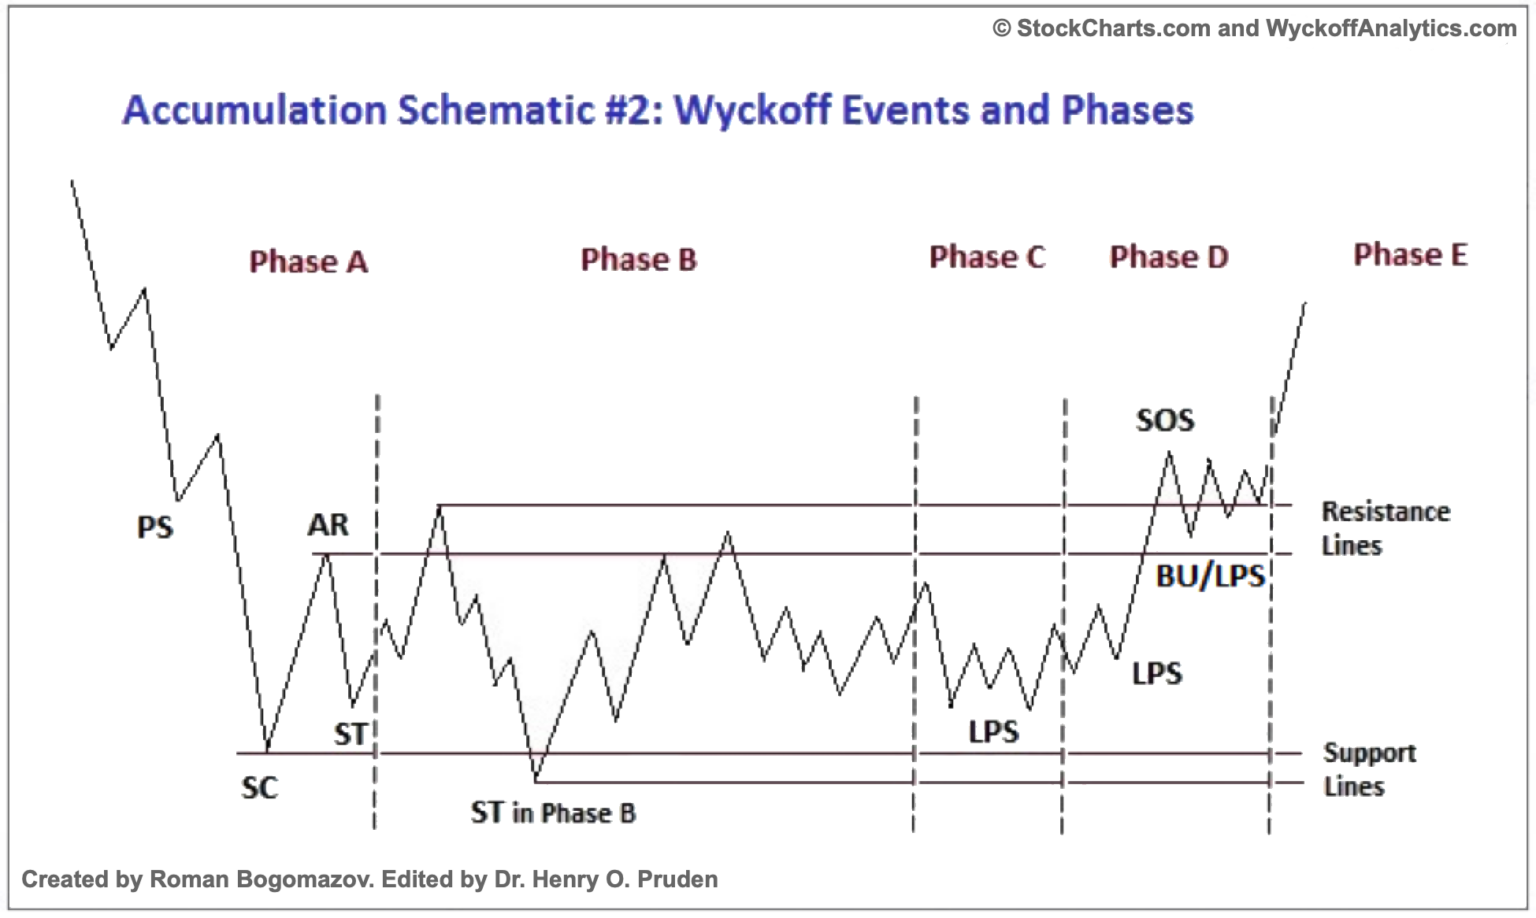
Phase A marks the stopping of the prior downtrend. Up to this point, supply has been dominant. The approaching diminution of supply is evidenced in PS and SC. These events are often very obvious on bar charts — widening spread and heavy volume depicting the transfer of huge numbers of shares from the public to large professional interests. Then comes the AR, consisting of both institutional demand and short-covering. A successful ST in the area of the SC will show less selling than previously, narrowing spread and decreased volume. The lows of the SC and ST and the high of the AR set the boundaries of the TR.
Sometimes the downtrend ends less dramatically, without climactic price and volume action. In general, though, it's preferable to see PS, SC, AR, and ST clearly. In a re-accumulation TR (which occurs during a longer-term uptrend), the points representing PS, SC, and ST aren't evident in Phase A — that phase resembles the start of a distribution. Phases B–E in re-accumulation TRs generally have shorter duration and smaller amplitude than primary accumulation bases.
Phase B serves the function of "building a cause" for a new uptrend. Institutions accumulate relatively low-priced inventory in anticipation of the next markup. The process can take a long time — sometimes a year or more — and involves purchasing at lower prices and checking advances with short sales. There are usually multiple STs during Phase B, as well as upthrust-type actions at the upper boundary of the TR. Early in Phase B, swings tend to be wide with high volume; as professionals absorb supply, volume on downswings tends to diminish. When supply appears exhausted, the stock is ready for Phase C.
Phase C is where price goes through a decisive test of remaining supply. The spring is a price move below the support level of the TR that quickly reverses and moves back into the TR — a bear trap, because the drop below support appears to signal resumption of the downtrend, but in reality marks the beginning of a new uptrend. A successful test of supply represented by a spring (or a shakeout) provides a high-probability trading opportunity. A low-volume spring (or low-volume test of a shakeout) indicates the stock is likely ready to move up — a good time to initiate at least a partial long. The appearance of an SOS shortly after a spring or shakeout validates the analysis. Testing of supply can also occur higher up in the TR without a spring; when this happens, identification of Phase C can be challenging.
Phase D is when demand consistently dominates supply. You see advances (SOSs) on widening spreads and increasing volume, plus reactions (LPSs) on smaller spreads and diminished volumes. During Phase D, price will move at least to the top of the TR. LPSs in this phase are generally excellent places to initiate or add to profitable long positions.
Phase E is the markup itself. The stock leaves the TR, demand is in full control, and the move is obvious to everyone. Setbacks — shakeouts and typical reactions — are usually short-lived. New, higher-level TRs comprising both profit-taking and re-accumulation can occur at any point in Phase E. These are sometimes called "stepping stones" on the way to even higher targets.
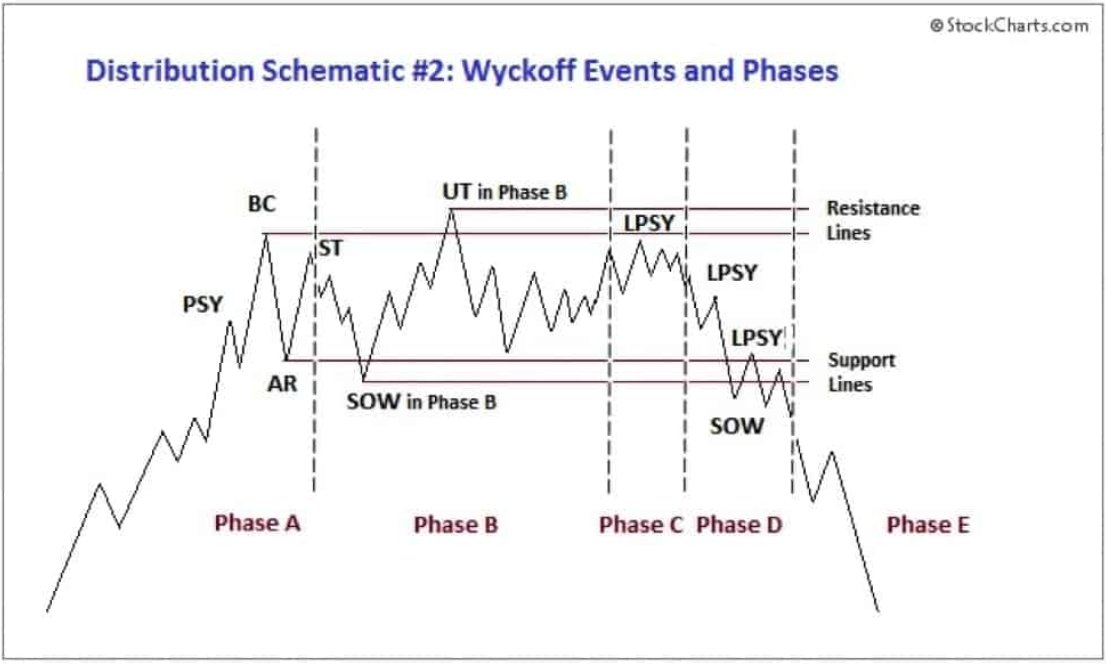
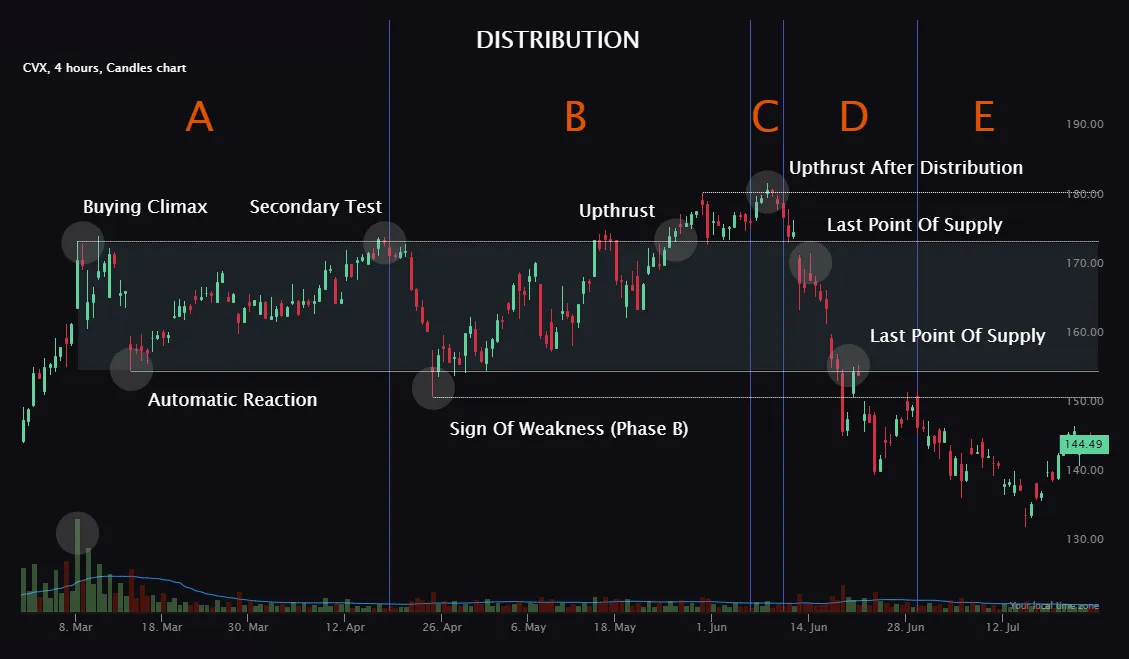
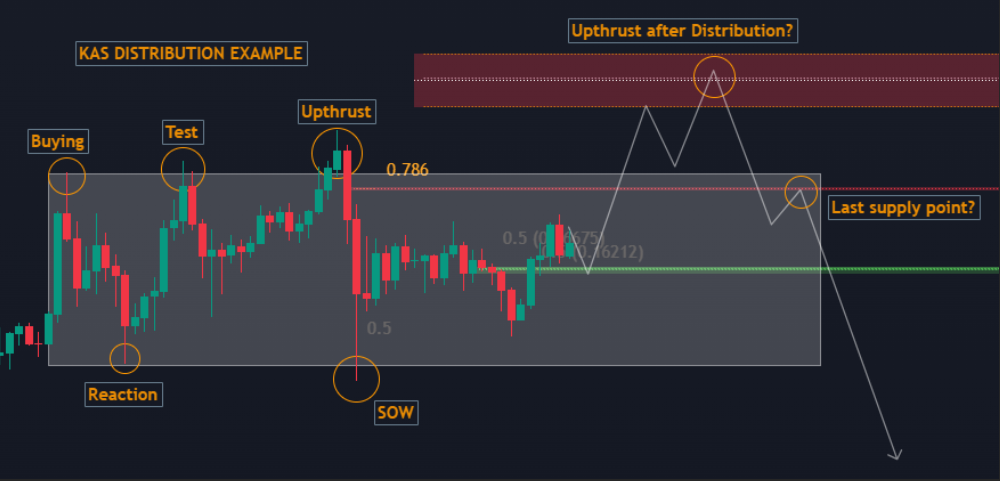
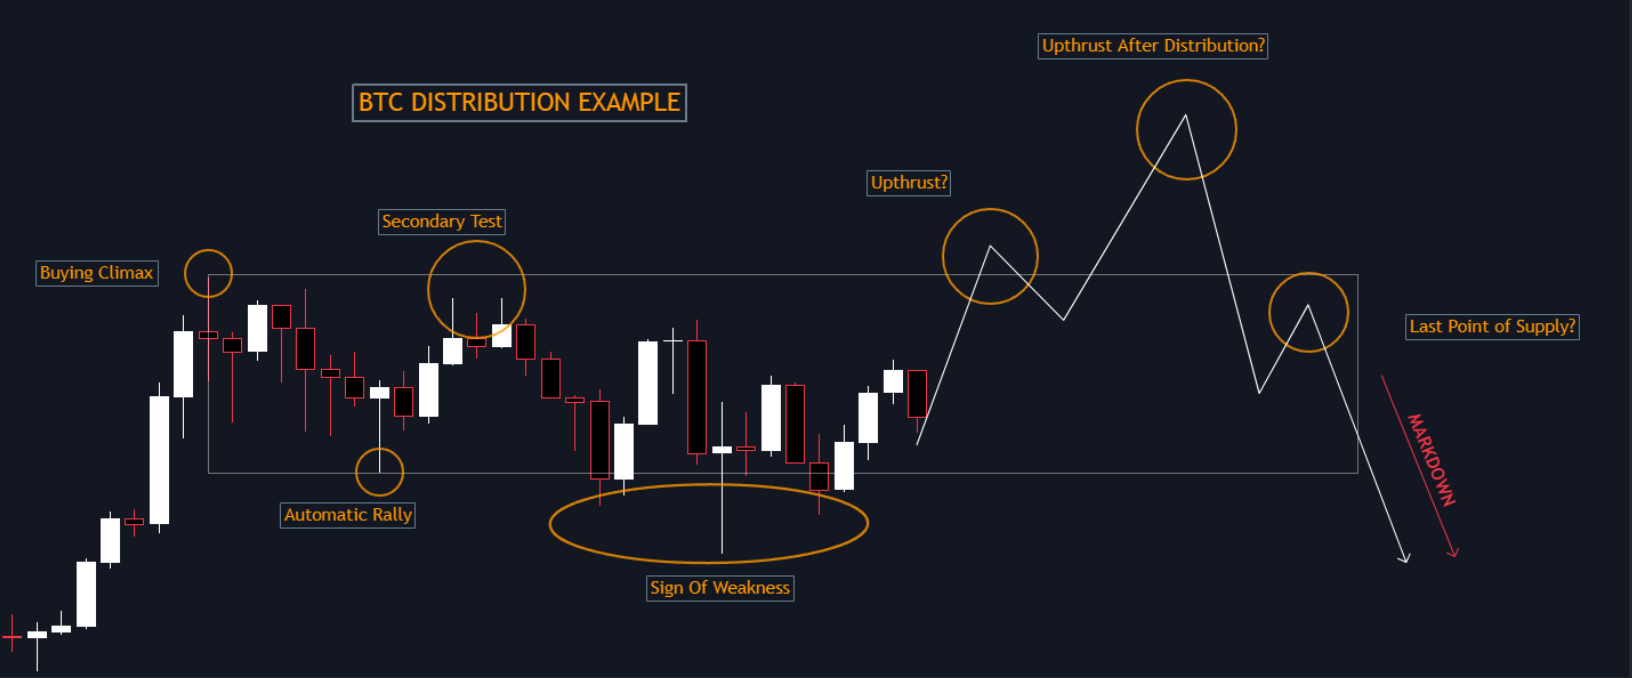
Distribution: Events Inside the Range
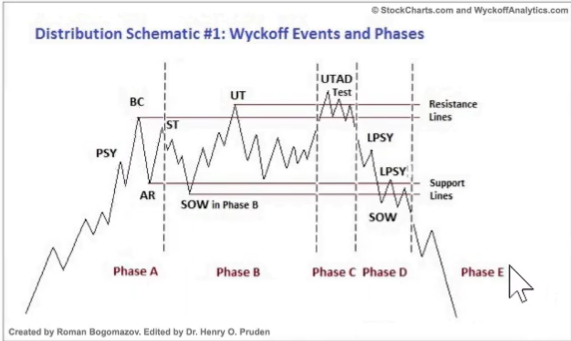
Distribution is the inverse. Sellers — specifically institutionals — need to sell huge positions accumulated earlier, creating a trading range with lower highs and decreasing demand. The consolidation after an uptrend often forms chart patterns like H&S, 3 Drives, or round tops. See 🔷H&S and 3 Drives for those formations.
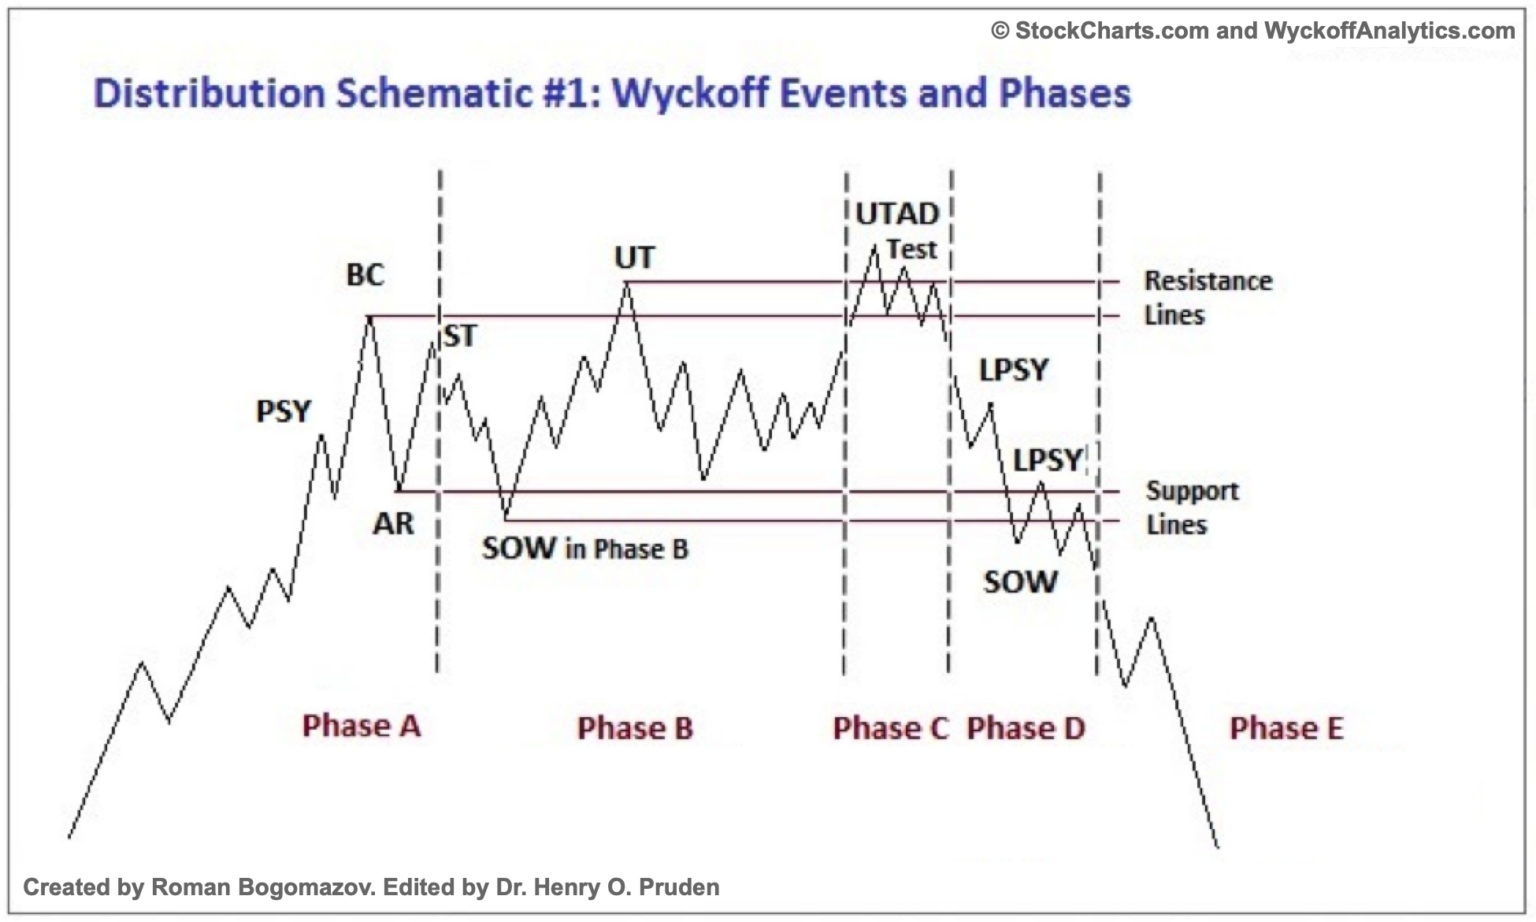
Terms:
- PSY — preliminary supply. Where large interests begin to unload shares in quantity after a pronounced up-move. Volume expands and price spread widens, signaling a change in trend may be approaching.
- BC — buying climax. Marked increases in volume and price spread, with heavy or urgent buying by the public being filled by professional interests at prices near a top. A BC often coincides with a great earnings report or other good news, since large operators require huge demand from the public to sell their shares without depressing the price.
- AR — automatic reaction. With intense buying substantially diminished after the BC and heavy supply continuing, an AR takes place. The low of this selloff helps define the lower boundary of the distribution TR.
- ST — secondary test. Price revisits the area of the BC to test the demand/supply balance. For a top to be confirmed, supply must outweigh demand; volume and spread should decrease as price approaches the resistance of the BC. An ST may take the form of an upthrust (UT), where price moves above the BC resistance before quickly reversing to close below it. After a UT, price often tests the lower boundary of the TR.
- SOW — sign of weakness. A down-move to (or slightly past) the lower boundary of the TR, usually on increased spread and volume. The AR and initial SOWs indicate a change of character: supply is now dominant.
- LPSY — last point of supply. After testing support on a SOW, a feeble rally on narrow spread shows the market is having considerable difficulty advancing. This may be due to weak demand, substantial supply, or both. LPSYs represent exhaustion of demand and the last waves of distribution before markdown begins in earnest.
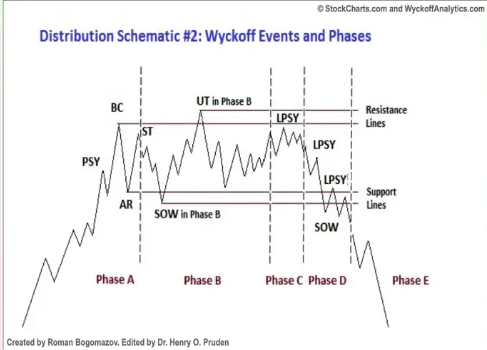
- UTAD — upthrust after distribution. The distributional counterpart to the spring and terminal shakeout. It occurs in the latter stages of the TR and provides a definitive test of new demand after a breakout above TR resistance. Like springs and shakeouts, a UTAD is not required: Distribution Schematic #1 contains a UTAD, Schematic #2 does not.
Distribution: The Five Phases
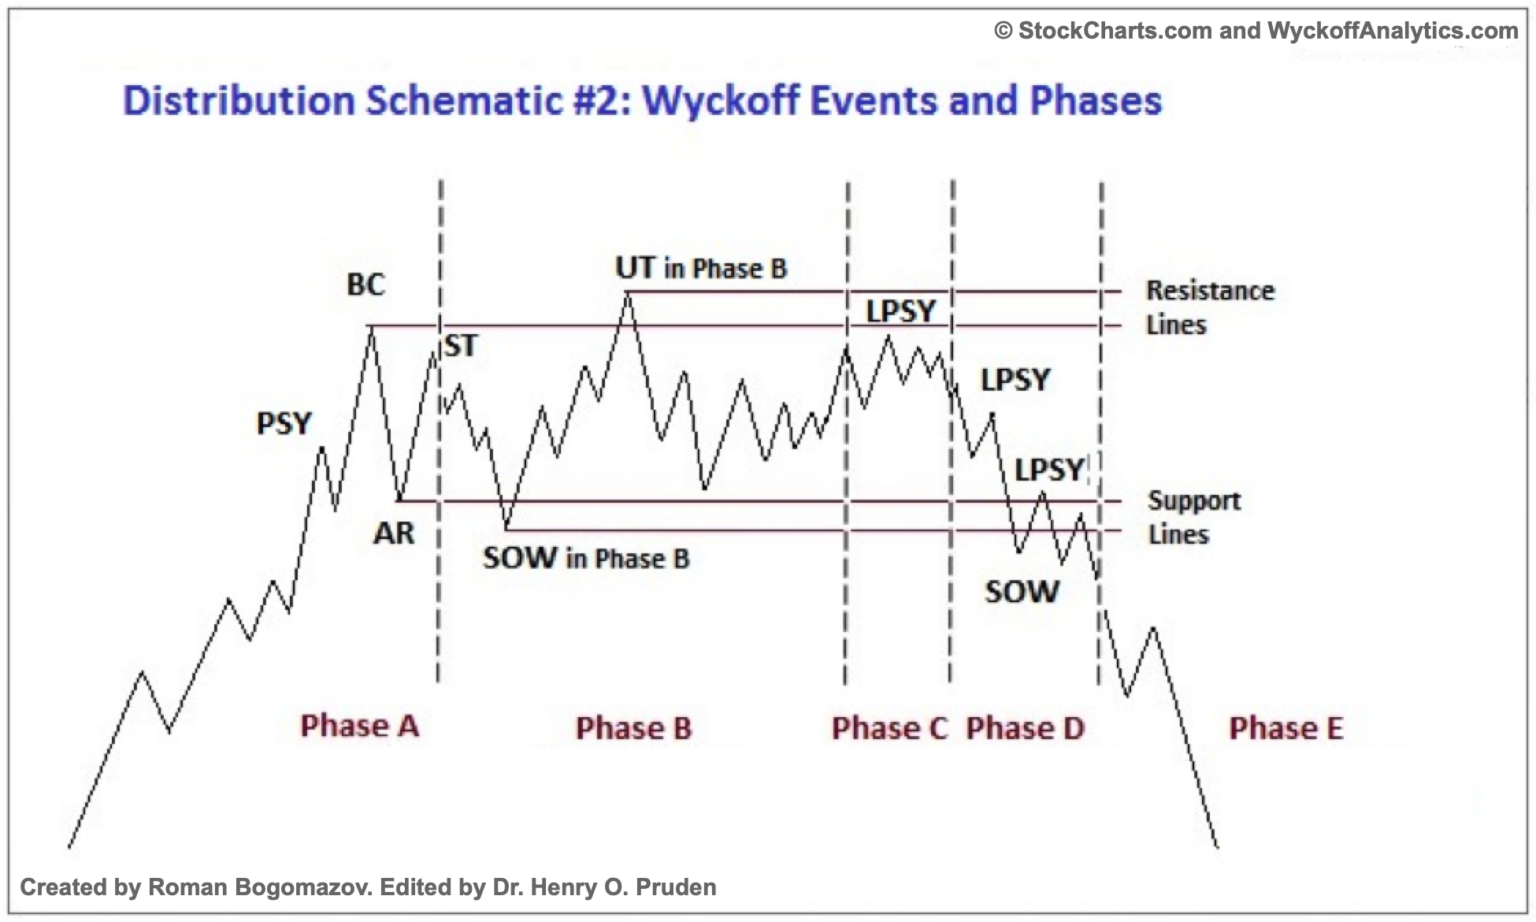
Phase A marks the stopping of the prior uptrend. Demand has been dominant up to this point; the first significant evidence of supply is provided by PSY and BC, usually followed by an AR and a secondary test of the BC, often on diminished volume. The uptrend may also terminate without climactic action, demonstrating exhaustion of demand with decreasing spread and volume — less upward progress on each rally before significant supply emerges. In a redistribution TR within a larger downtrend, Phase A can look like the start of an accumulation (with climactic action to the downside), but Phases B–E still analyze the same way.
Phase B builds a cause in preparation for a new downtrend. Large interests dispose of long inventory and initiate short positions. The points are similar to Phase B in accumulation, except large interests are net sellers, with the goal of exhausting as much remaining demand as possible. SOWs here are usually accompanied by significantly increased spread and volume to the downside.
Phase C may reveal itself via an upthrust (UT) or UTAD — the opposite of a spring. Price moves above TR resistance and quickly reverses back inside. It's a bull trap, intended to wrong-foot uninformed break-out traders. A UTAD lets large interests sell additional shares at elevated prices to break-out traders before markdown begins, and may induce smaller short traders to cover. Aggressive traders may initiate shorts after a UT or UTAD — the risk/reward is often favorable. But "smart money" repeatedly stops out traders who short these, so it's often safer to wait for Phase D and an LPSY.
Often demand is so weak in a distribution TR that price doesn't reach the level of the BC or initial ST. In that case, Phase C's test of demand may be represented by a UT of a lower high within the TR.
Phase D arrives after the tests in Phase C show the last gasps of demand. Price travels to or through TR support. Evidence that supply dominates increases — either a clear break of support, or a decline below the midpoint of the TR after a UT or UTAD. Multiple weak rallies inside Phase D are LPSYs, excellent opportunities to initiate or add to short positions. Anyone still long during Phase D is asking for trouble.
Phase E is the markdown. The stock leaves the TR and supply is in control. Once TR support is broken on a major SOW, the breakdown is often tested with a rally that fails at or near support — a high-probability short. Subsequent rallies during the markdown are usually feeble.
A Quick Look at the Cycle Together
Personal examples — pure interpretations based on what the method teaches:
Accumulation
Distribution
These are theoretical sketches that make sense based on what I've understood about Wyckoff and his method. Maybe my interpretation is far from reality — but the patterns do show up if you look. Study this thoroughly
The Five-Step Approach to Trade Selection
Wyckoff's method involves a five-step approach.
Step 1: Determine the present position and probable future trend of the market. Is the market consolidating or trending? Use both bar charts and P&F charts of the major indices.
Step 2: Select stocks in harmony with the trend. In an uptrend, look for stocks stronger than the market; in a downtrend, weaker. Use bar charts of individual stocks to compare with the most relevant market index.
Step 3: Select stocks with a "cause" that equals or exceeds your minimum objective. Cause and effect — horizontal P&F count within a trading range is the cause; the subsequent price movement is the effect. For longs, choose stocks under accumulation or re-accumulation that have built a sufficient cause.
Step 4: Determine the stocks' readiness to move. Apply the nine buying or selling tests below.
Step 5: Time your commitment with a turn in the stock market index. Three-quarters or more of issues move in harmony with the general market, so you improve odds by having the overall market behind you. Watch for changes of character — like the largest down-bar on highest volume after a long uptrend. Put your stop in place and trail as appropriate.
Comparative Strength
Wyckoff's stock selection always included an analysis of comparative strength. For longs, look for stocks or industries outperforming the market, both during trends and inside trading ranges. For shorts, look for underperformers.
He would compare successive waves or swings in each chart, examining the strength or weakness of each in relation to prior waves on the same chart and to corresponding points on a comparison chart. A variation: identify significant highs and lows on both charts, then evaluate strength by relative position.
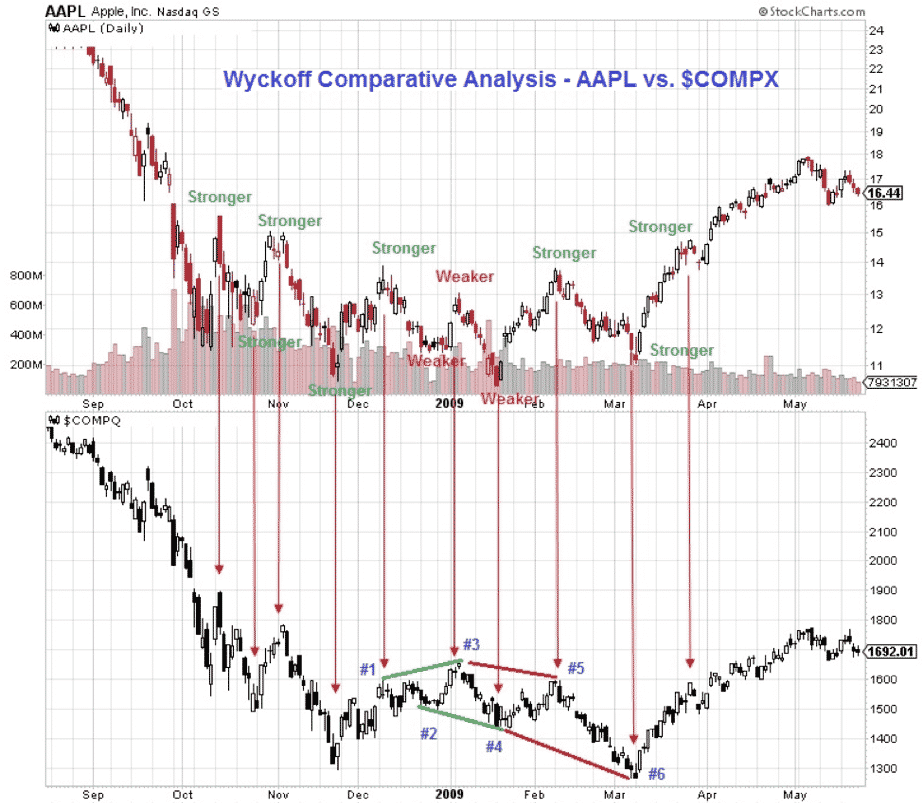
In these charts of AAPL and the NASDAQ composite ($COMPX), AAPL is making a lower high at point #3 relative to point #1, whereas $COMPX is making a higher high there — AAPL is underperforming. The picture changes in February: AAPL starts outperforming with a higher high at #5 and higher low at #6 relative to the market, which makes a lower high at #5 and a lower low at #6.
Modern practitioners can use a Relative Strength Ratio between a stock and a market proxy to compare strength and weakness — and that more easily eliminates inaccuracies due to different price scales. (RSI as commonly used is an inaccurate lagging indicator, so this could be skipped.)
The Nine Buying and Selling Tests
The three laws give you the foundation. The nine tests are the narrower principles that guide trade entry — they help delineate when a TR is drawing to a close and a new uptrend or downtrend is about to begin. They define the line of least resistance.
Wyckoff Buying Tests for Accumulation:
- Downside price objective accomplished — P&F chart
- Preliminary support, selling climax, secondary test — Bar and P&F charts
- Activity bullish (volume increases on rallies, diminishes during reactions) — Bar chart
- Downward stride broken (supply line or downtrend line penetrated) — Bar or P&F chart
- Higher lows — Bar or P&F chart
- Higher highs — Bar or P&F chart
- Stock stronger than the market — Bar chart
- Base forming (horizontal price line) — Bar or P&F chart
- Estimated upside profit potential is at least three times the loss if the initial stop-loss were hit — P&F and bar charts
Wyckoff Selling Tests for Distribution:
- Upside objective accomplished — P&F chart
- Activity bearish (volume decreases on rallies, increases on reactions) — Bar and P&F charts
- Preliminary supply, buying climax — Bar and P&F charts
- Stock weaker than the market — Bar chart
- Upward stride broken (support line or uptrend line penetrated) — Bar or P&F chart
- Lower highs — Bar or P&F chart
- Lower lows — Bar or P&F chart
- Crown forming (lateral movement) — P&F chart
- Estimated downside profit potential is at least three times the risk — P&F and bar charts
The chart below illustrates Buying Tests 2 through 8.
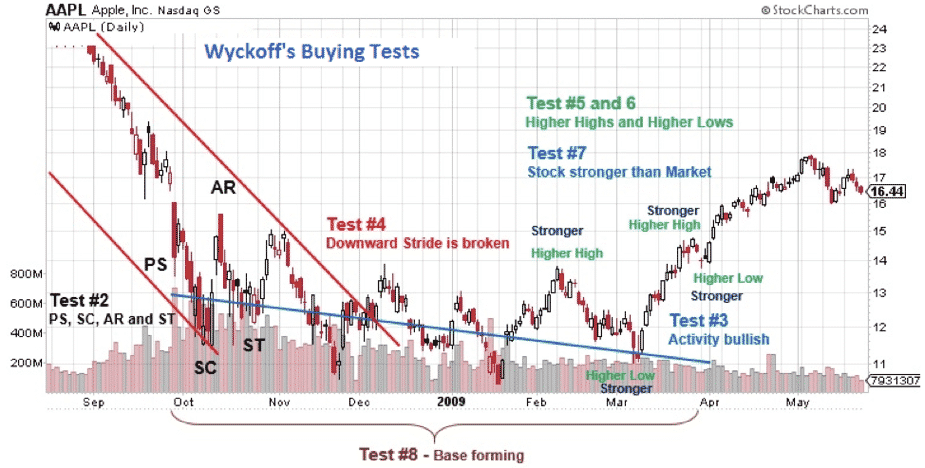
The downtrend in this AAPL example concludes with PS, SC, AR, and ST — satisfying Test #2. Volume contracts throughout the TR and prices start making higher highs and higher lows, showing absorption of supply. Once supply has been exhausted, price can rise on lower demand than you'd expect — bullish, satisfying Test #3. The downward stride and downtrend channel are broken — Test #4 satisfied. AAPL makes higher highs and higher lows stronger than the market — Tests #5, 6, 7. Six months consolidating built sufficient cause — Test #8. Tests #1 and #9 only meet through P&F charts.
Point-and-Figure: A Reference Note
P&F charts are how Wyckoff measured cause to project effect. The method is not really relevant to my trading style — it can largely be ignored for the Master's Style and used only for reference — but here's the gist.
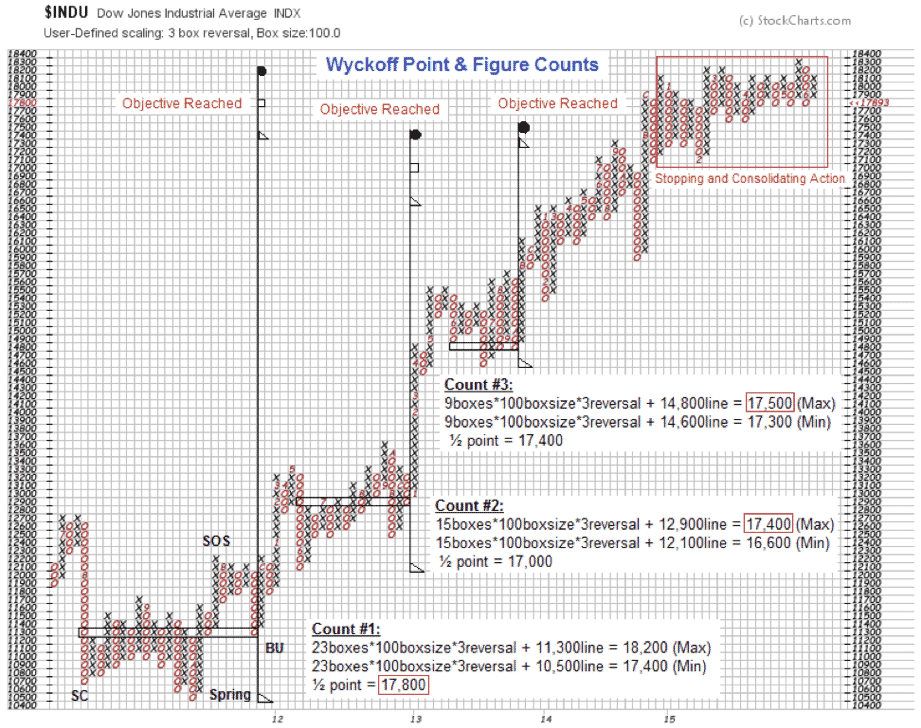
The Wyckoff Count Guide calculates the cause built during an accumulation TR to project future price targets:
- Use a bar chart and P&F chart over the same range and timeframe.
- Choose an appropriate box size (0.5–1 point for low-priced stocks, 5 points for >$200 stocks, 100 points for the DJIA).
- After identifying an SOS toward the right side of the TR, locate the last point of support — the LPS.
- Locate this on the P&F chart and count right to left at the LPS price level, taking the most conservative count first and moving further left as the move progresses.
- Divide the area of accumulation into phases on your bar chart, adding one complete phase at a time. Note these P&F phases are NOT the same as Phases A–E. The first phase might run from LPS back to the spring; the second from the spring to a clearly defined ST. In longer counts, the LPS often appears at the original level of preliminary support or the SC — when that happens, it tends to validate the count. A spring may also serve as the LPS; usually a spring is followed by an SOS, and the low of the reaction following the SOS is also a valid LPS.
- Watch for stepping-stone confirming counts as new TRs form at higher (or, in downtrends, lower) levels. Use a smaller box size for stepping stones since swings are typically narrower.
- For longer-term targets, add the count to the exact low of the TR and to the halfway point.
- Treat target points as places to "stop, look, and listen" — not exact reversal points.
- In three-point or five-point charts, use the same count line as for one-point charts.
Pay Attention to Repeated Peaks
When there are repeated price peaks or all-time highs, it often means the big players are selling — especially if there's a lot of overly bullish news, ETF moon-talk, and so on. See also 🔷H&S and 3 Drives.
If you notice two flash drops at the same level, that's whales' intention of selling at that level. Probabilistically, price is likely to crash from there on any next hit to the level, as it happens most of the time. See Whale Manipulation🐋.
This is one of the ways I come up with accurate forecasts, but there's a lot more to watch for.
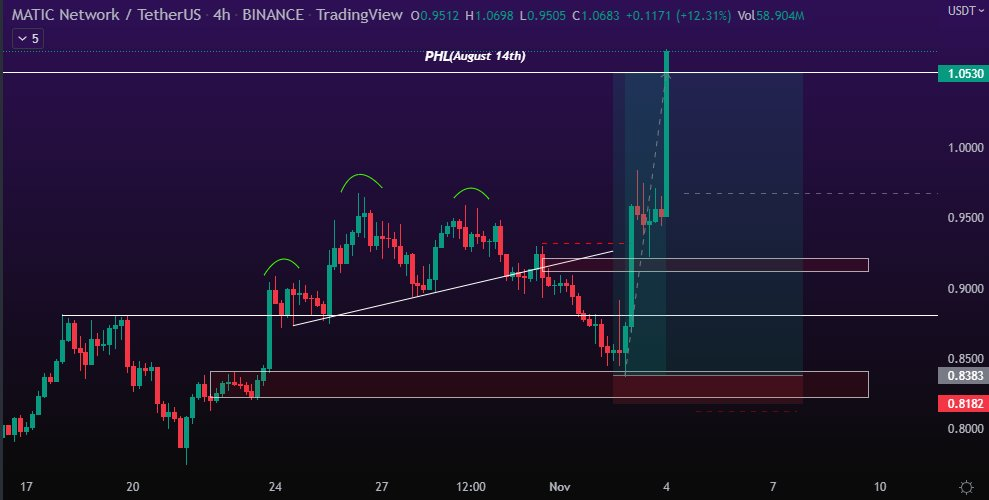
Whenever you see this formation — distribution / H&S — plus a Demand base below, you'll be right more often than not if you're bullish on the coin. This is a classic Market Maker distribution pattern, hit to a very significant liquidity level, and then the move. You can test and learn to spot these patterns by backtesting. These are clear MMs footprints — in plays like this they have no chance to hide their intentions. R:R on these plays is extremely good, for spot traders as well.
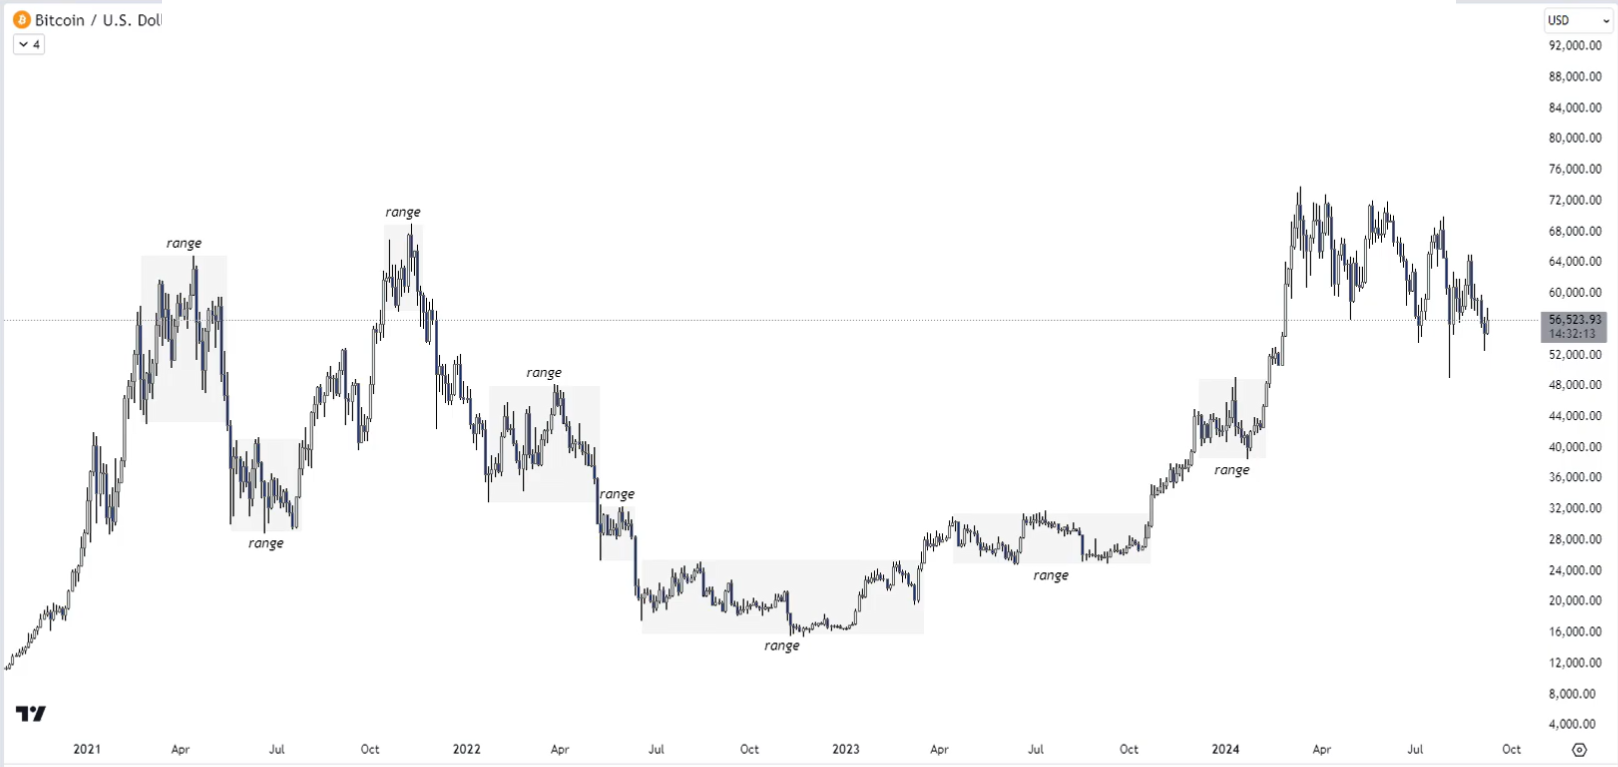
BTC example. Repeated hits above $70,000 into steep reversals are whale selling — Wyckoff Distribution in chunks because they can't fill all their orders at once. Normally, they'll then push the market down to levels where they want to buy Bitcoin at.
[Jun 7, 2024]. Several aggressive flash drops on the market each time Bitcoin reaches for the low 70s during the past 12 weeks, while whales keep dropping bullish news after bullish news, almost as if they're inflating some bubble. Interesting.
Sorry but can we see new ATH in a distribution phase? I am not clear about that.
Yes. Distribution is whales selling, and they release bullish news every couple of days, so holders don't sell anything — plus they bring in global celebrities so there are millions of new investors buying their bags. Distribution isn't a guarantee of the end of a bull run.
[Feb 18, 2025] — DOGE.
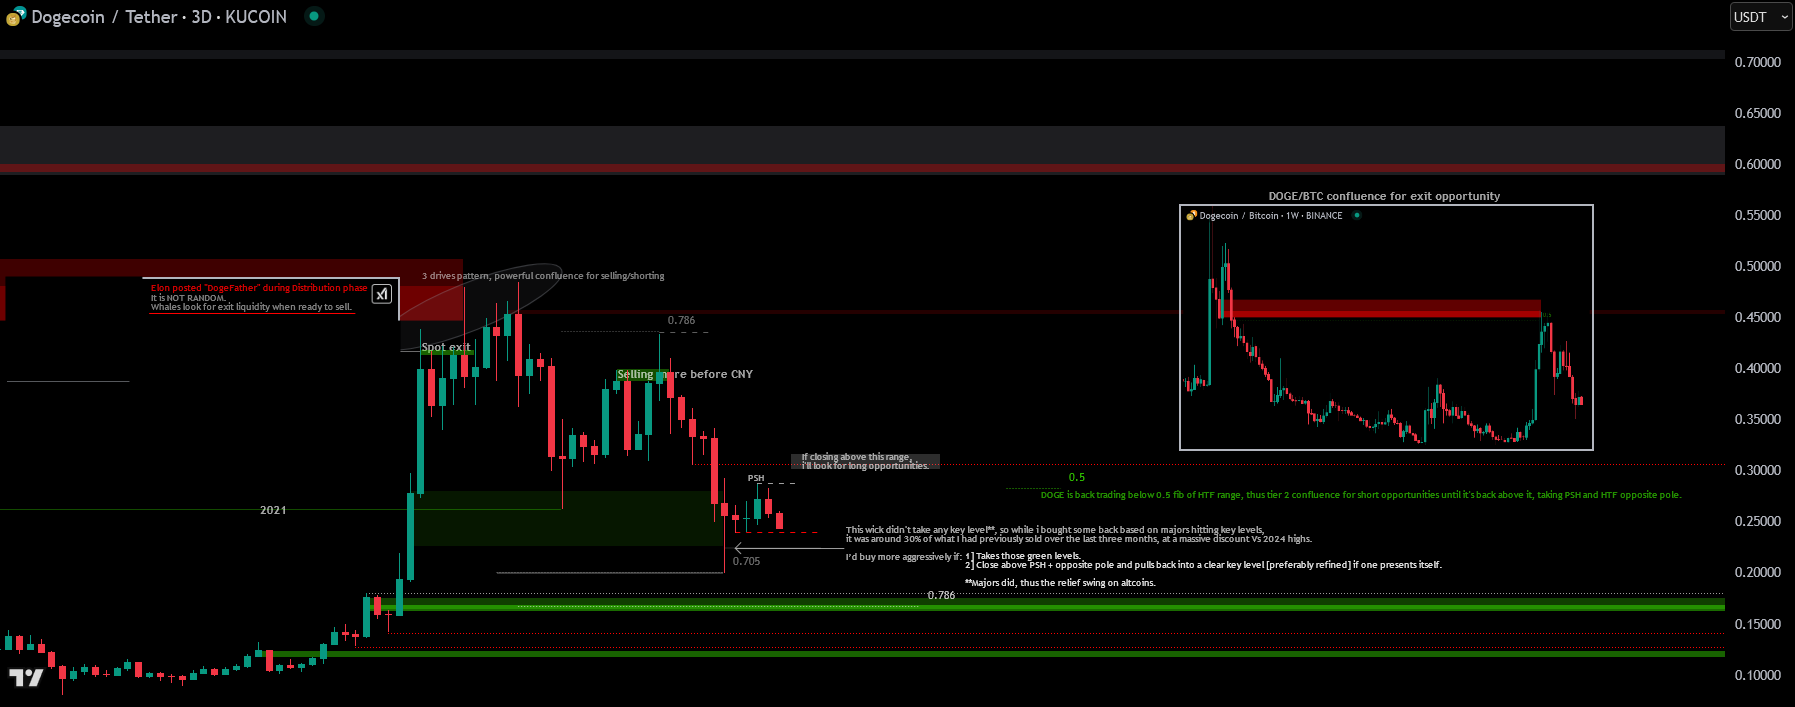
Elon posted "DogeFather" during the Distribution phase. It is NOT random. Whales took for exit liquidity when ready to sell.
[Mar 4, 2025]. Some have asked about a potential HTF 3 Drives pattern on Bitcoin — an exit pump during distribution before a major crash. The longer it takes for the third drive to hit, the lower its probability. I measure a third drive by allowing no more than double the timeframe between the first and second highs, which means it should form within 68 days past the ATH, landing in late March. If price gets there by then, I'd still consider it a valid 3 Drives pattern and look for optimal short opportunities, confirming with majors as always. We've already seen one HTF 3 drives pattern on Bitcoin back in late November to mid December.
[Mar 28, 2025]. Bitcoin — all roads eventually lead to the same HTF key levels.
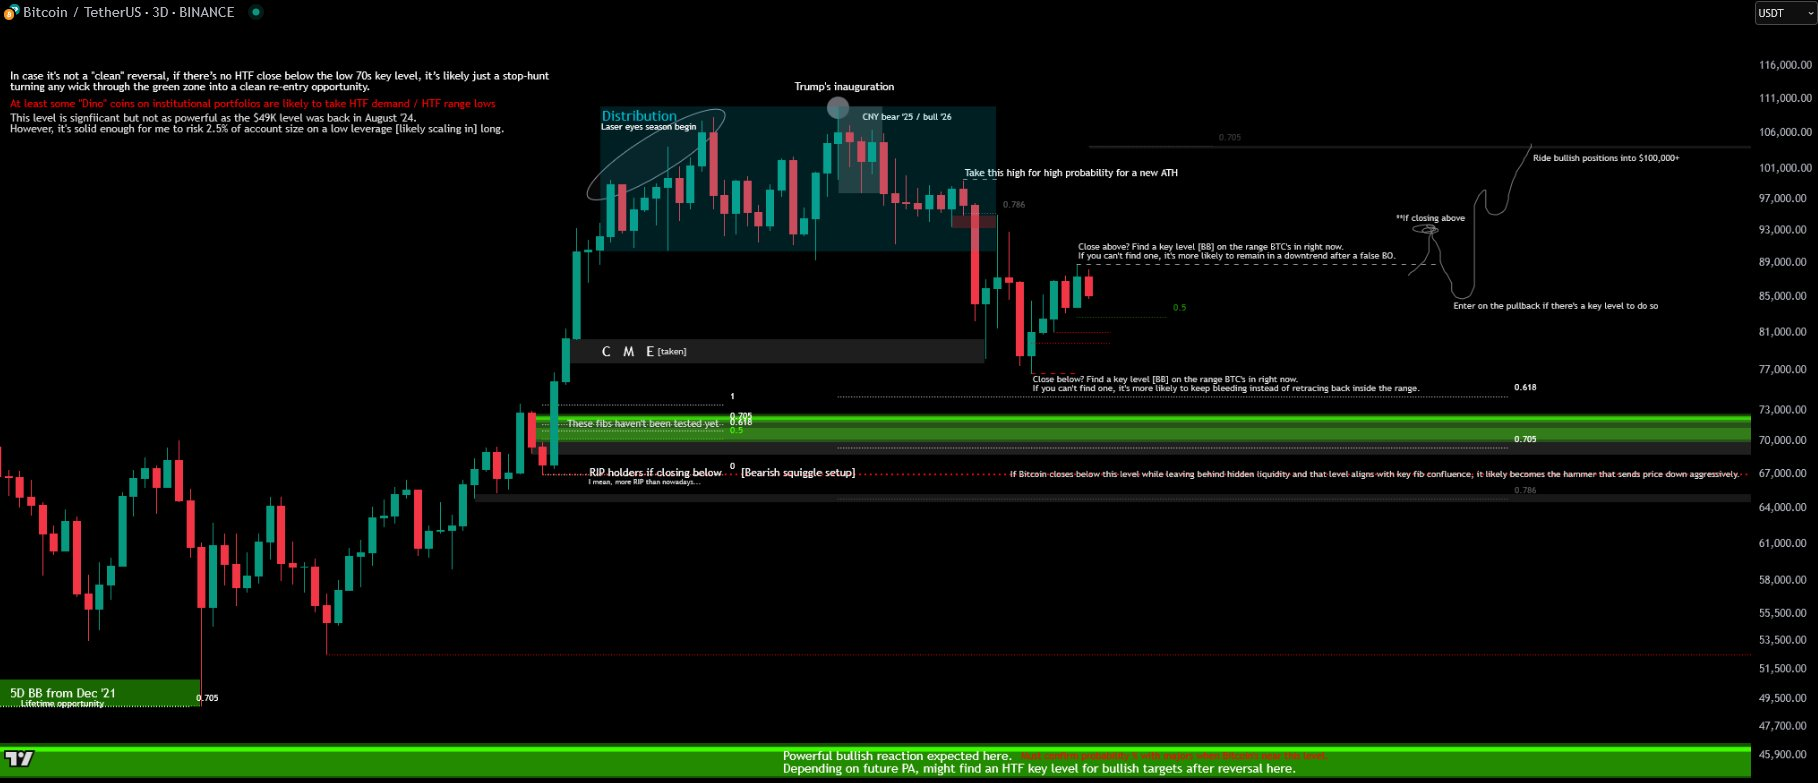
In case it's not a clean reversal, if there's no HTF close below the low 70s key level, it's likely just a stop-hunt, turning any wick through the green zone into a clean re-entry opportunity. This level is significant but not as powerful as the $49K level was back in August 74. Still solid enough to risk 2.5% of account size on a low leverage long, likely scaling in.
- Close above? Find a key level on the range BTC is in right now. If you can't find one, more likely to remain in a downtrend after a false BO. Sometimes it's a breakout with no retest if in buy program.
- Close below? Find a key level on the range BTC is in right now. If you can't find one, more likely to keep bleeding instead of retracing back inside the range. Both scenarios are ultimately bearish because of HTF sell program.
[Apr 4, 2025]. "We're gonna win so much, you may even get tired of winning." And you'll say: "Please, it's too much winning — we can't take it anymore Mr. President!" Welcome to financial games, where only the sheep fall for the most obvious traps ever created, and somehow still act surprised when they get slaughtered.
A Note on Accumulation Discipline
A few thoughts on how to actually use accumulation as a retail trader.
The best accumulation period was in 2022/23. That was extreme discount on all charts — see 🔷Premium & Discount. I shared HTF demand levels many times during that period on countless coins, and mentioned to wait for highest trading volume coins to bottom on HTF before reversal. That's when the market reversed.
Nowadays and moving forward — up until the next meltdown — it's all about being wise when choosing exit levels rather than DCA'ing into every single pullback. Most don't even do that. They buy more only after the next weekly green candle prints, and they don't know how to identify the most likely measurement a swing will have. This behavior breaks your OUAT very good average cost (assuming you bought the lows). It's a trap.
Unless you can identify HTF local and macro tops and bottoms, you DCA-in into the bottom of a bear market, and you DCA-out into the top of a bull market. That's it. Then you assess your performance and prepare for future cycles. You need to get out of the market too — rather than never leaving and just paying all your money to the better players.
Many will need future cycles to make it to financial freedom, because a 10X to 50X isn't enough to make them happy. They want to achieve it in this run, so they'll get rekt — mostly because they will not sell. They always want more. Future cycles will be different because this whole shit-show in cryptoland will be put to a halt by the "elites" in the next 3 to 5 years. Anyone can promise it'll last, but you can't run Ponzis for eternity.
A note on copying: don't try to copy everything the most accurate players in this game do. You don't have the skillset to "fix" any early selling or late buying. They do. If you sell and the market explodes, you won't know how to catch up. If you buy and the market crashes, same thing. The best you can do is accumulate hours improving your mindset and knowledge. You're meant to lose here — that's supposed to be your role. Turn the odds in your favor by becoming wiser than the herd.
Modern Schematics: Simplifying Wyckoff for Live Trading
The classical Wyckoff diagrams, with all their phases and label points, are considered overly complex and rarely align fully in live markets — which makes them hard to trade profitably as drawn. So practitioners have simplified the schematics into models that emphasize ranges, deviations, liquidity, and market structure.
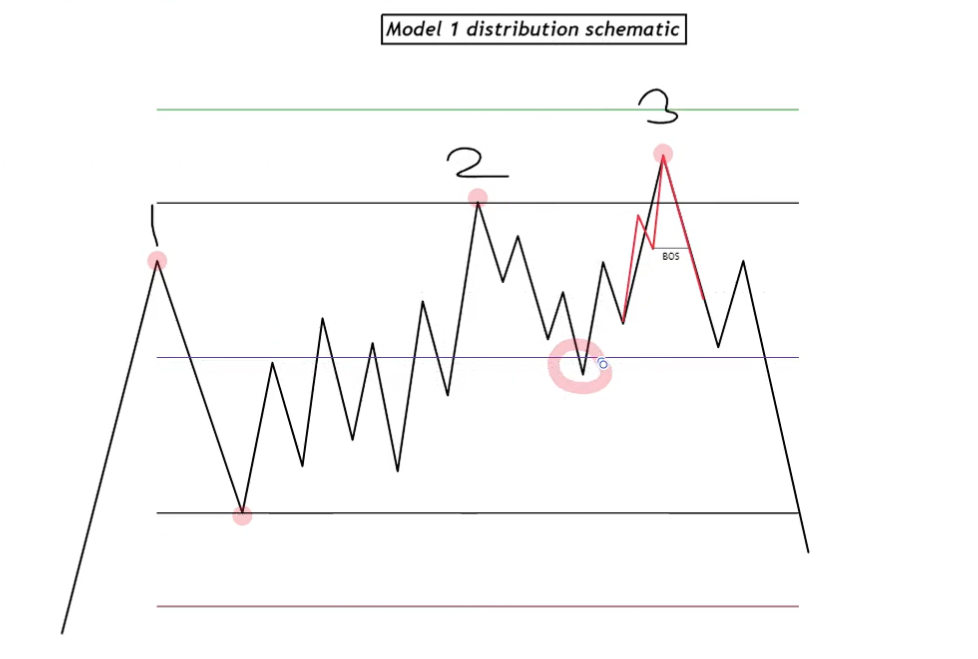
The naming convention uses Taps (Tap 1, Tap 2, Tap 3) to describe structure rather than phase letters. Every schematic has three taps.
The Foundational Concept: Purpose of a Range
Every range has a directional purpose — it will eventually break either up or down. Such breakouts or breakdowns are significant price movements, implying market maker involvement during the range formation. This observation is the foundation for Wyckoff-style schematics.
Wyckoff Terminology by Direction
When trending down and price breaks up — that's a reversal, an accumulation.
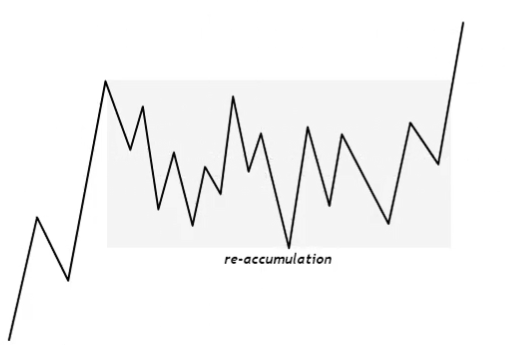
When trending up and price breaks up — continuation, a reaccumulation.
When trending up and price breaks down — reversal, a distribution.
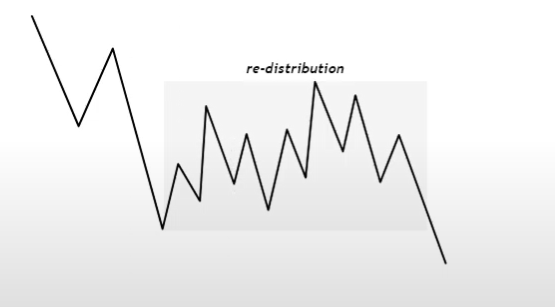
When trending down and price breaks down — continuation, a redistribution.
Accumulation and reaccumulation are traded identically. Distribution and redistribution are also traded identically. The only difference is the preceding trend; the range itself is traded the same way.
The Original Wyckoff Models
Accumulation Models:
Phases A–E. Label points: PS, SC, AR, ST, ST in B, Spring, Test, LPS, SOS.
- Model 1: Two deviations below range low (each lower than the last).
- Model 2: One deviation followed by a higher low.
Distribution Models:
Same phase structure.
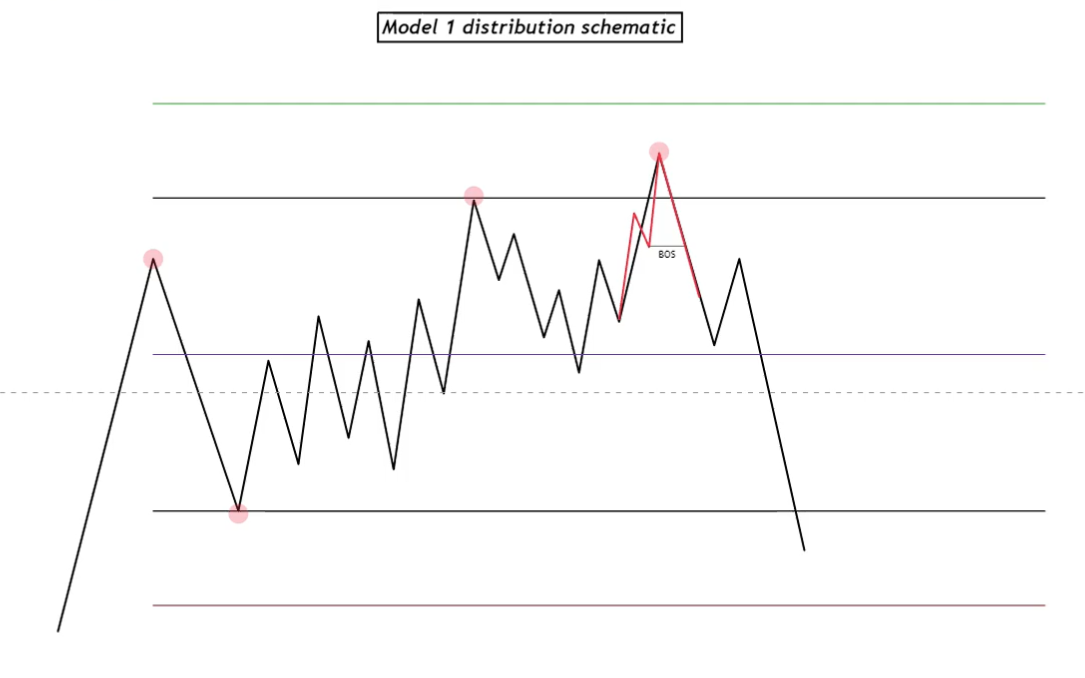
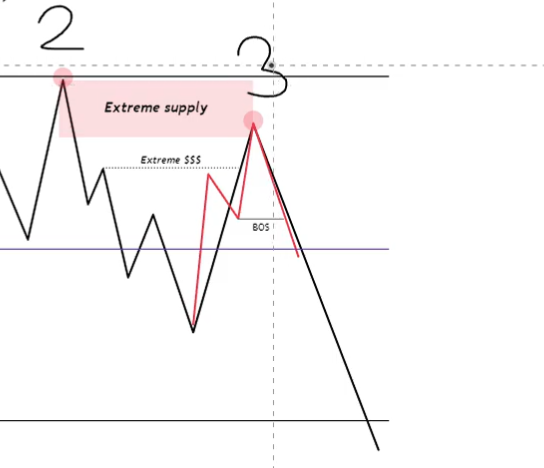
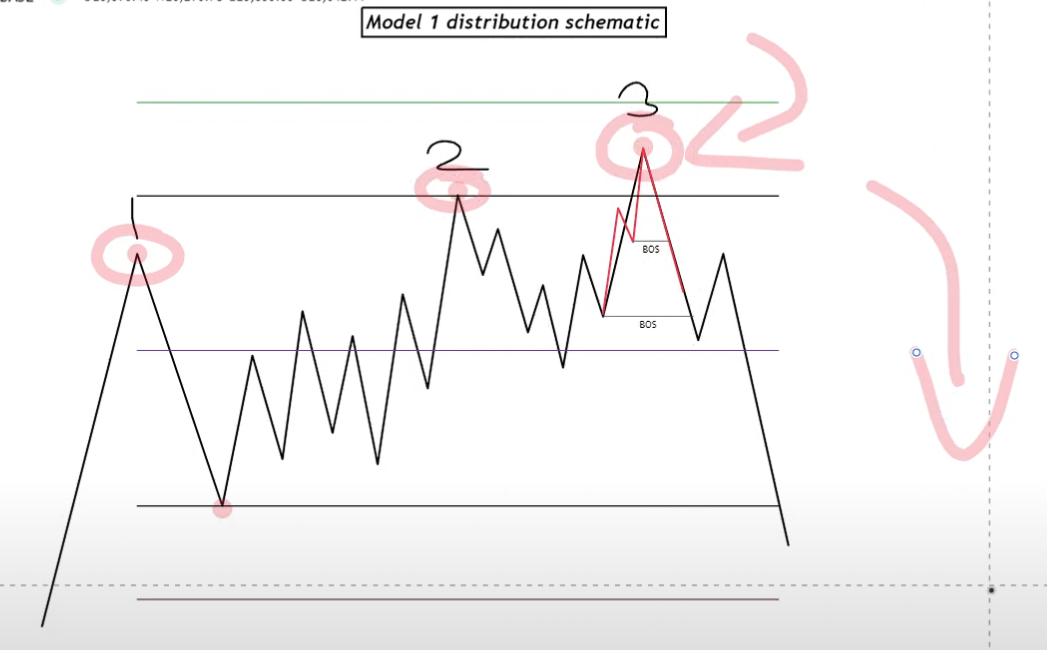
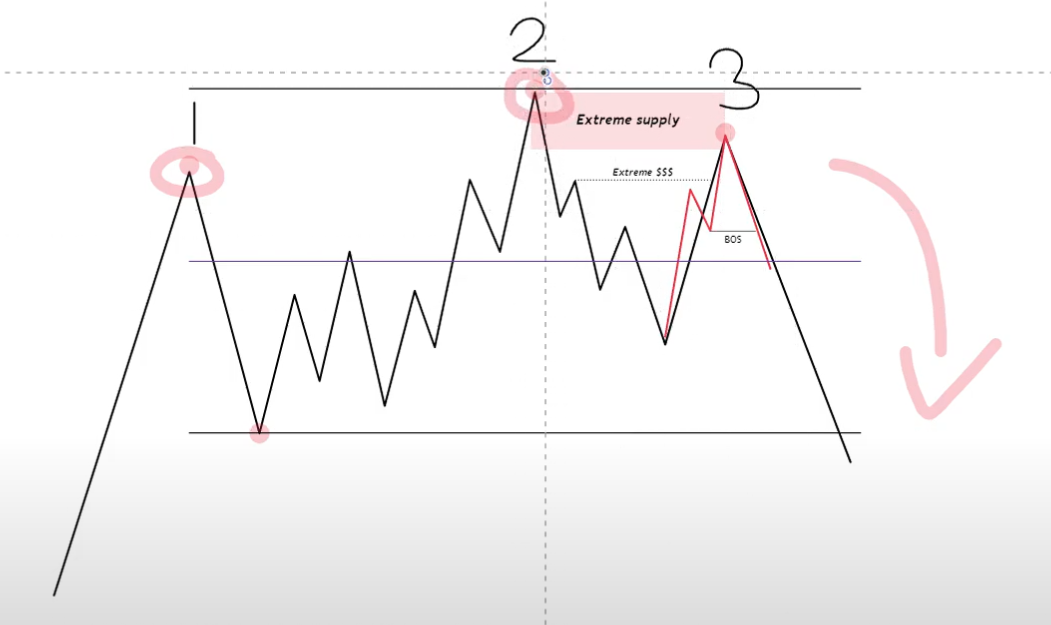
- Model 1: Two deviations above range high (each higher than the last).
- Model 2: One deviation followed by a lower high.
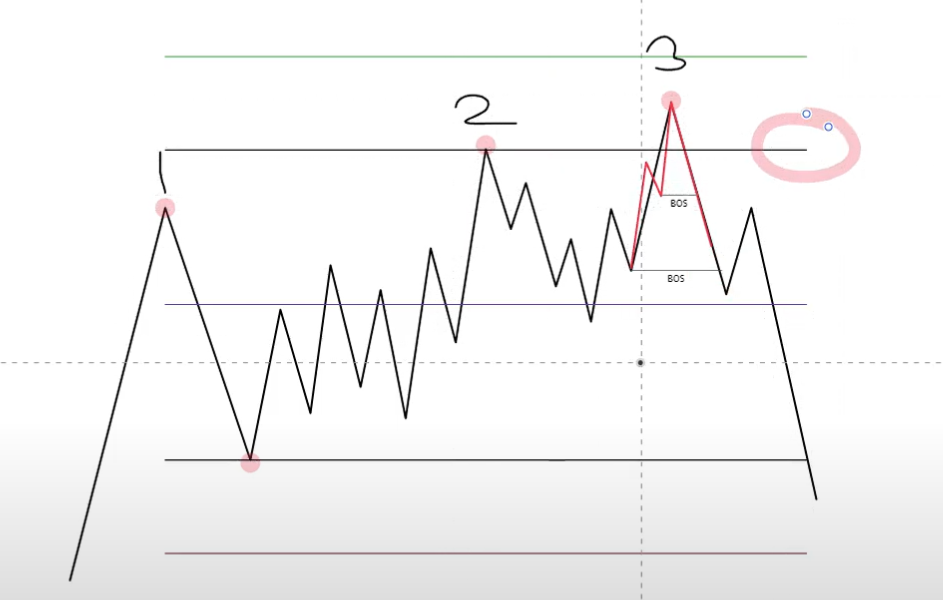
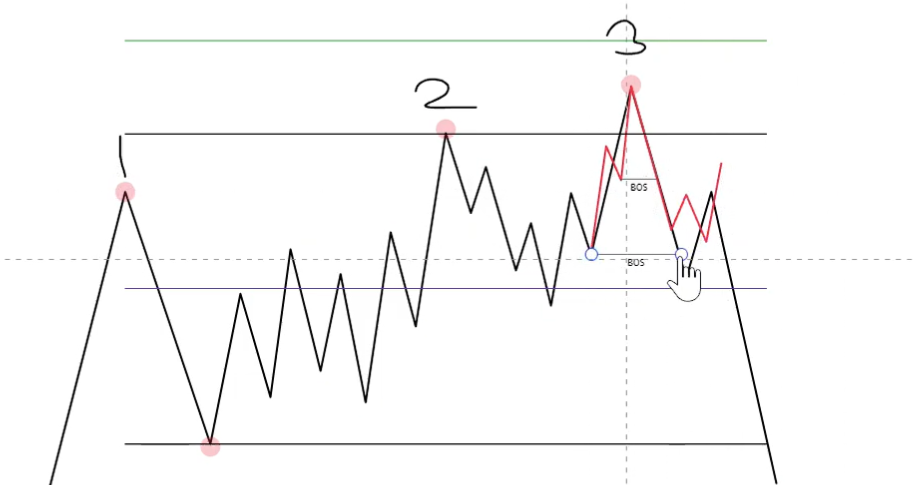
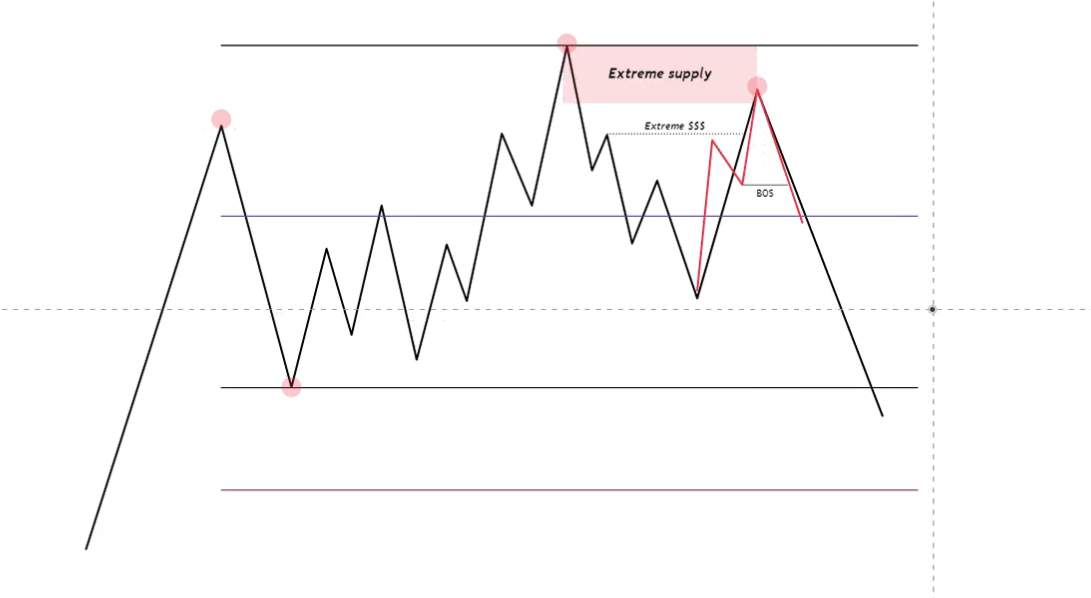
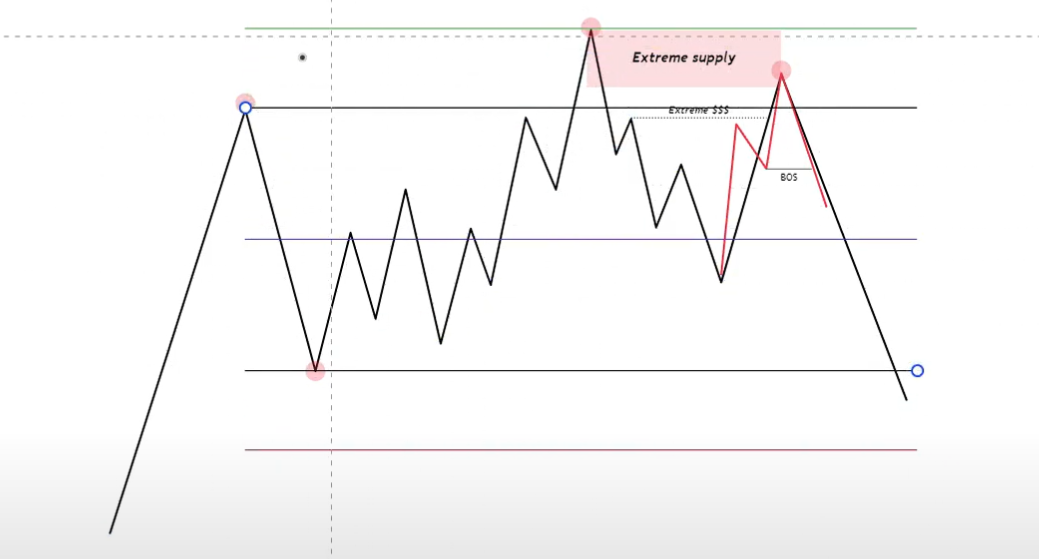
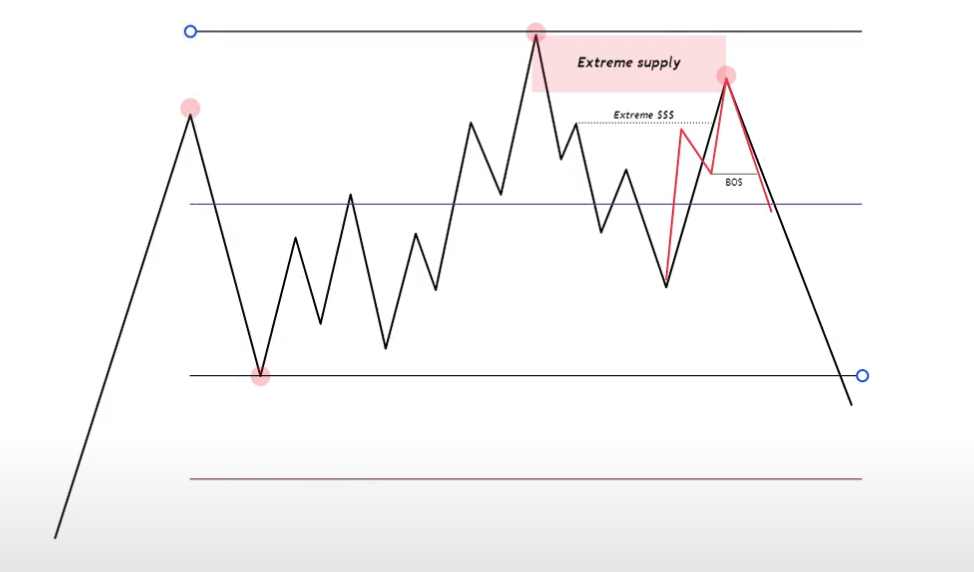
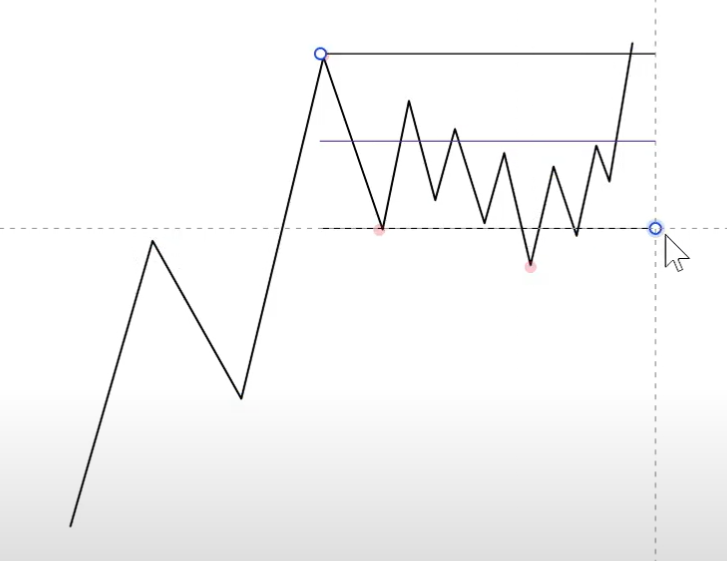
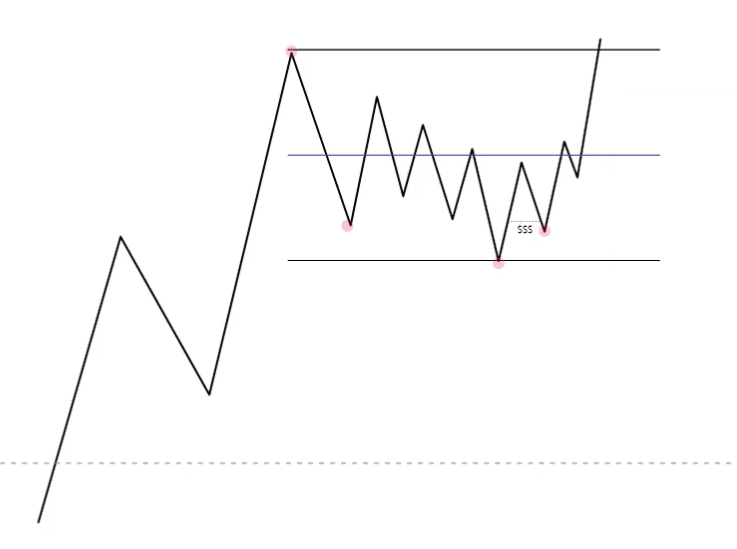
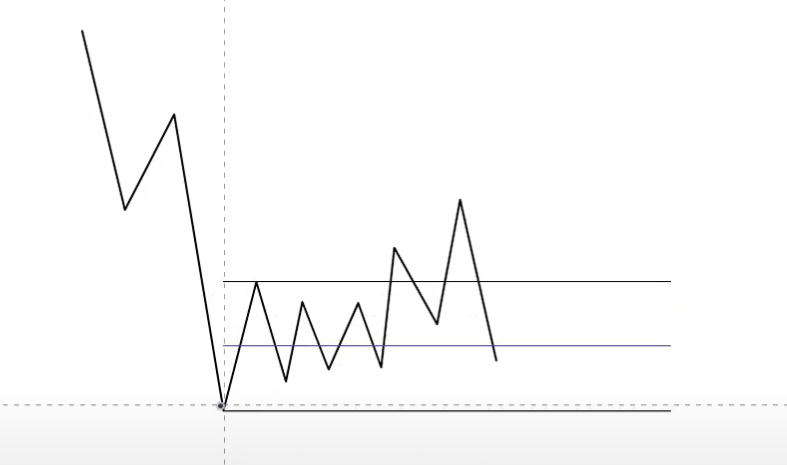
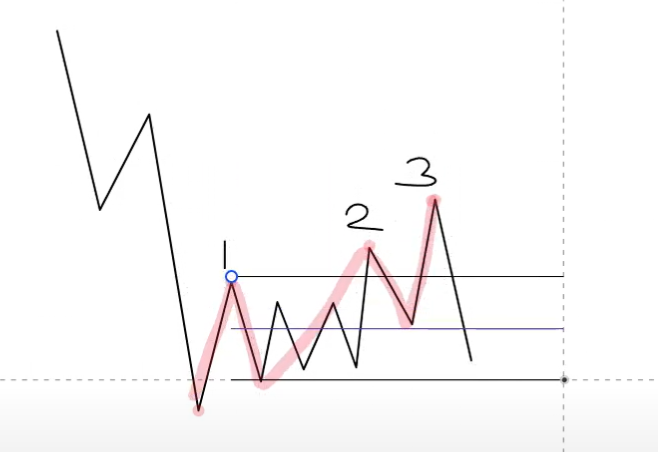
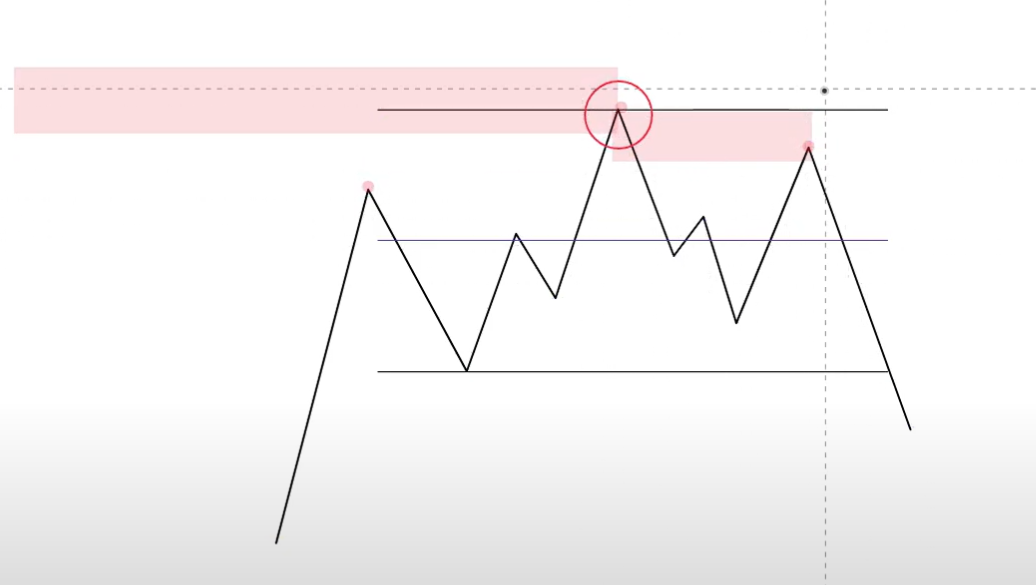
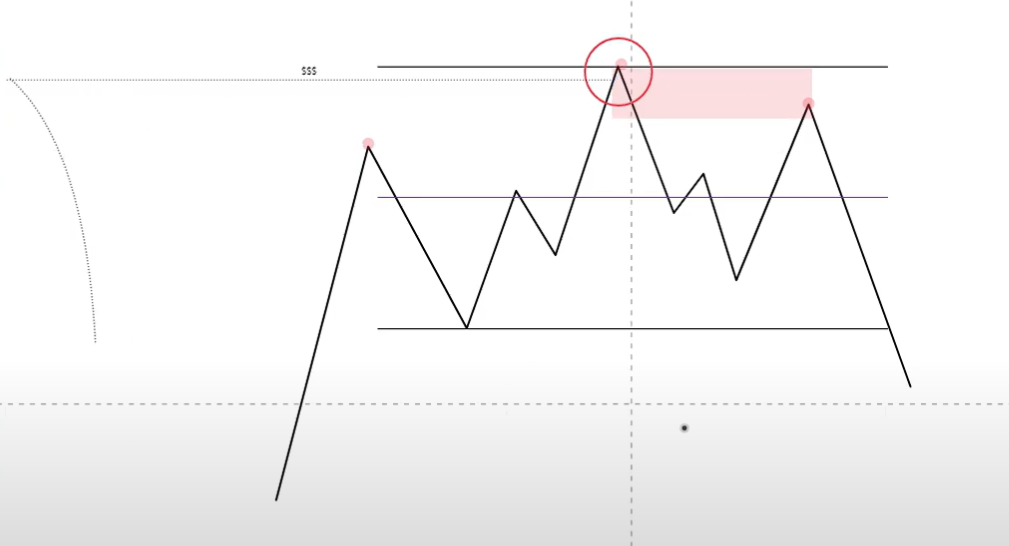
Model 1 Accumulation Schematic
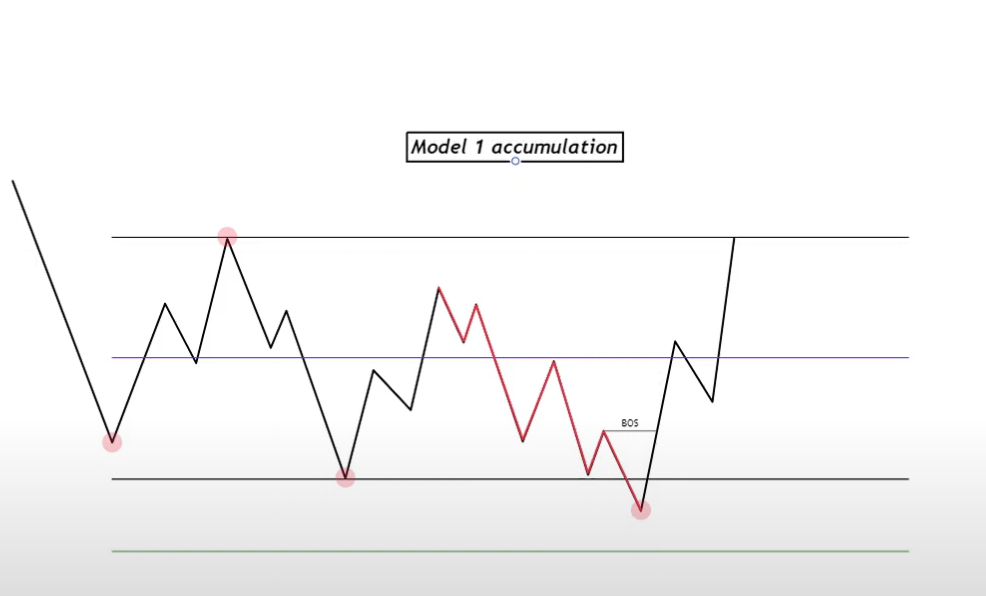
Structure:
- Define a range — pull from bottom to top in a downtrend.
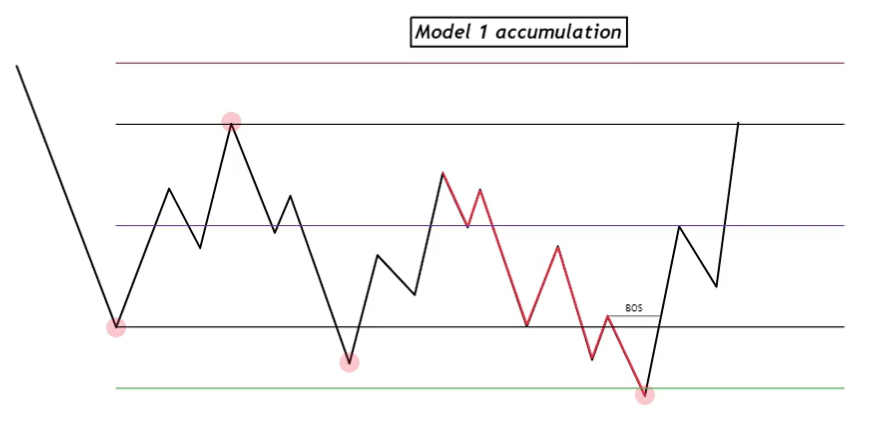
- Confirm the range upon return to equilibrium.
- Deviation 1 breaks below range low but doesn't close below the DL2 line (the deviation rule). Price returns into range — valid.
- Deviation 2 is lower than the first, also doesn't close below DL2 — valid.
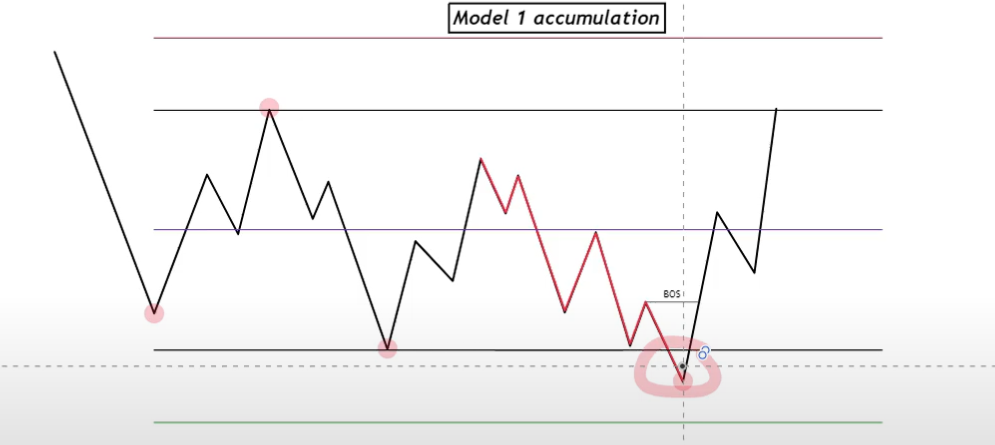
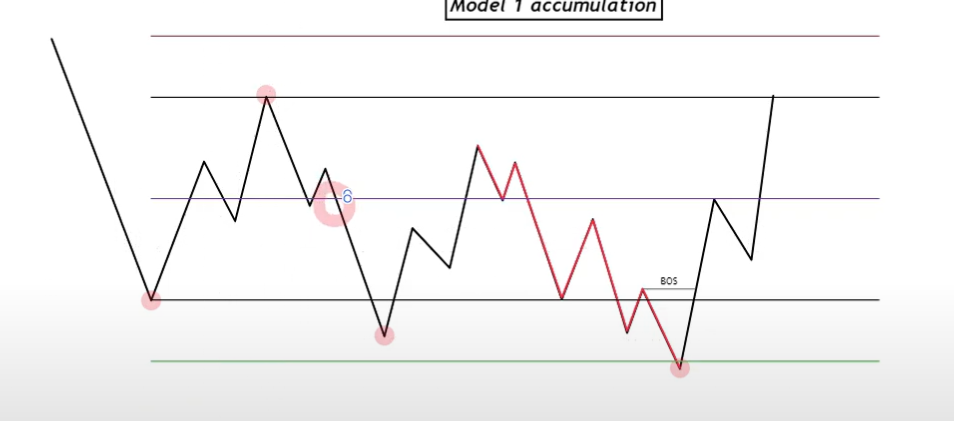
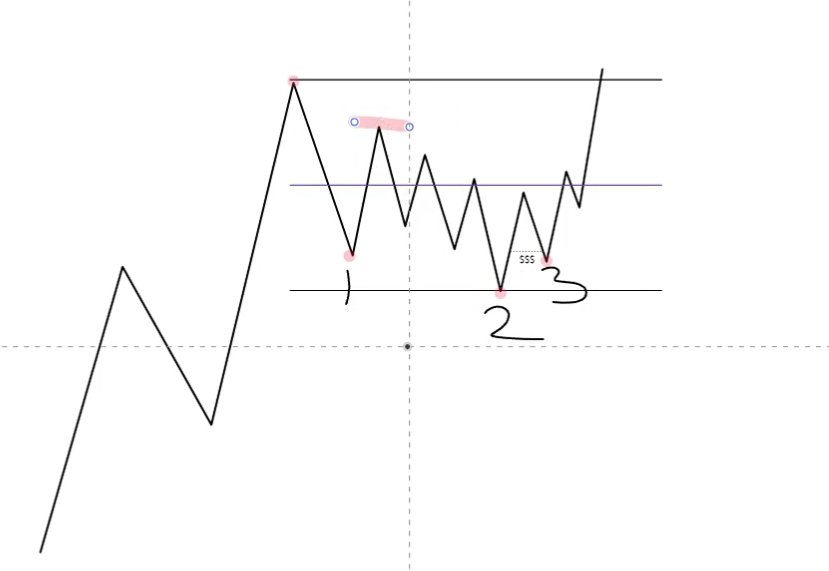
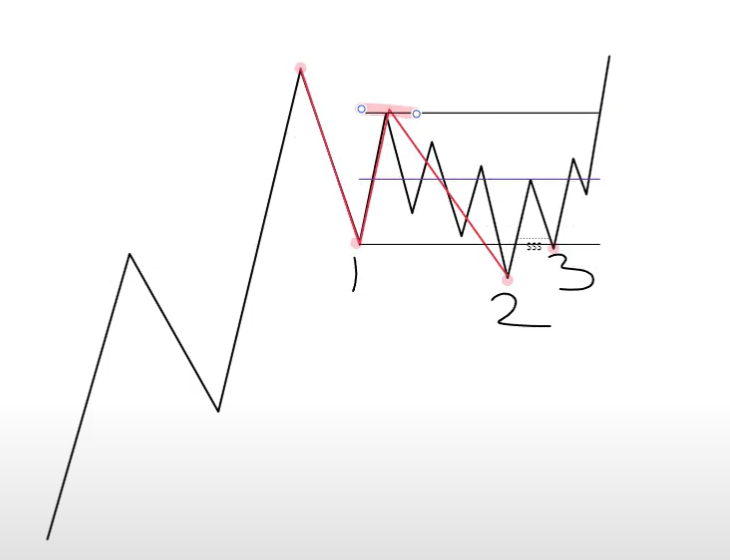
Confirmation of model:
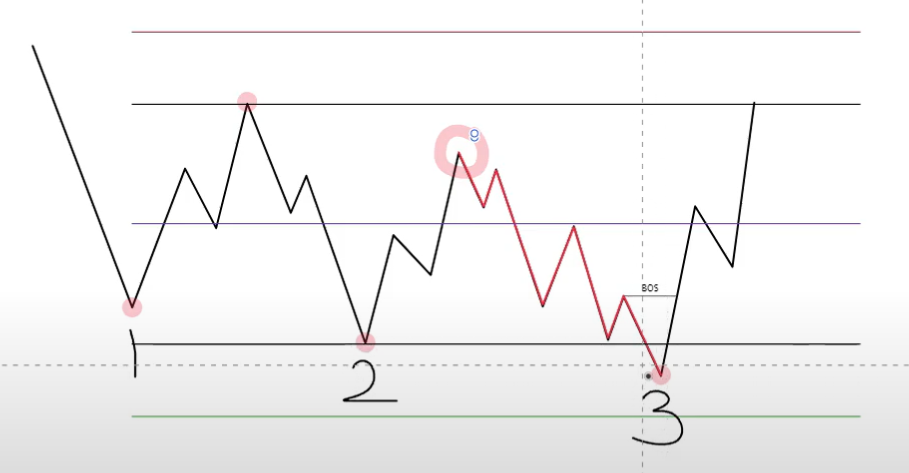
Observe market structure from the highest point between the low of Tap 2 and the low of Tap 3 (marked in red). You want lower highs and lower lows. When that market structure breaks back to bullish after deviating Tap 2's low, the Model 1 schematic is confirmed and you can go long.
Trade details:
It's always safer and better to watch for that BOS within the original range values (black horizontal line).
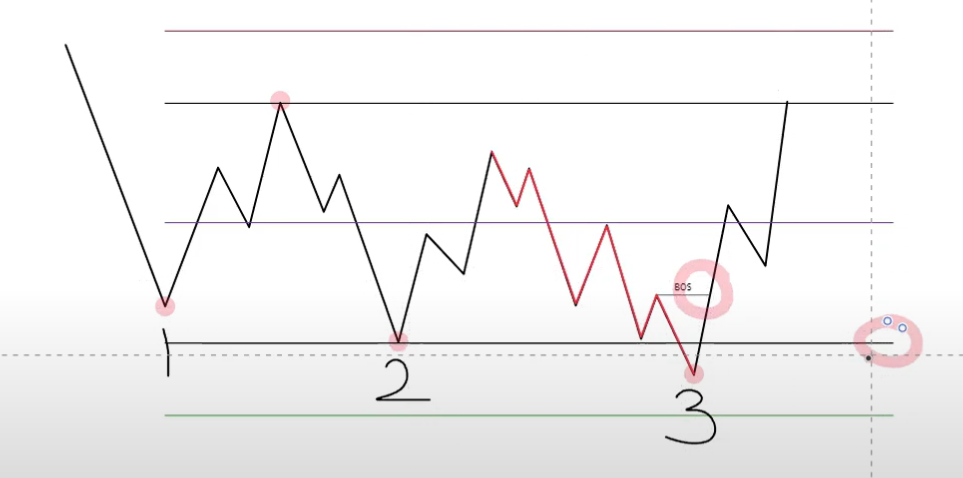
If it's below range values, it's riskier.
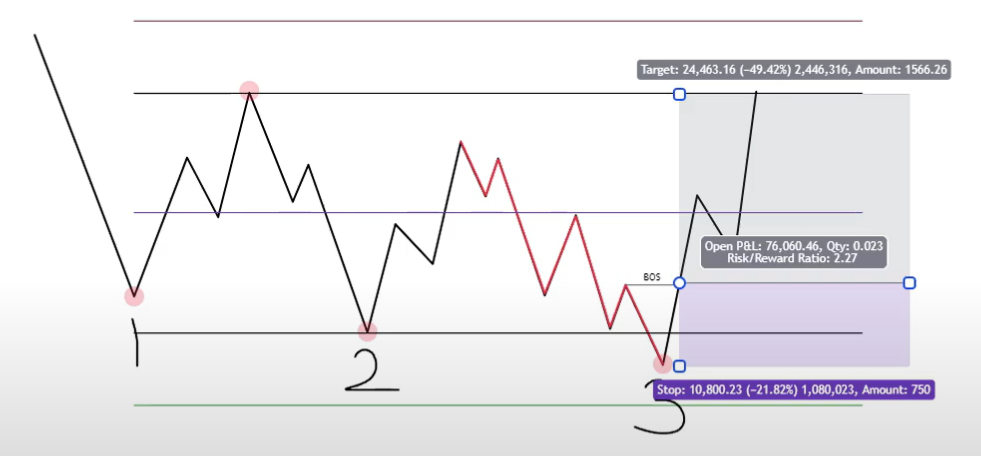
- Stop-loss: below Tap 3 (lowest point).
- Target: the opposite range high. Additional upside is bonus based on broader context.
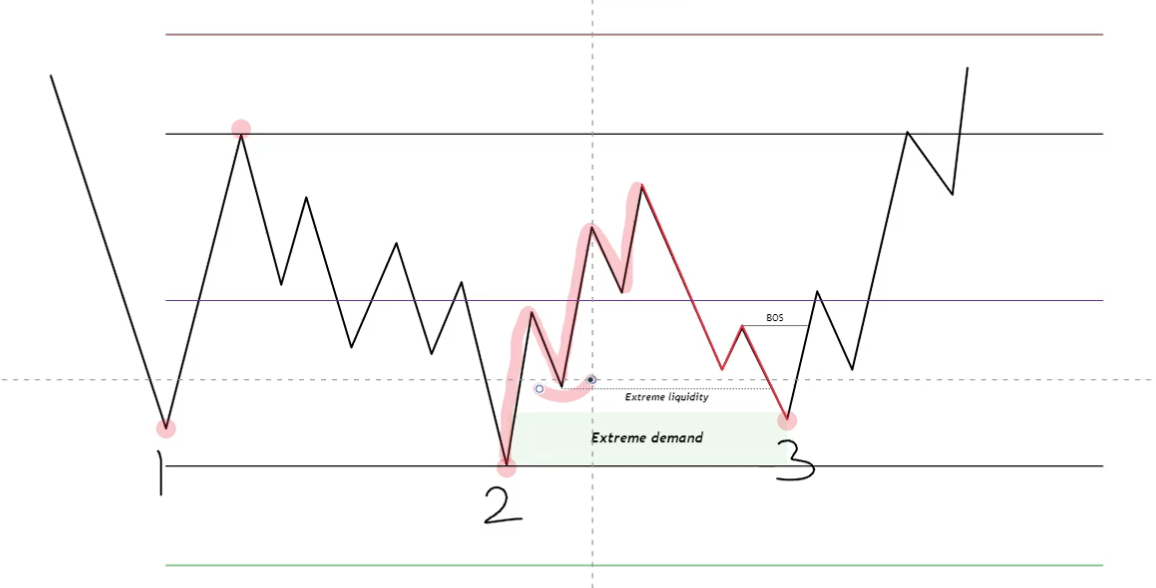
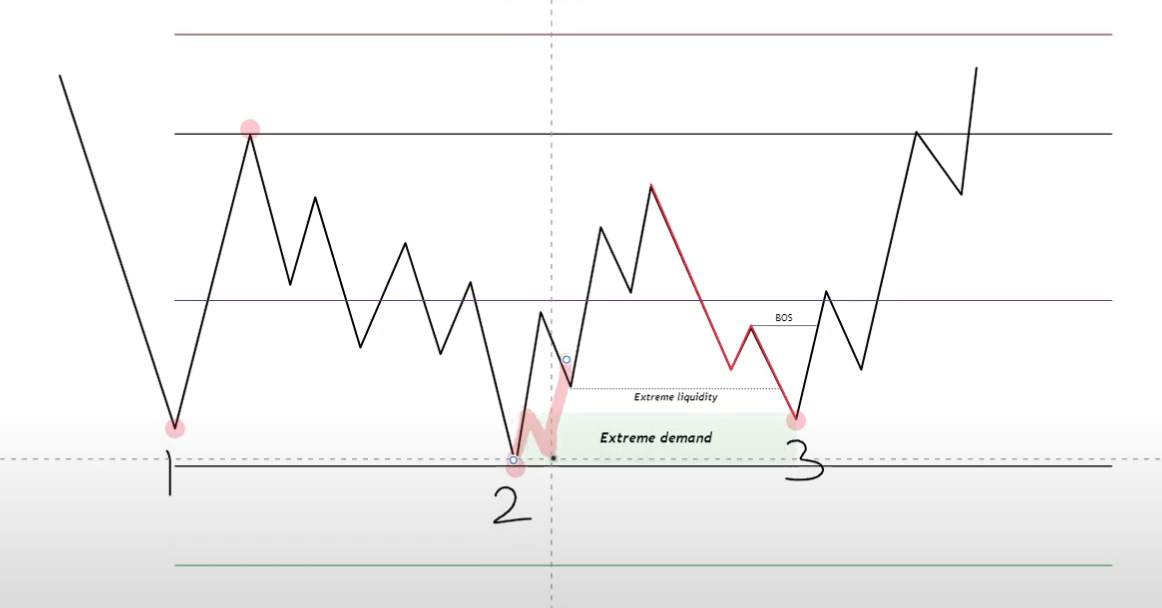
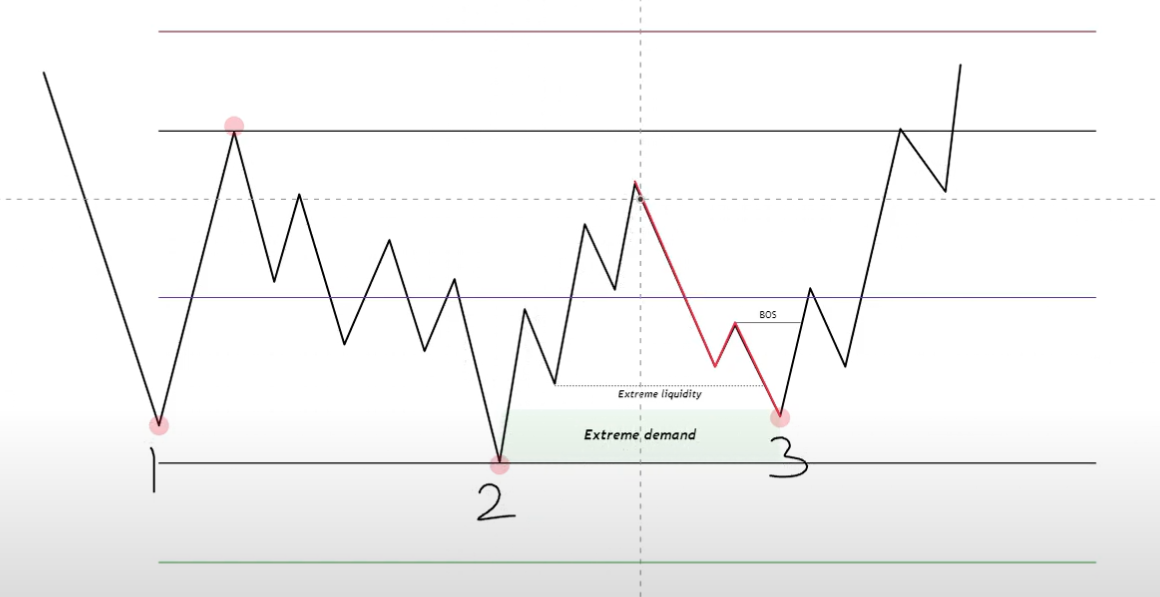
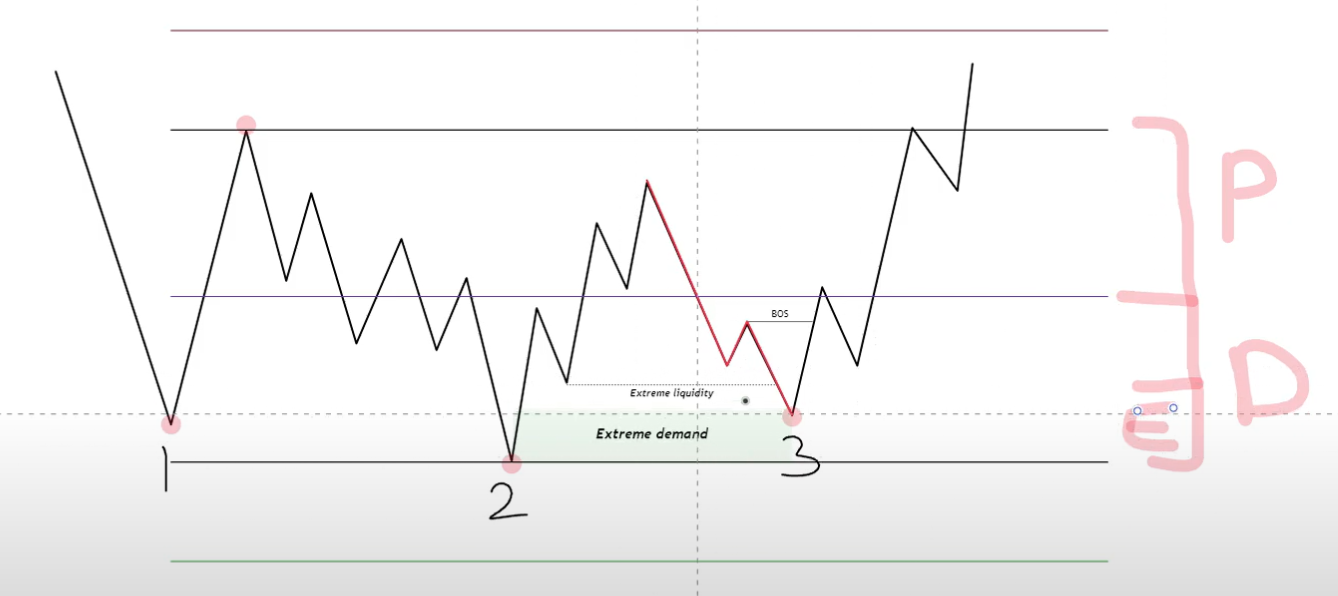
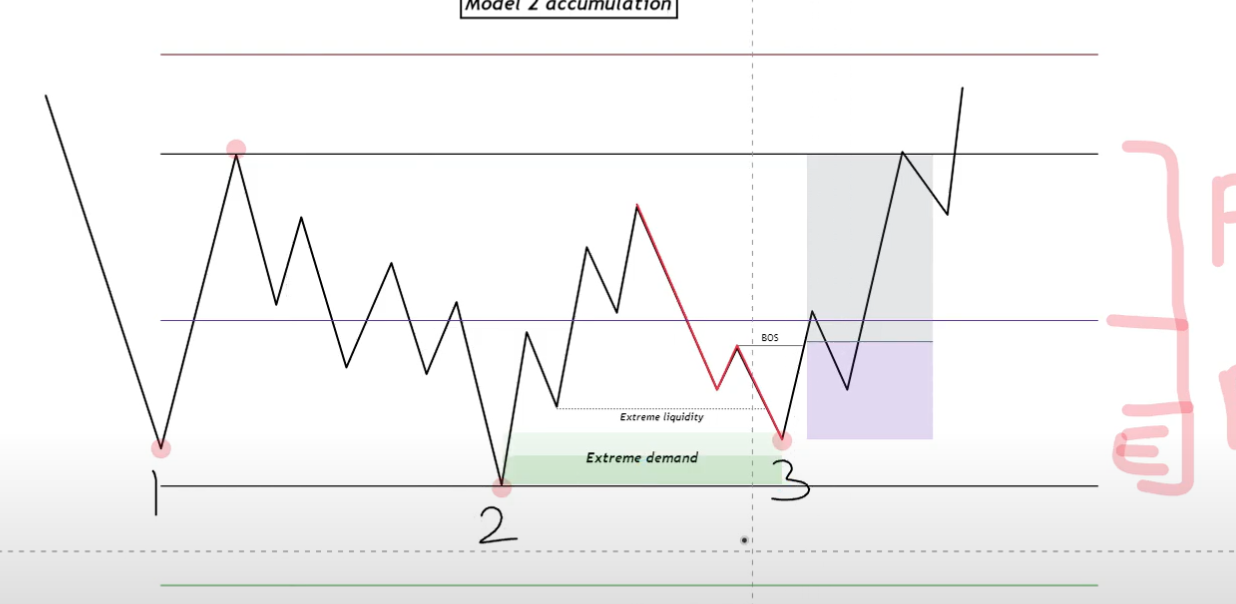
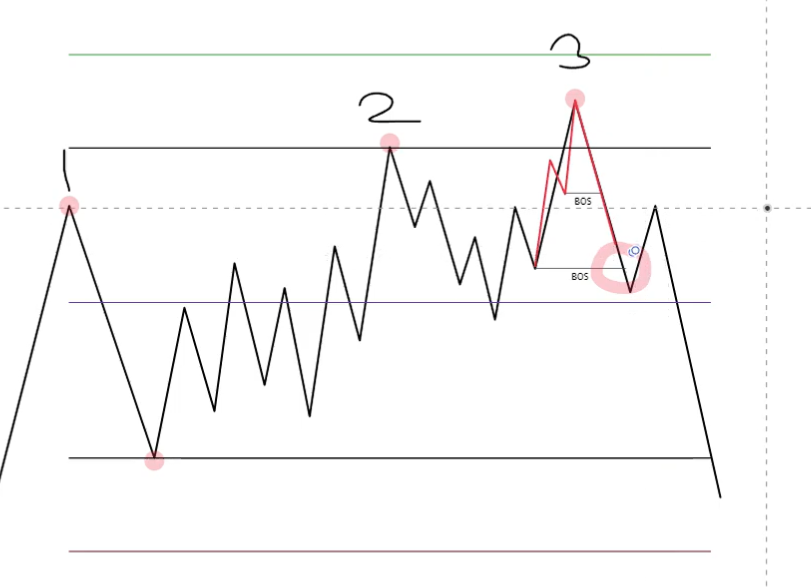
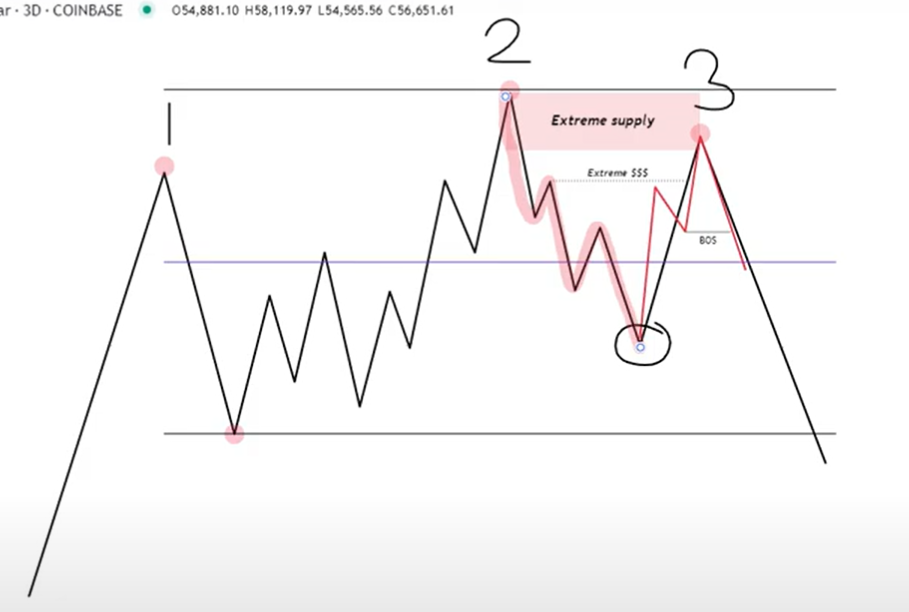
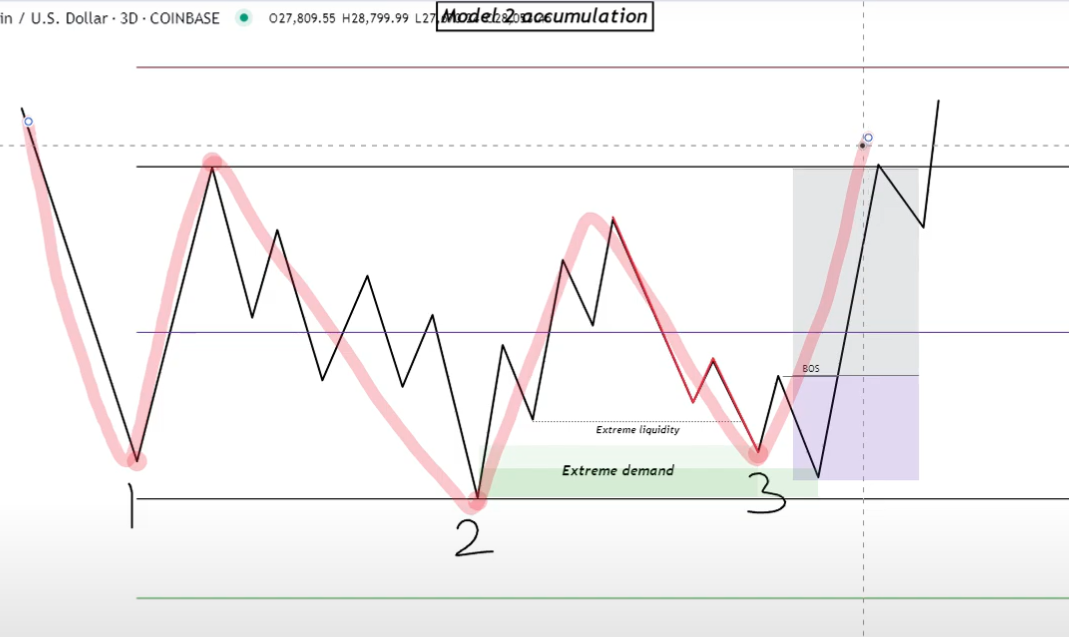
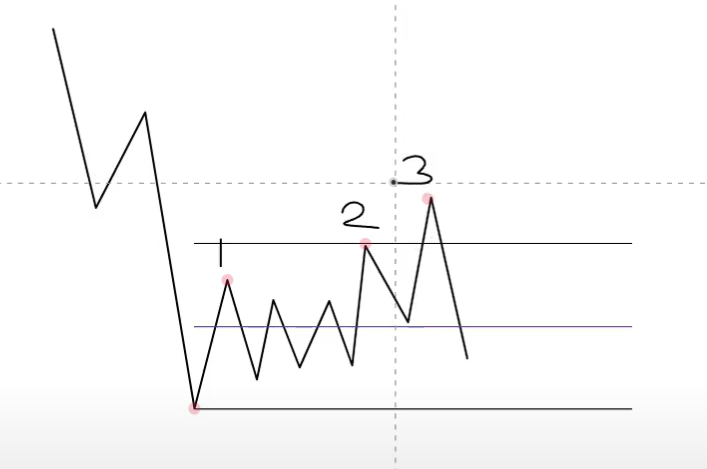
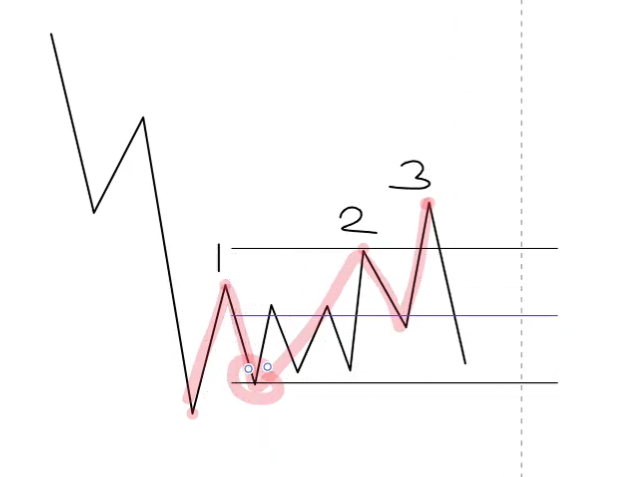
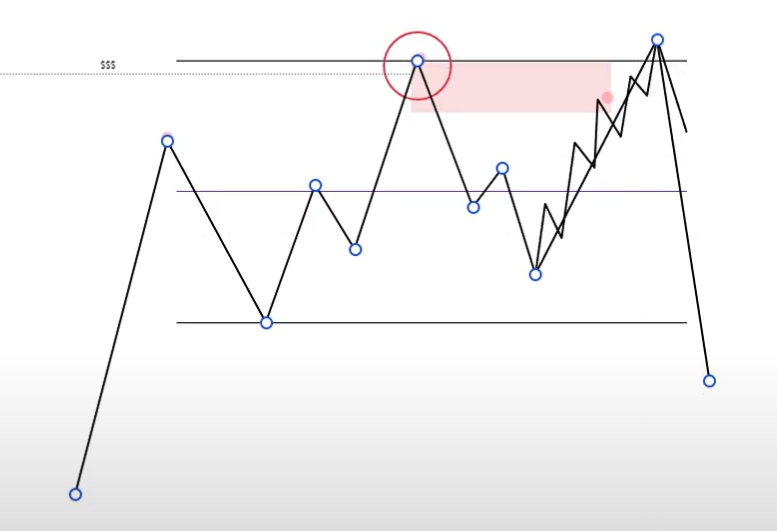
Model 2 Accumulation Schematic
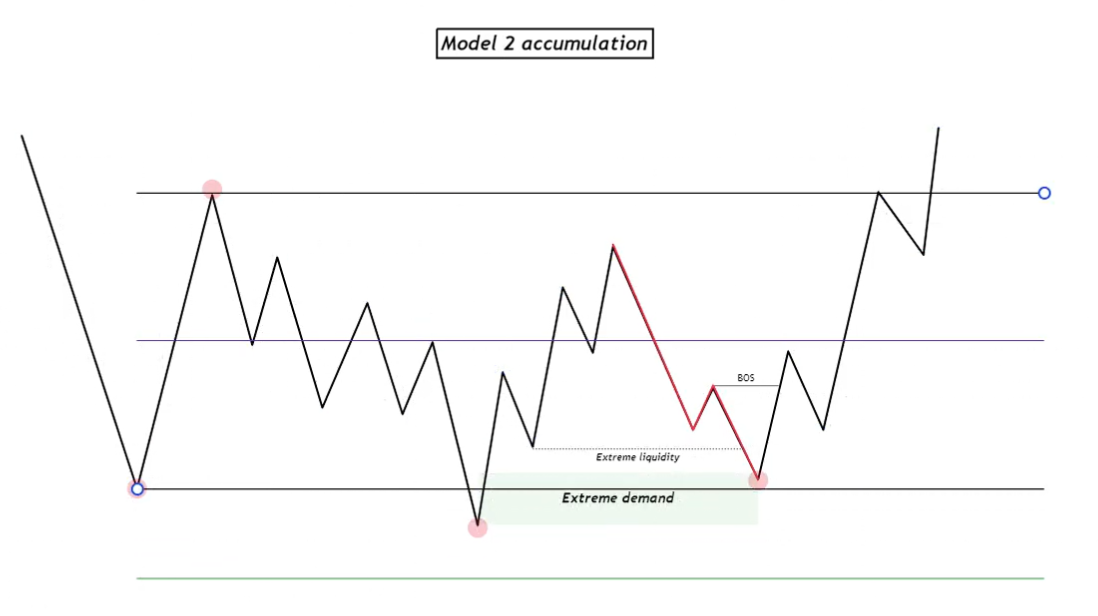
Range creation same as Model 1, confirmed after touch of equilibrium.
Deviation 1 as before. Tap 3 forms a higher low.
Requirements for Tap 3 (higher low):
Must fulfill at least one:
- Grab extreme liquidity — final liquidity point before the range low.
- Mitigate extreme demand — last demand zone before the range low.
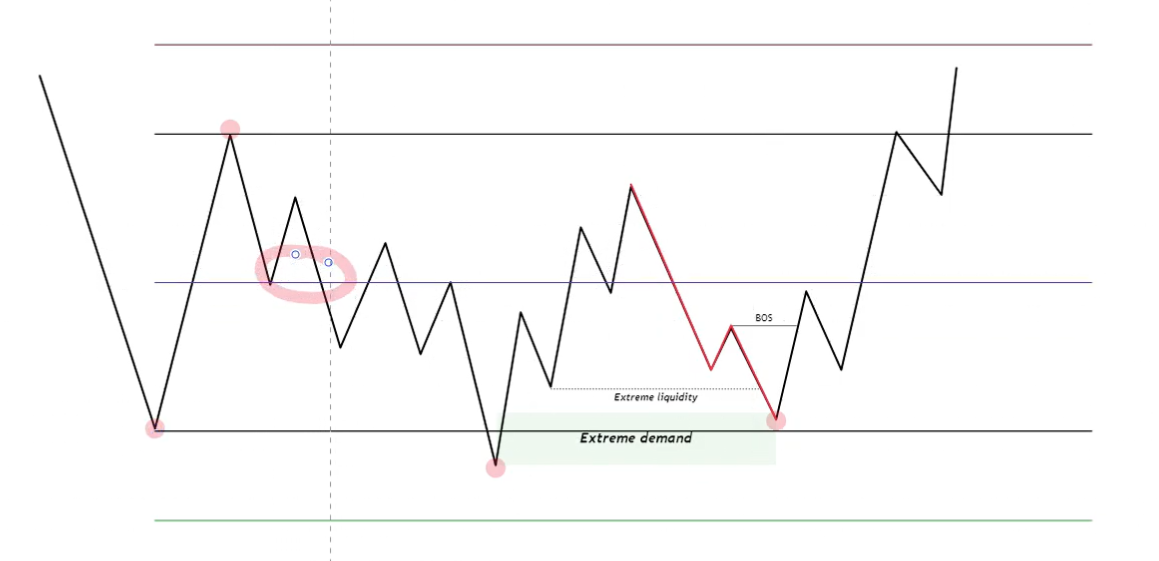
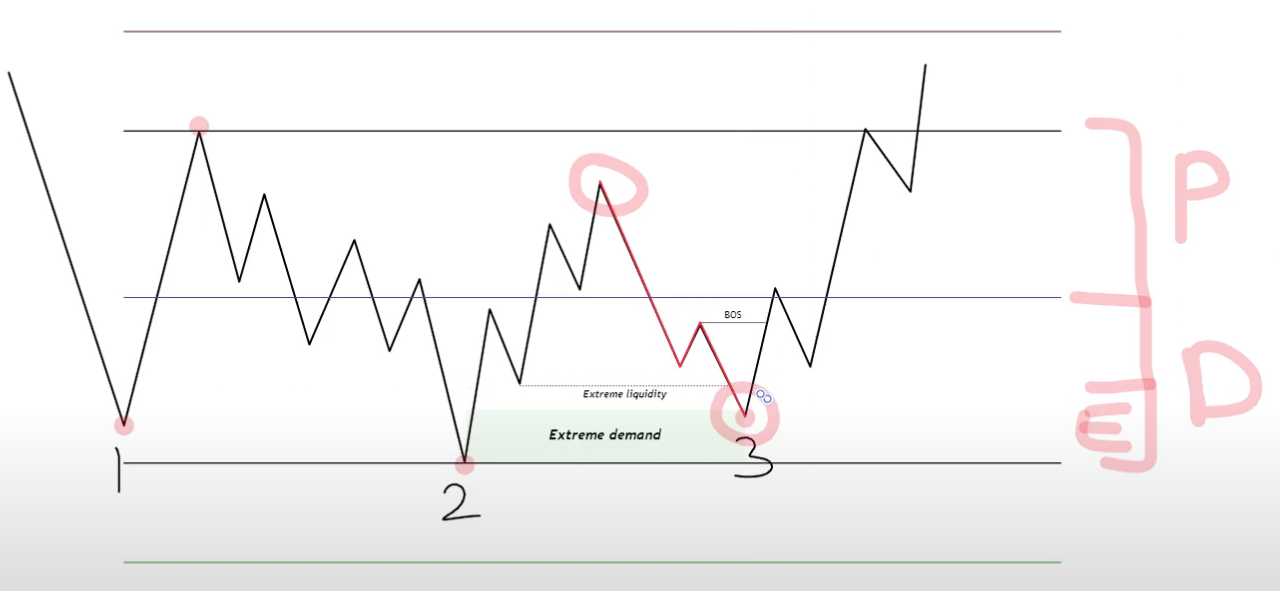
Extreme liquidity is the last liquidity point remaining before taking the new range high or low. For accumulation, that's the last liquidity point remaining before taking Tap 2's low.
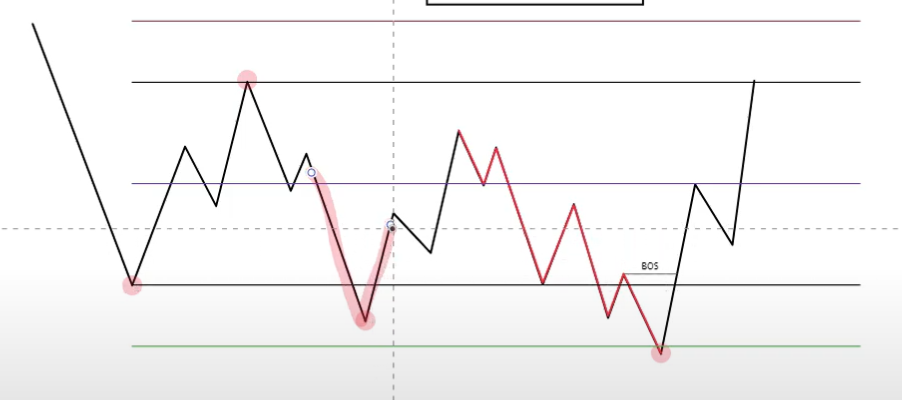
Typically the first market structure low found between Tap 2's low and the peak, applying the six-candle rule.
If too close to range low, use the next valid low instead — otherwise price may take out range low and become Model 1 instead.
If you're trading a really low timeframe schematic (2 minute), it doesn't have to be valid market structure under the six-candle rule. If you see a clean significant high missing one consecutive bullish candle for validation, you can still take the trade.
Extreme demand is the last demand zone protecting price from taking Tap 2's deviation low.
As price moves up from Tap 2:
Check for orderblocks and demand zones. Look for the last demand zone or order block remaining in the extreme discount section around Tap 2 — preferably around the lowest 25% of the new range after the first deviation.
Use structure demand or order blocks per the rules in the supply and demand lecture. If trading a 1-hour range, don't look for 2-minute orderblocks at Tap 2. If structure demand can be refined to an orderblock, don't put too much importance on it — use the entire demand zone.
Even if price didn't hit the refined area, if there's a bullish break of structure anyway, the model is valid.
If price comes back to retest the refined area then breaks bullish, model is valid.
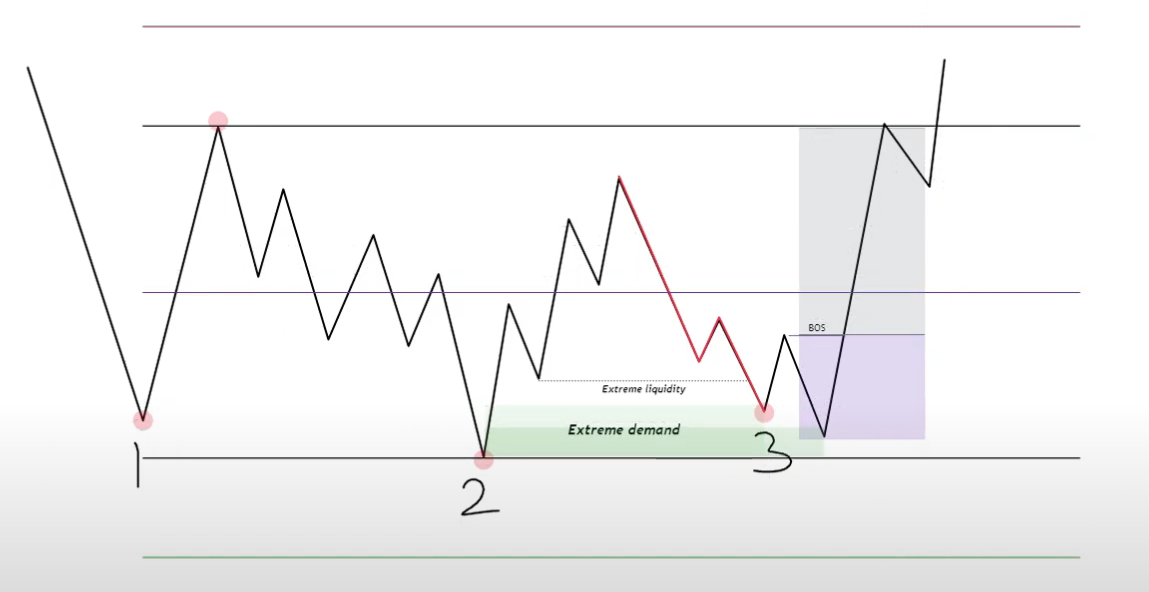
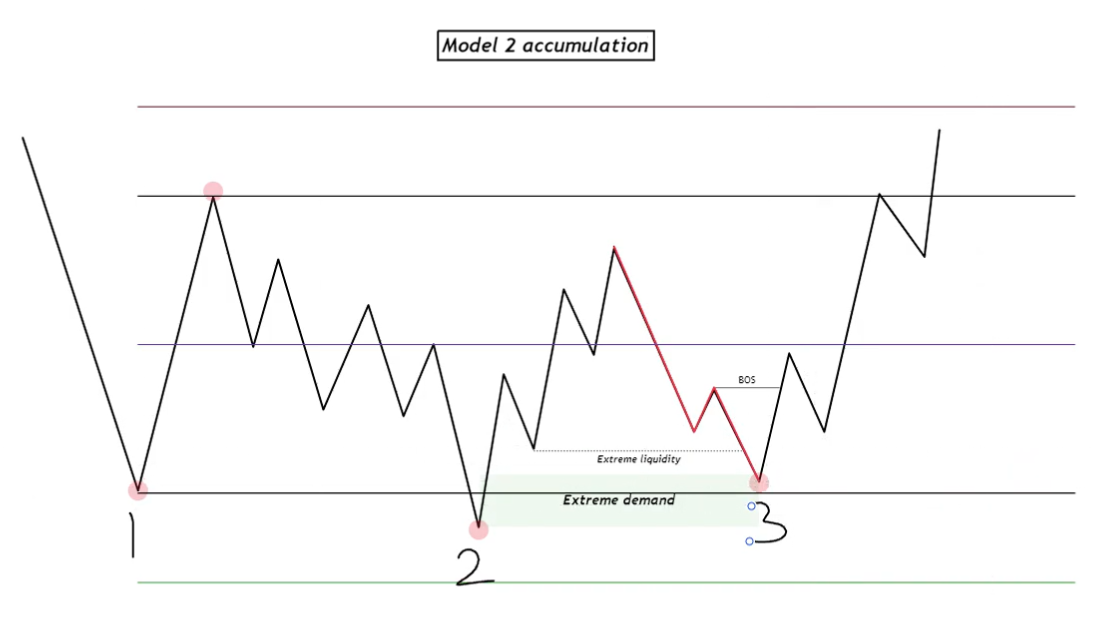
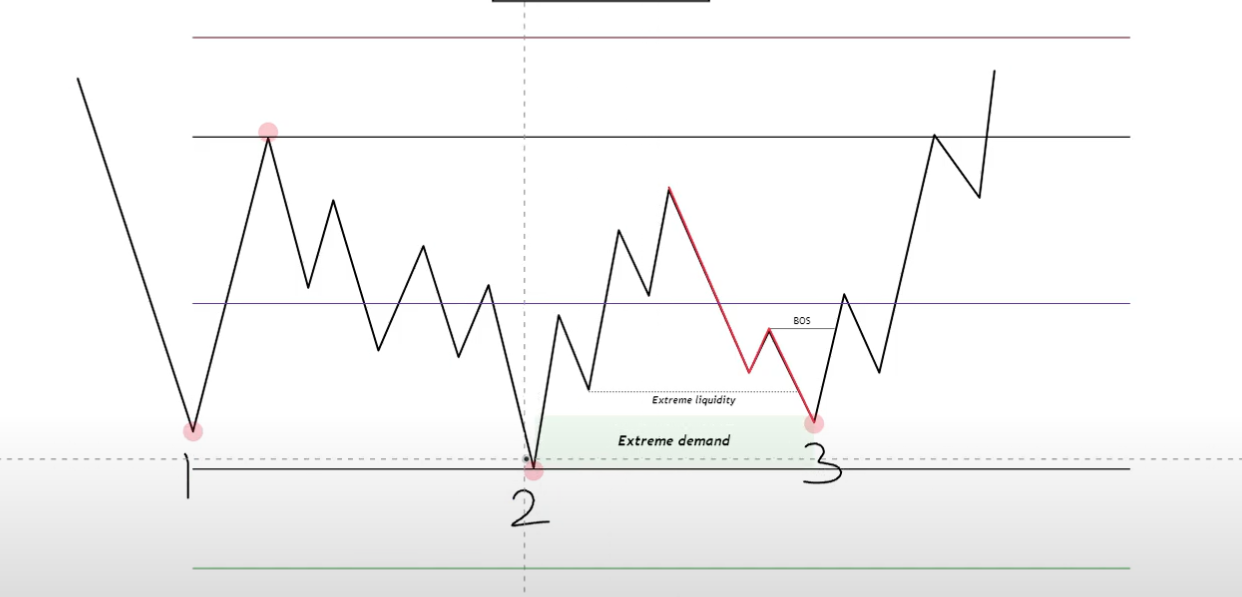
Entry confirmation:
Wait for market structure break from the high between Tap 2 and Tap 3 down to the Tap 3 low, then break back to bullish. Same entry, stop-loss, and take-profit as Model 1.
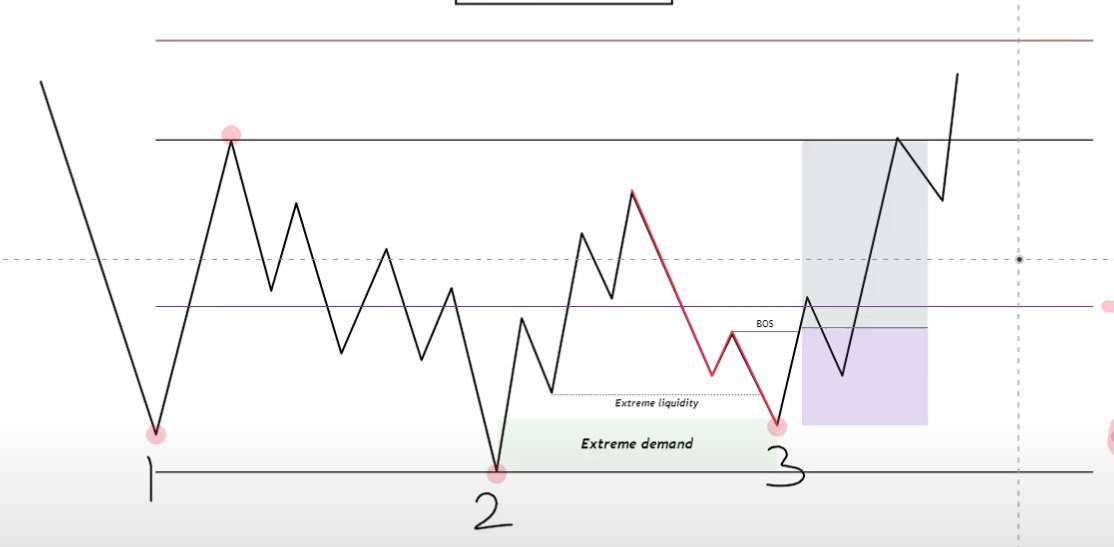
Just trading a higher low that meets requirements, targeting range high.
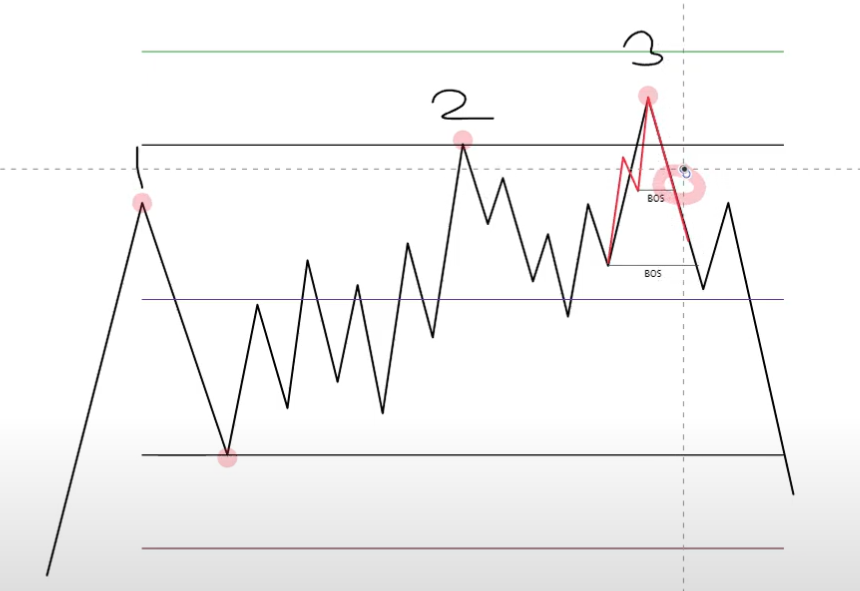
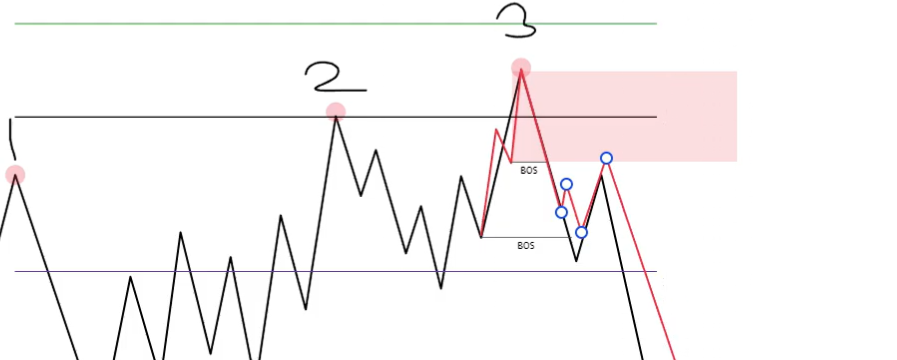
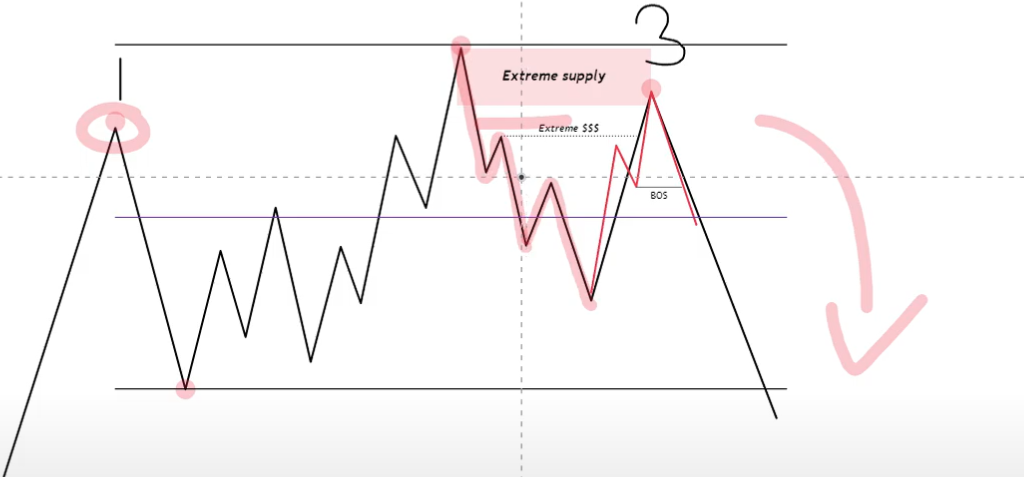
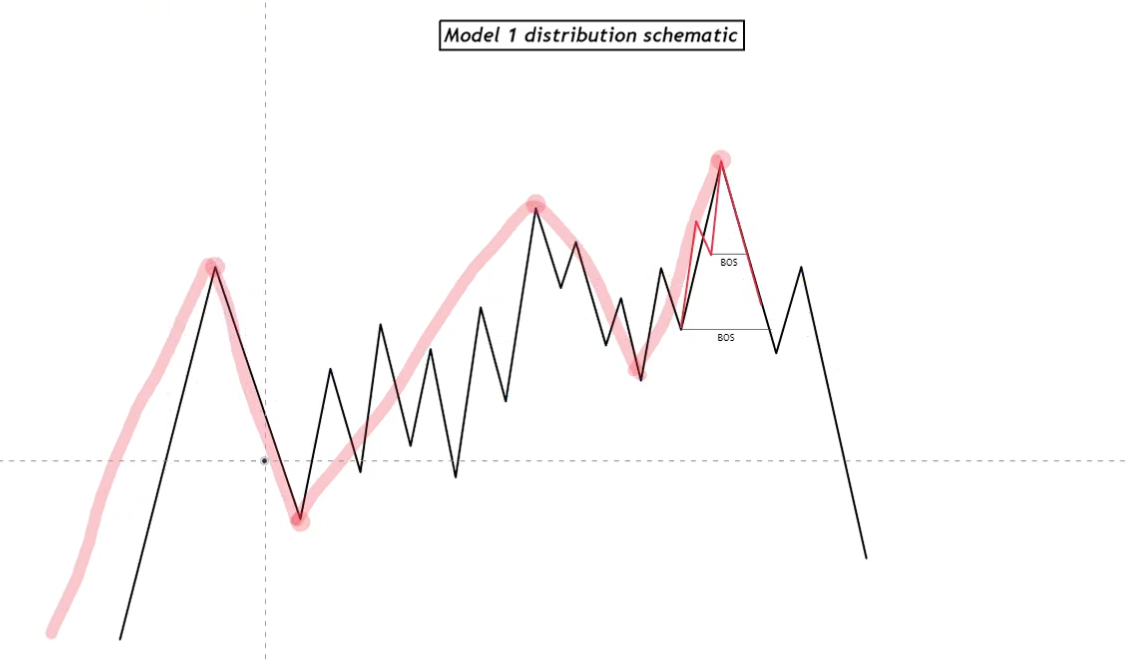
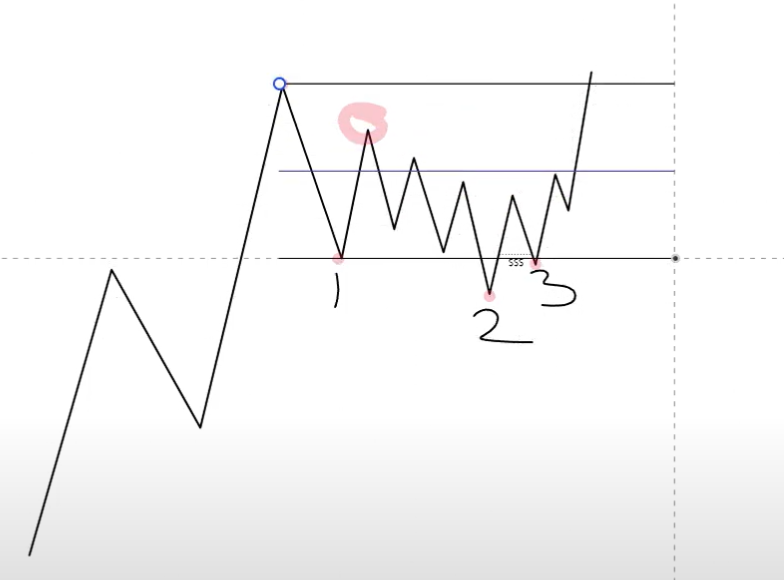
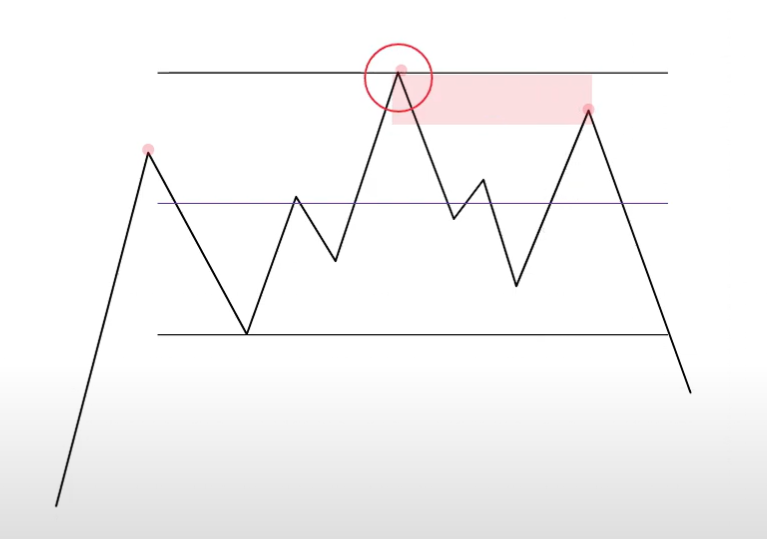
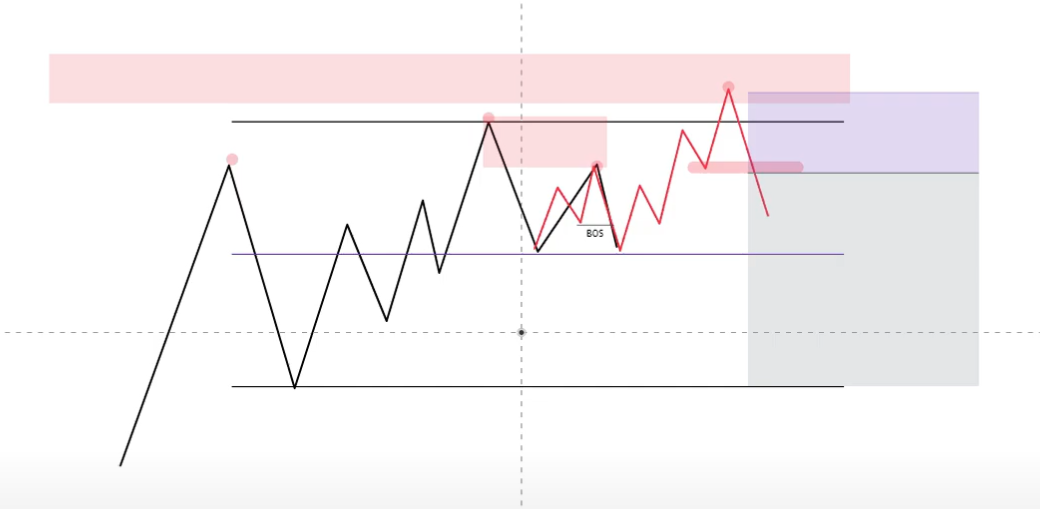
Model 1 Distribution Schematic
Structure:
- Trending up — pull range from top to bottom.
- Confirm range at equilibrium.
- Deviation 1: price exceeds range high, does not close above DL2, returns inside range.
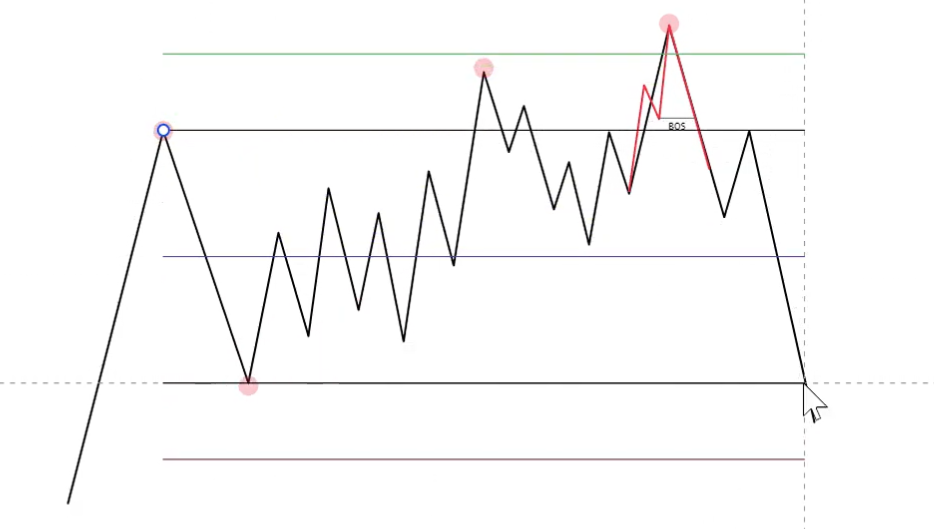
- Extend the range to the new high. Deviation 2: a higher high that also meets deviation rules.
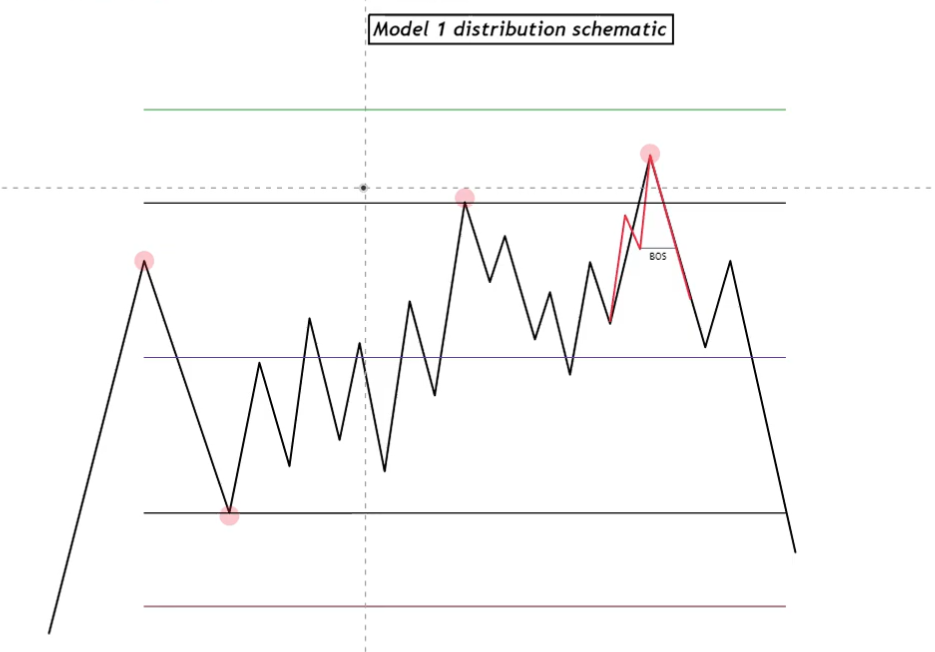
Entry confirmation:
Watch market structure from the lowest point between Tap 2 and Tap 3 up to Tap 3 high. Apply the six-candle rule from bottom to top. Confirm a bearish break in structure inside the original range to validate the setup.
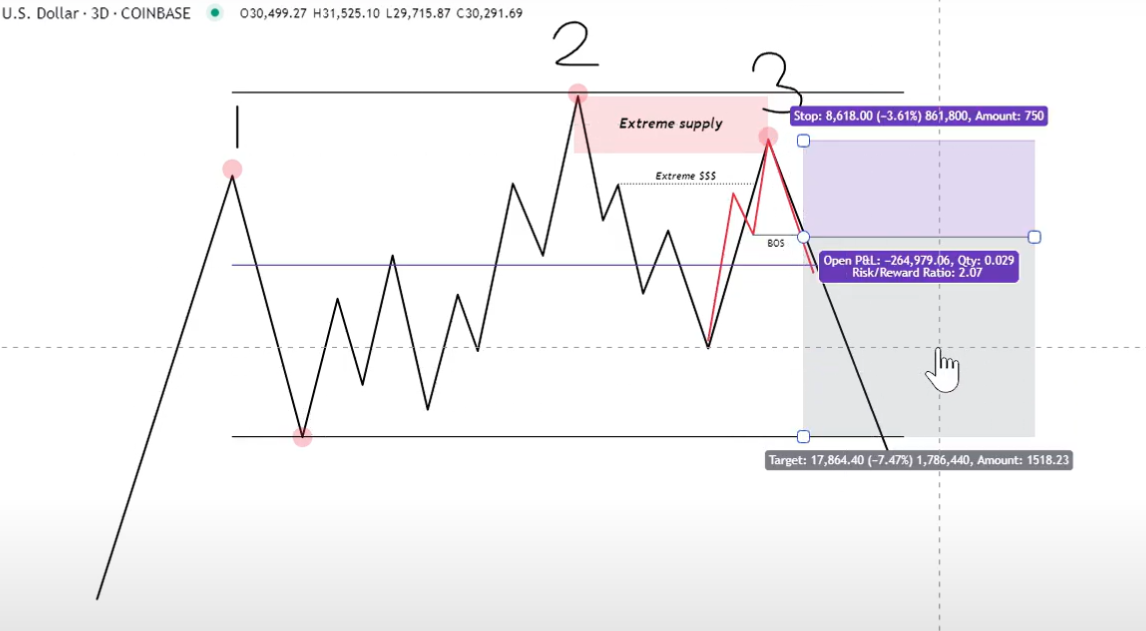
Multi-timeframe consideration:
You can look for a better break of structure deeper in premium on lower timeframes, especially closer to original range values (circled red).
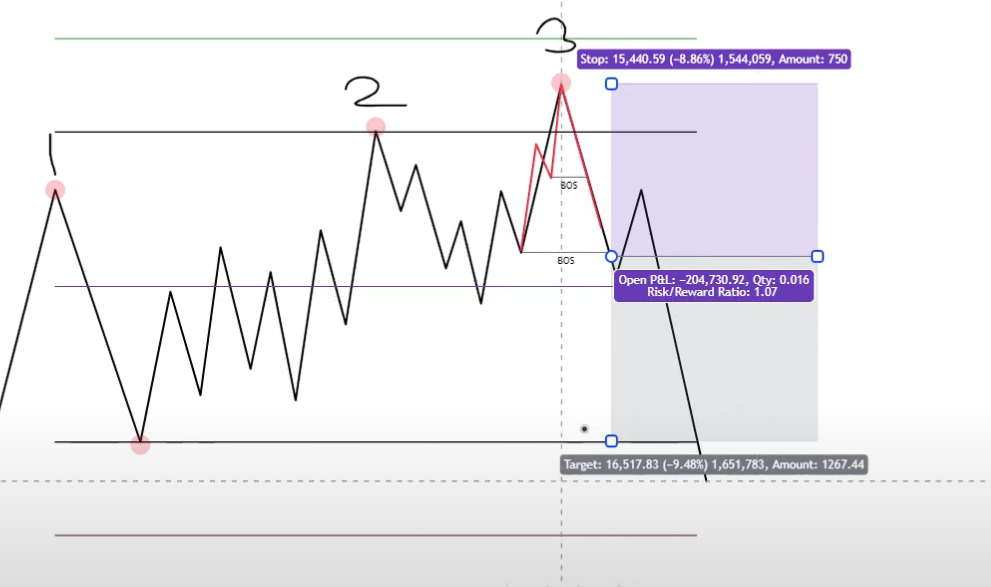
Use structure overlays:
- Black = higher timeframe.
 Super low and close to equilibrium — not ideal for entry.
 - Red = mid-timeframe. Better short entry because deeper in premium of range (still fills condition of breaking back down into Tap 2 range).
 You still want the HTF swing low to break as well, so pay attention to what price does after coming into that low.
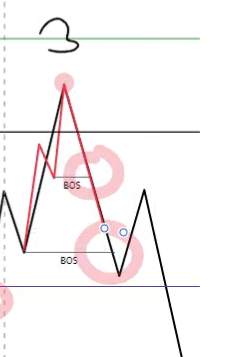 If the red market structure breaks back to bullish before the black structure low can break bearish, it's more risky.
 Often, that MTF bullish break is a fakeout just to mitigate supply just above (created from previous distribution).
 You can pay less attention to the MTF bullish break.
 - Blue = lower timeframe.
Trade setup:
- Stop-loss: above Tap 3 (highest point).
- Target: range low.
- Risk-reward: 2.75:1 on red structure entry vs 1:1 on black.
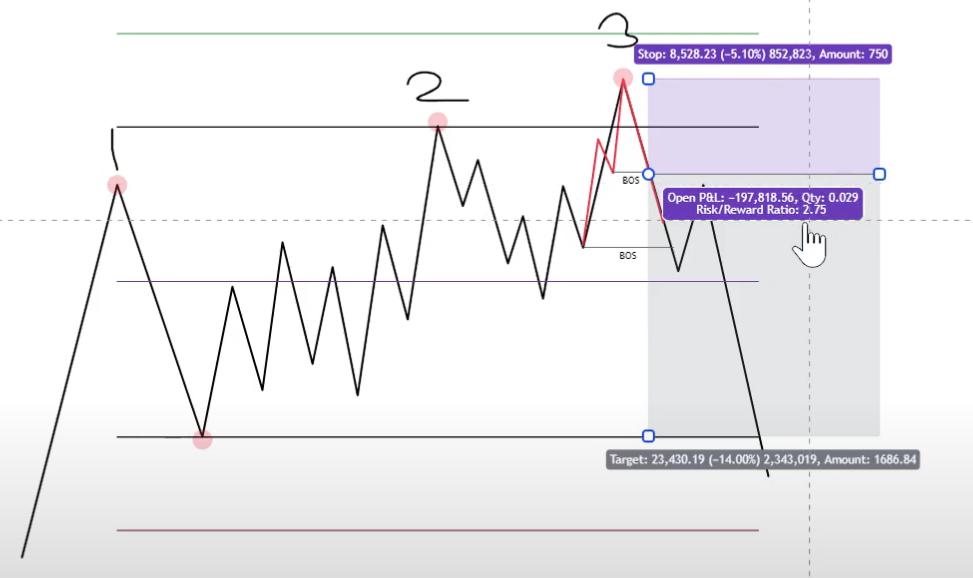
Overall, watch market structure for that 3rd expansion up.
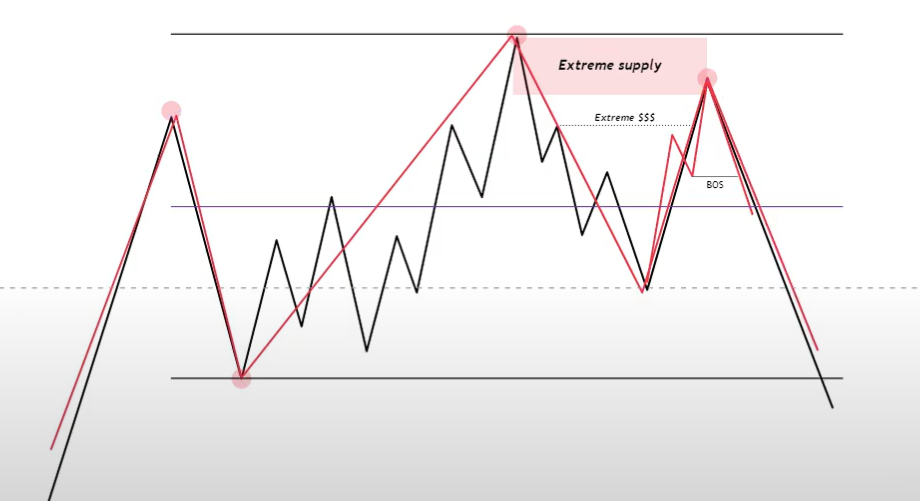
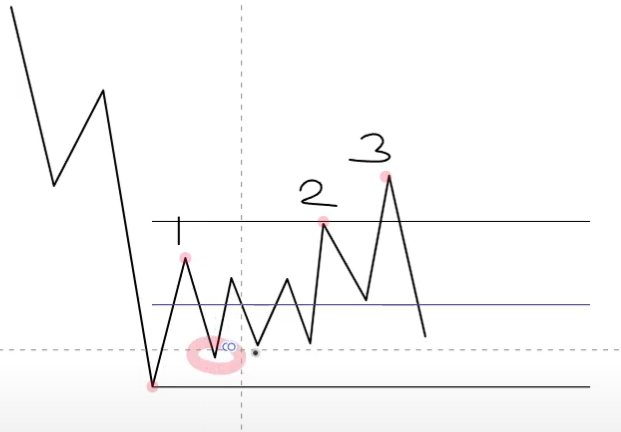
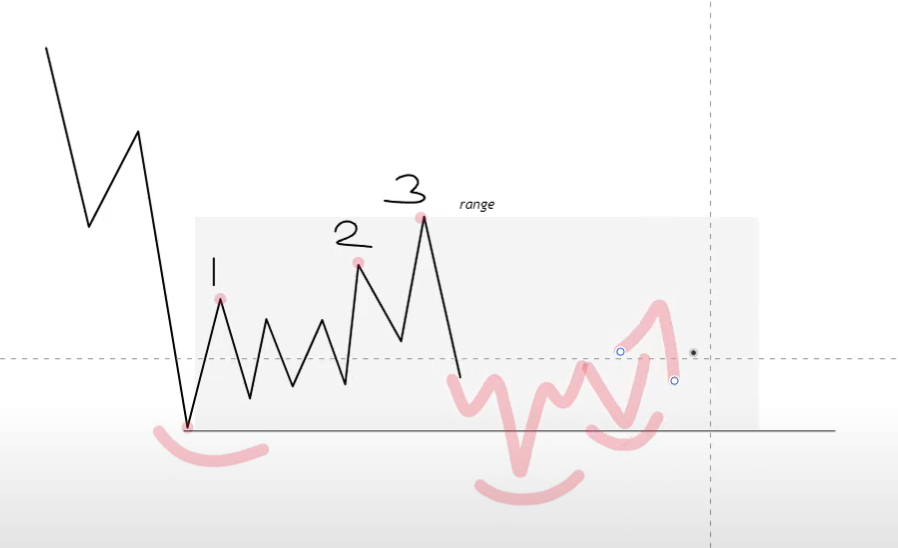
Model 2 Distribution Schematic
Structure:
- Same range setup as Model 1.
- Deviation 1 confirmed by DL2 (no close above).
- Extend range to cover Deviation 1.
- Tap 3 is a lower high, but not random. Must fulfill at least one criterion:
- Grabs extreme buy-side liquidity.
- Mitigates extreme supply zone.
Extreme liquidity:
Identified by drawing market structure from Tap 2 high to the lowest point between Tap 2 and 3. Use the six-candle rule to locate the first market structure high. If trading low timeframes, slight rule exceptions apply. Price then took liquidity, validating Tap 3's top.
Extreme supply:
Use order blocks or structure supply zones. Supply zones represent market makers shorting at Tap 2's high. Mitigating this supply confirms market maker participation.
Entry confirmation:
Structure break from the Tap 2–3 low up to Tap 3 high (reverse of accumulation). Once broken to bearish, enter short.
If no significant market structure on HTF, use lower TF to confirm break of structure.
Black structure (HTF) may show no clear structure around Tap 3 — drop to red (MTF) to find a valid break and enter there. Still use black as higher-timeframe validation.
- Stop-loss: above Tap 3.
- Target: range low.
Why Model 2 distribution has a lower Tap 3:
In Model 1, all liquidity from previous highs is taken out.
In Model 2, traders who shorted at Tap 2 have trailed their stop losses lower.
If you take that high (red marked horizontal line), you grab all buy-side liquidity from stopped shorts during the move down from Tap 2.
Extreme supply also matters because it signals market maker shorting. It's created when price makes a huge movement down. Market makers will not lose money shorting.
Timeframe Validity of a Schematic
A schematic is only valid on a specific timeframe if you can draw valid market structure using the six-candle rule at each Tap (1, 2, and 3). If the six-candle rule fails on the 1H, the model isn't valid on the 1H — even if it appears on the 45m.
Six-candle rule refresher: to confirm a swing high or low, it must have two candles before and two after in the opposite direction (5 surrounding + 1 center = 6 candles). This is the basis for structure drawing and validation.
Wyckoff Highs/Lows vs Range Highs/Lows in Continuations
This becomes important in reaccumulations (trend continuation up) and redistributions (trend continuation down).
Reaccumulation (trending up):
Pull range top to bottom.
Confirm deviation and higher low — valid Model 2 accumulation.
But sometimes the Wyckoff high ≠ range high. The Wyckoff high in reaccumulation is the highest point of the accumulation schematic (red line).
Solution: draw a local range from bottom to top, aligning so range high = Wyckoff high.
Always target the Wyckoff high (highest point between Tap 1 and Tap 2), not necessarily the drawn range high.
Redistribution (trending down):
Pull range bottom to top.
Extend range after deviation 1.
Wyckoff low may not match range low due to inner structure. Wyckoff low in redistribution = lowest point between Tap 1 and Tap 2.
Locally draw from top to bottom to align range low = Wyckoff low.
Adjusted for deviation 1 at Tap 2.
Again, target is always Wyckoff low.
New ranges can always form after the redistribution meets its target — for example, this can turn into a big accumulation.
When to Expect Model 1 vs Model 2
Both are valid and tradeable. But expectations can form based on Tap 2.
Model 2 likely when:
Tap 2 already mitigates extreme supply/demand on the left.
No liquidity for MMs to take — no incentive for a higher high.
Tap 2 sweeps major liquidity (e.g., from a long curvature).
Same logic — no remaining liquidity, no incentive to push price again for a second deviation.
But always trade confirmations. Don't commit based on expectation alone. If structure does not break bearish on Tap 3, it's likely Model 1.
Trade the structure, not the assumption. It shouldn't matter which way it resolves when you wait for confirmation of a break of structure for both.
Common Source of Losses in Model 2 Setups
Sometimes, a valid-looking Model 2 distribution (with break of structure) fails because there's still unmitigated supply above. Price comes back up, converts to a Model 1, and then drops. Same dynamic for accumulation schematics.
These are acceptable losses if structure was followed. The loss becomes a setup for a confirmed Model 1 trade.