Order Blocks: Naked, Hidden, and Partial
Order blocks are the refined precision tool of 🎁Supply & Demand. If supply and demand zones are the broad neighborhoods where whales transact, order blocks are the specific addresses. Master them, and you stop guessing at where price will react — you start seeing the levels algorithms actually defend.
This lesson is long because the topic is layered. We'll move from definition into the critical distinction between Naked and Hidden order blocks, work through Breaker Blocks, handle the messy middle ground of Partials, and close with examples that tie it all together.
Reference notes that complement this lesson: Order Blocks, Order Block Intro, ORDER BLOCKS Basics, Order Blocks Guide, Order Blocks Examples, and Order Blocks- The Battlefield of Buyers and Sellers.
What an Order Block Actually Is
An OB refers to a price area on the chart where significant buy or sell orders were previously placed by large institutional traders. These zones are key to identifying potential support or resistance levels.
Why do they work? Large banks and institutions with substantial funds cannot place all their orders at once. If they did, this would cause rapid price movements, preventing them from executing their orders at favorable prices. Instead, they place their orders gradually. Once the orders are ready, they often use significant news events to trigger a sharp price movement. Dumb money will tell you the move was caused by the fundamental news — when it's just a matter of TA/PA.
During this impulsive move, not all orders may be filled, leading to a price reversion back to the original order block. This return is necessary to balance supply and demand. Rapid movements create imbalances, which appear on the chart as gaps or imbalances. The price returns to the order block to restore market equilibrium before continuing the initial movement. You'll see the same logic in Auction Market Theory (Imbalances, Fair Value, Volume Profiles) and Supply & Demand Zones Intro — order blocks are the missing piece that lets institutional logic become tradable on the chart. This is the bridge to Trade like Institutionals.
OBs represent liquidity and become strong levels when supported by a fair value gap (FVG). This combination acts as a magnet for price before continuing in the same direction.
The two rules that govern everything else:
- Untested OBs > partial tested OBs.
- HTF OBs > MTF OBs > LTF OBs.
Trading bots can be programmed to identify and respect OBs in spot trading just as they do in futures. They analyze historical PA and identify key support/resistance levels. When a bot identifies an OB, it acts according to its strategy — a trend-following bot may wait for price to approach an OB before initiating a trade in the direction of the HTF trend. This is why these levels work: Algos🐋 respect them.
OBs represent volume and liquidity. The HTF OBs hold more liquidity than MTF/LTF OBs and therefore more reversal pressure. A 1D candle represents more volume than a 4H candle, and both represent more than LTFs, leading to fewer false signals at higher timeframes.
Lagging indicators aren't necessary. The trading bots responsible for the largest moves prioritize liquidity and don't rely on them. If you want to play alongside whales and bots, play on HTFs — you'll end up seeing the true and most successful "patterns" in this game.
The Body, Not the Wick
Body of candle. That's the order block.
If you want to widen the area into wicks to include a whole demand or supply area, you can do so — but a wick isn't an OB. The OB is what it is. Some students prefer to focus on bodies only because that's where true liquidity lies.
There's no different concepts for explaining OBs unless you're going YouTube style. An OB is an OB.
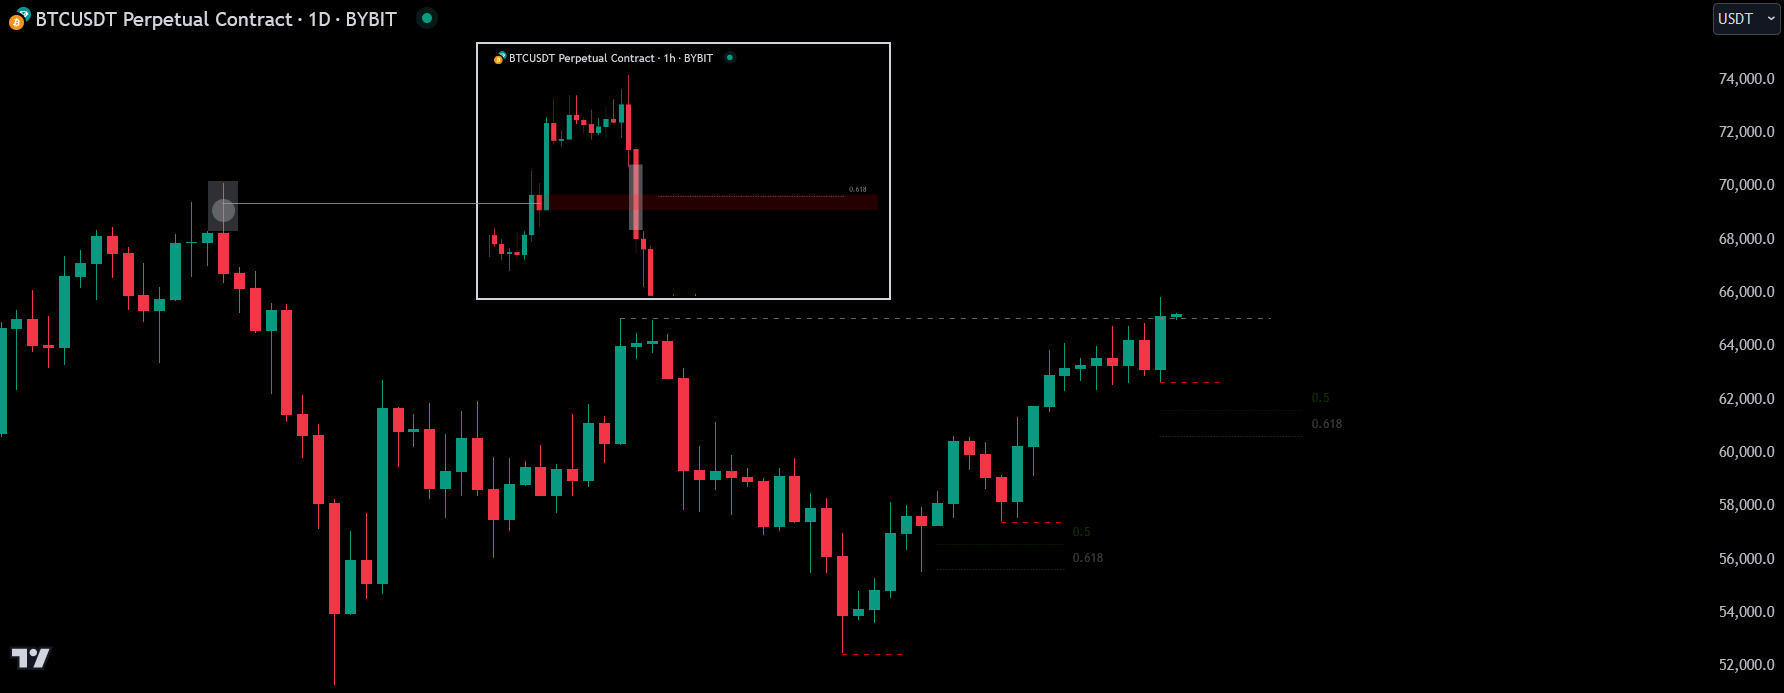
For wide HTF OBs, set entry at the equilibrium (the 0.5 fib) of the OB. Depending on the size, you may set the Limit Order at the start of the OB where it will be initially touched. See 🔷Entry of Trades and LO.
When a teacher's chart asks "wick or body for the .5 fib of the OB?" — body. Always.
Fib retracement — has to be placed from last HTF top swing high or candle body close?
Always wicks, and 0.5 of FVGs + OBs.
What you need to gain experience on is figuring out which wick is "the wick" if there's more than one.
The only fib I use on OBs is 0.5. Refining is done by finding more ♨️Key Levels🗝️ on lower TFs, starting from the highest TF possible. The answer is in observing closely through different timeframes. See 👑Refine or Ultra-Refine Plays.
This is a Weekly OB with the 0.5 🔷Fibonacci Levels confluence drawn out.
Clean OBs
I think they have to be clean to be an OB — no small candles in between, only 2 candles. The wicks are not included when drawing the level. Clean OBs also have an impulse up or down following them.
For OBs with long front candles, you draw the level from the shorter candle:
These will always be partial OBs and thus weaker than ones with a short front candle.
The Four Pillars of a Valid OB
To properly identify an OB, four conditions must be respected:
- #Liquidity Grab
- #Candle body
- #BOS – 🔷Break of Structure
- #Inefficiency/Imbalance
Remember: the higher the timeframe, the more powerful the OB.
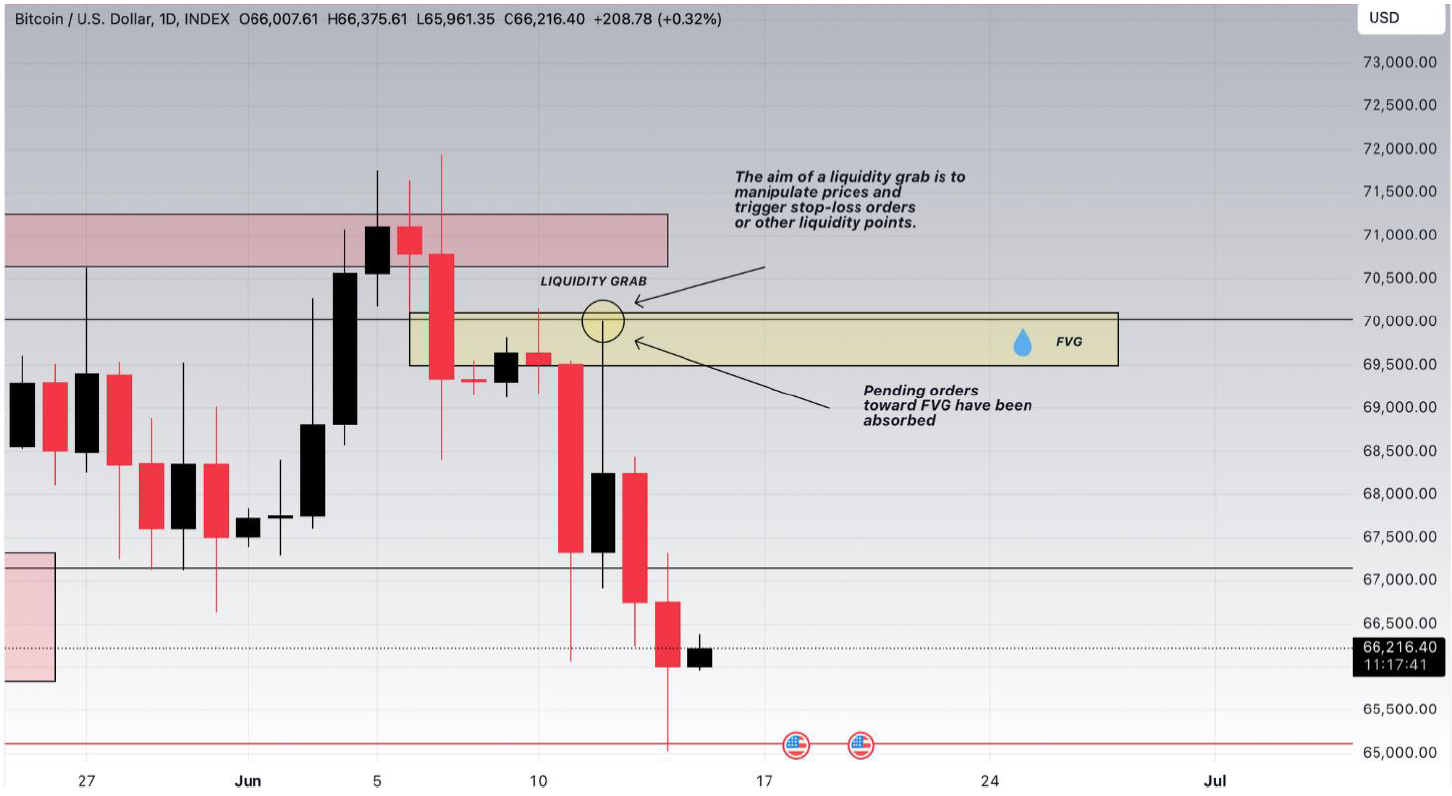
Liquidity Grab
An order block gets validated once it presents a liquidity grab before its formation. A liquidity grab is a scenario in which a rapid and substantial movement in an asset's price occurs due to the execution of a large volume of orders at a specific price level. It often occurs at stop-loss orders placed by traders to limit potential losses. When orders trigger simultaneously, they cause sharp price spikes or drops.
Grabs occur in areas where traders expect a demand or supply zone — therefore where there is significant price action history of rejection or continuation. The liquidity grab is the classic wick of a candle, and you'll often see them occur toward FVGs.
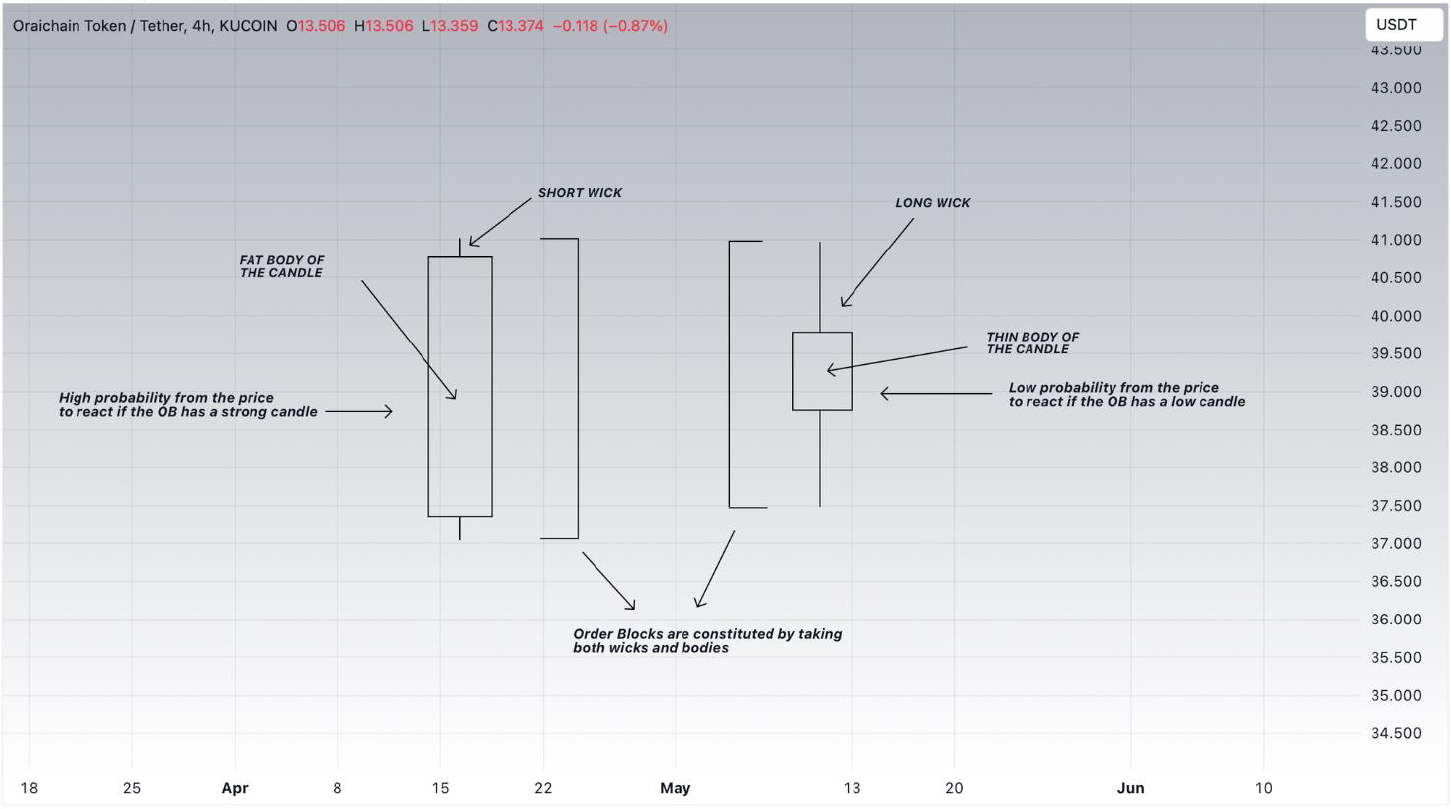
Candle Body
To make the OB stronger, search for a strong body of the candle. A bigger candle with no or very short wicks makes the OB more reliable — the impulse generated by the buyer or seller has been more violent.
A candle would still be valid, but the price could melt it more easily. Here's the representation of what you're searching for:
An order block can be a wide range constituted of multiple candles, not exclusively the last one:
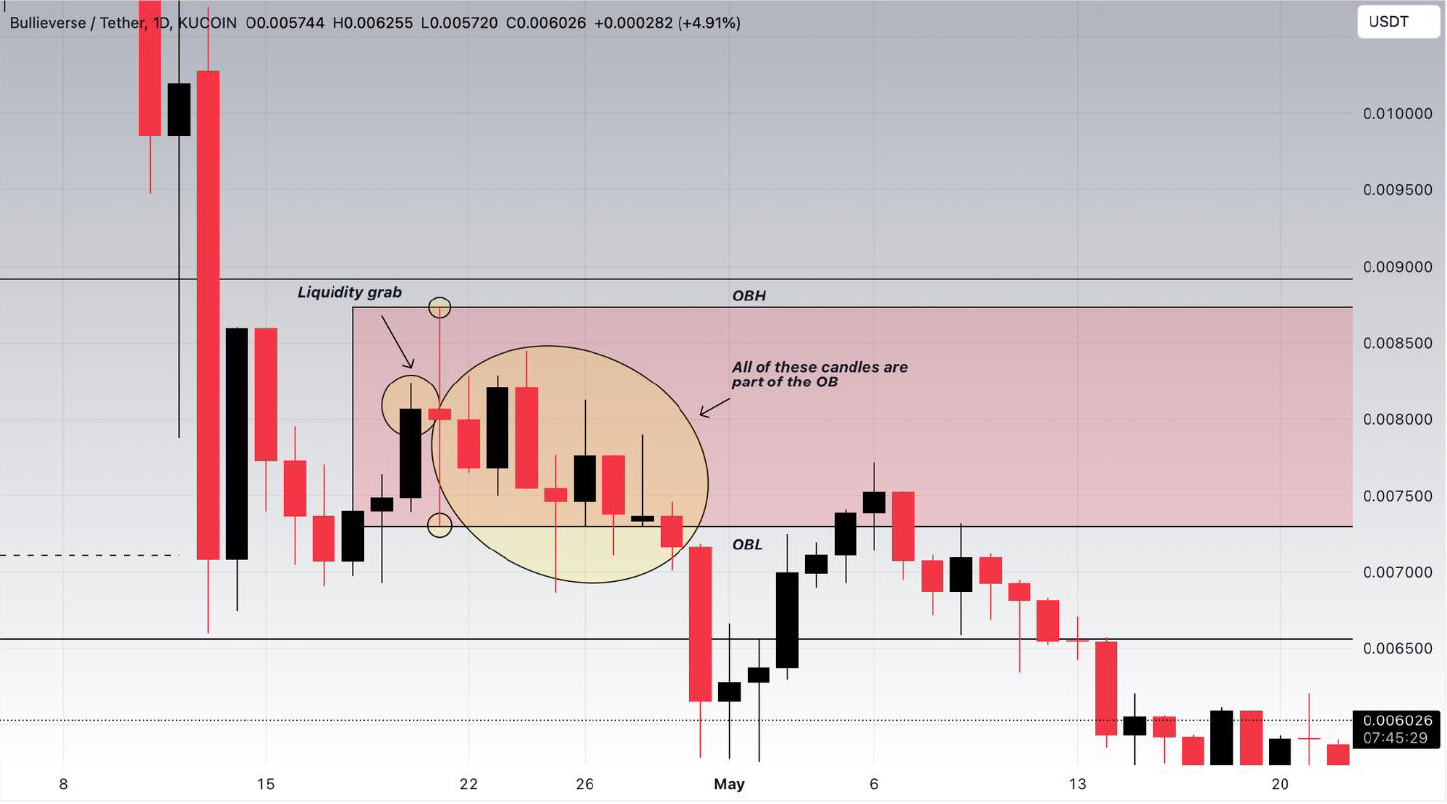
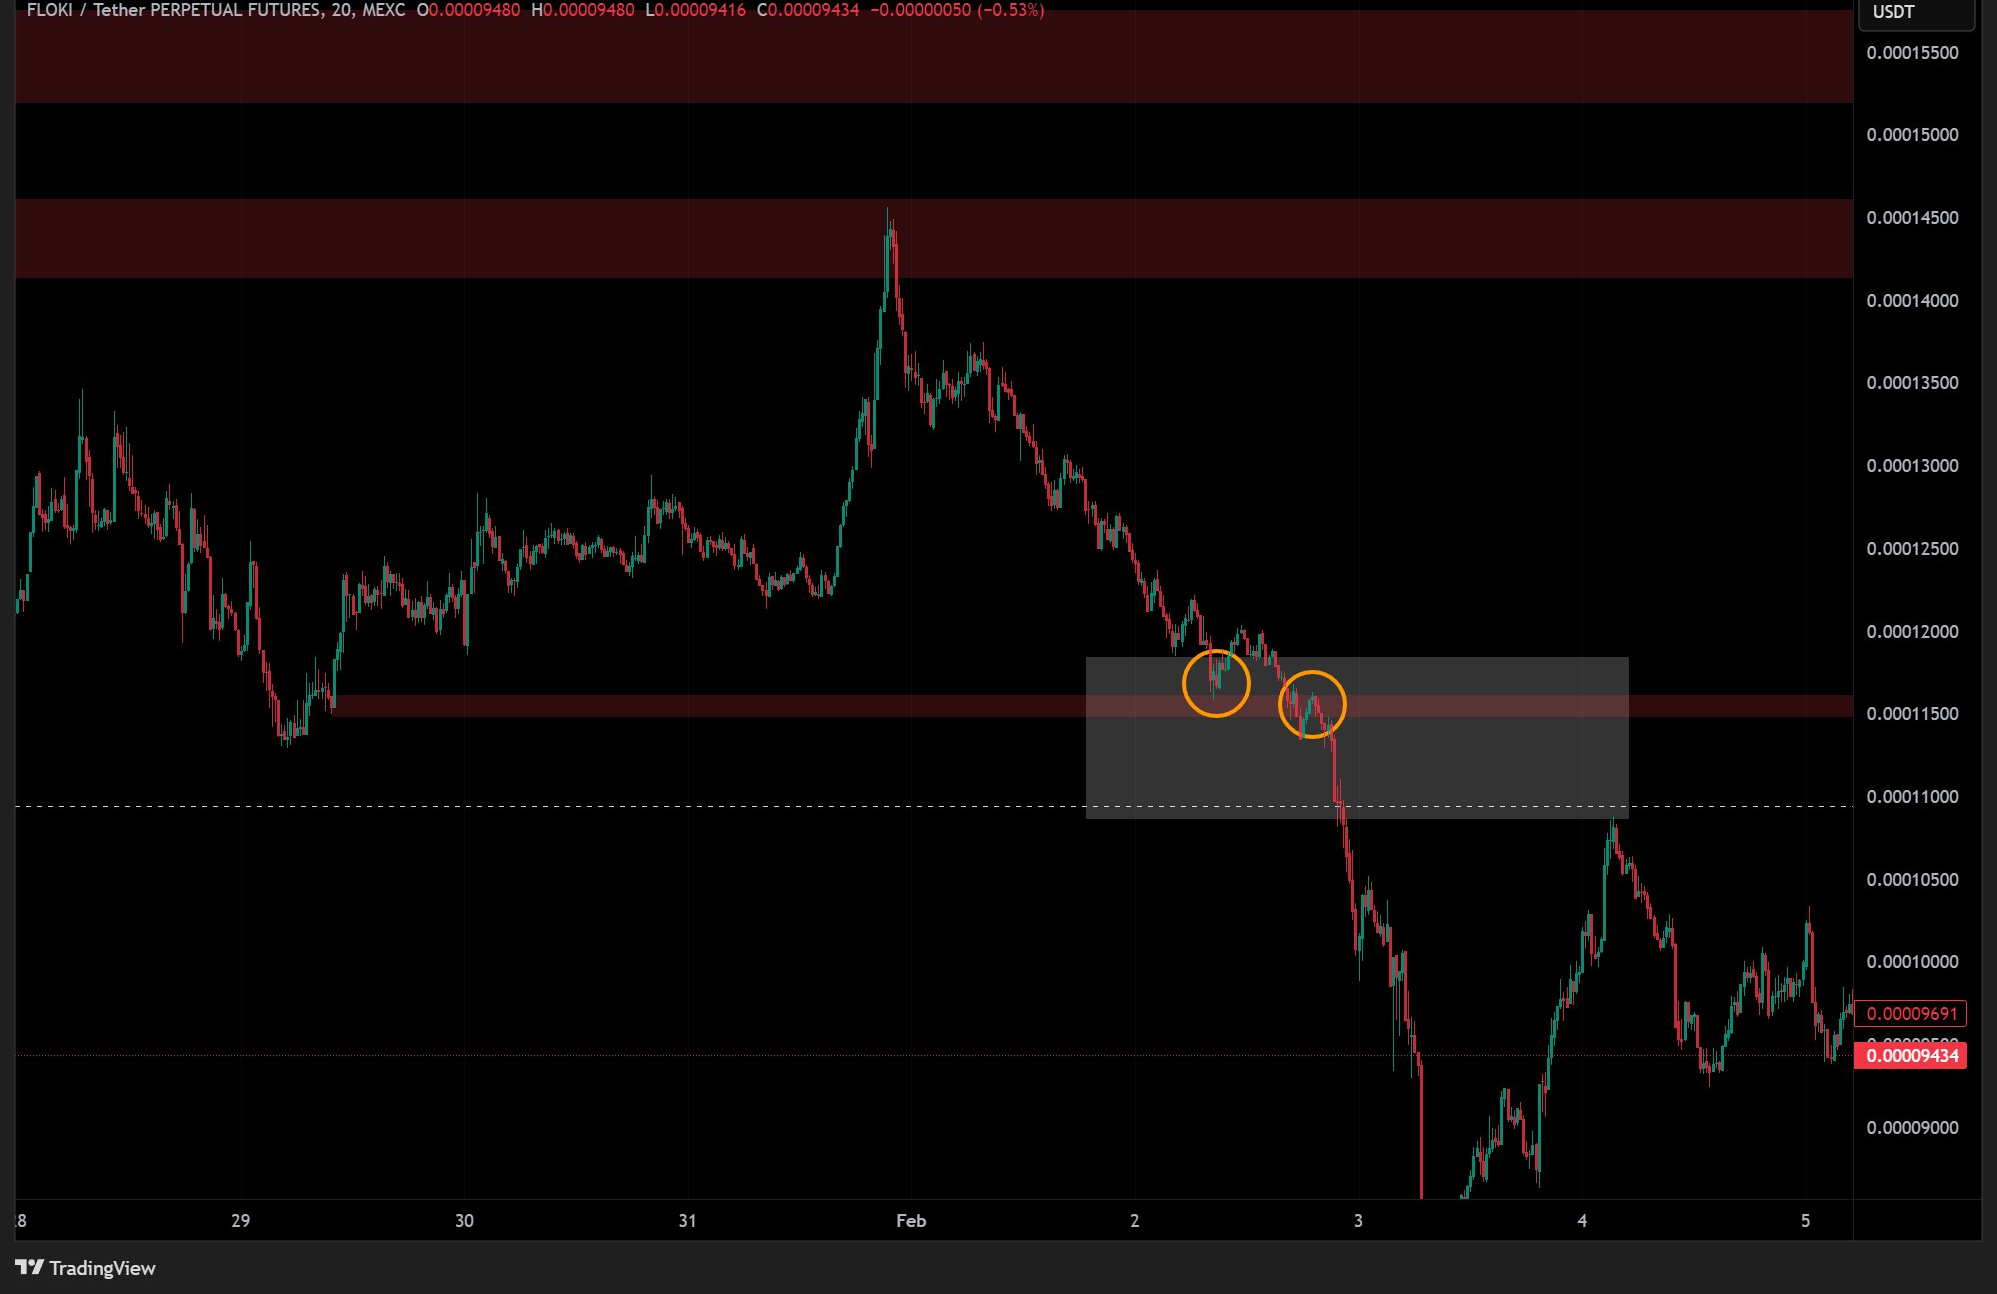
Liquidity grab followed by a candle with two long wicks (small yellow circles) which constitute the OB area. OBH stands for Order Block High, OBL for Order Block Low. Inside that OB, we can spot 7 candles — not just one. Don't reject this configuration as "invalid" because it isn't a single candle.
BOS — 🔷Break of Structure
A valid OB requires a break of structure (BOS).
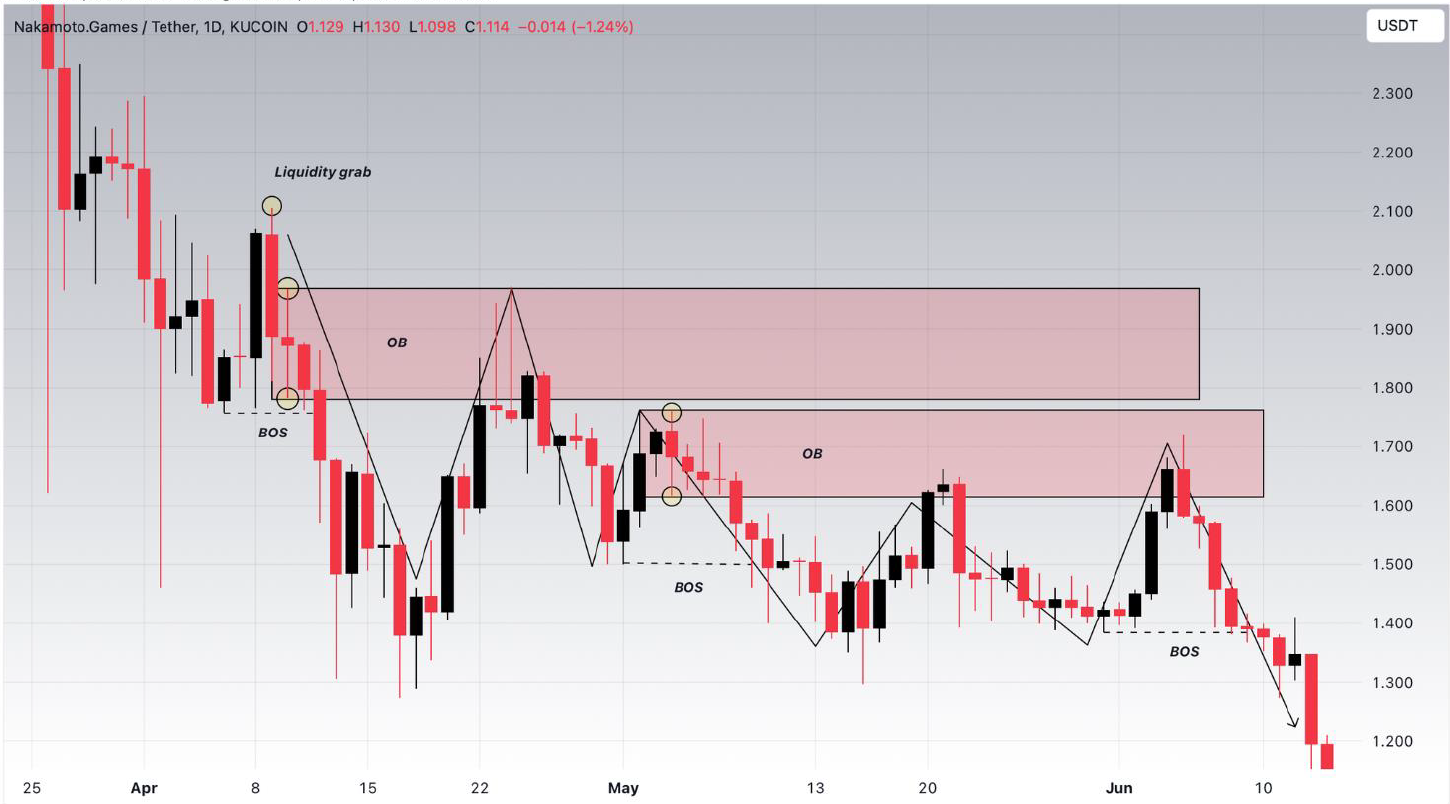
In this example, multiple BOS occur as price breaks the previous low. To identify an OB, go toward the highest origin point that generated the BOS. The wicks reach exactly toward the highest part of the first OB, exploiting these areas to push deeper and create new lows. No BOS, no OB.
Inefficiency / Imbalance
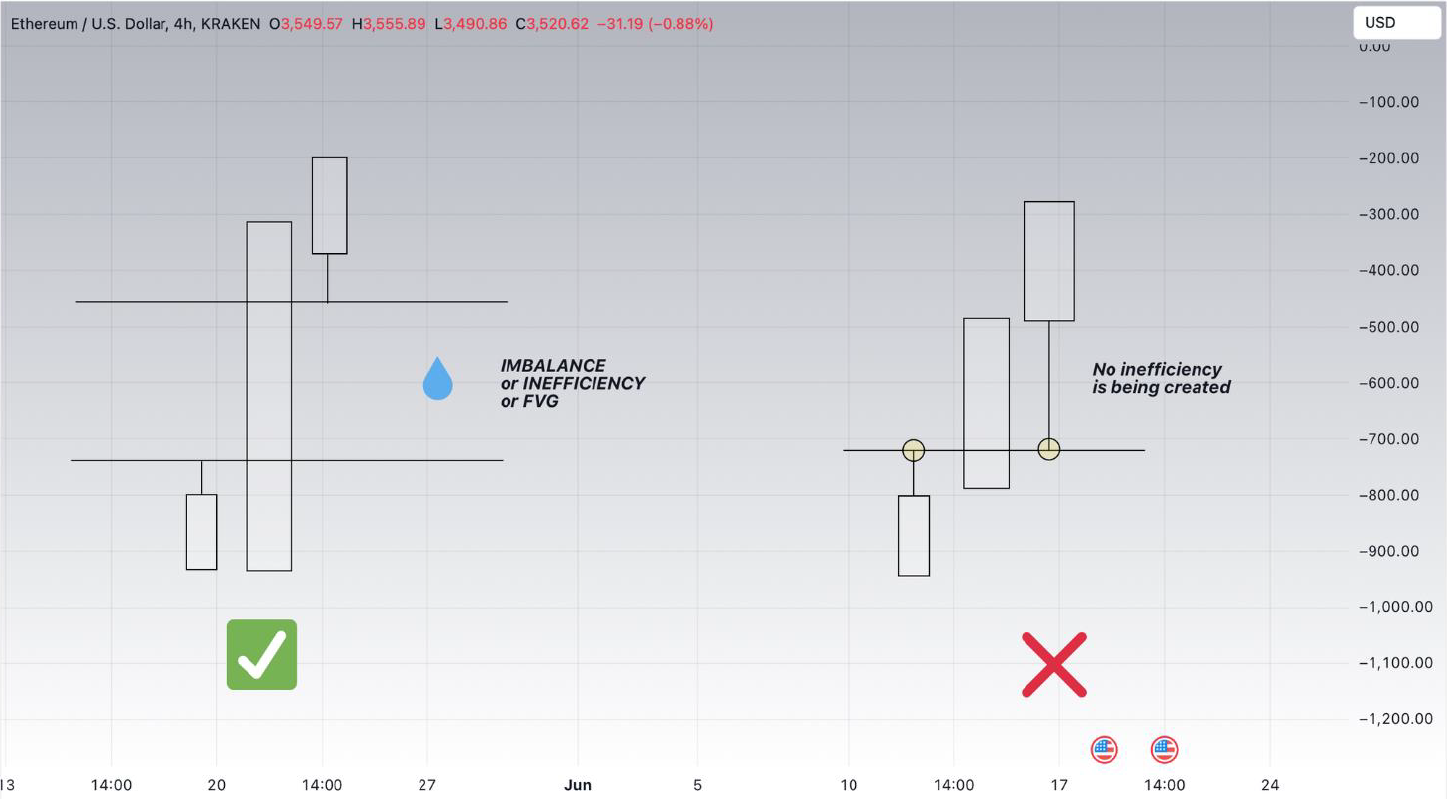
In the left configuration, the third candle doesn't wick to cover the gap created with the first candle. Liquidity hasn't been taken, the inefficiency is still present and validated. The second example shows the third candle wicking with its lowest part toward the first candle's high, filling the imbalance and invalidating it. To spot an OB, look for the first pattern.
These four conditions — #Liquidity Grab, #Candle body, #BOS – 🔷Break of Structure, #Inefficiency/Imbalance — are how you correctly identify an Order Block.
Mitigated vs Unmitigated
Two types of order blocks to consider:
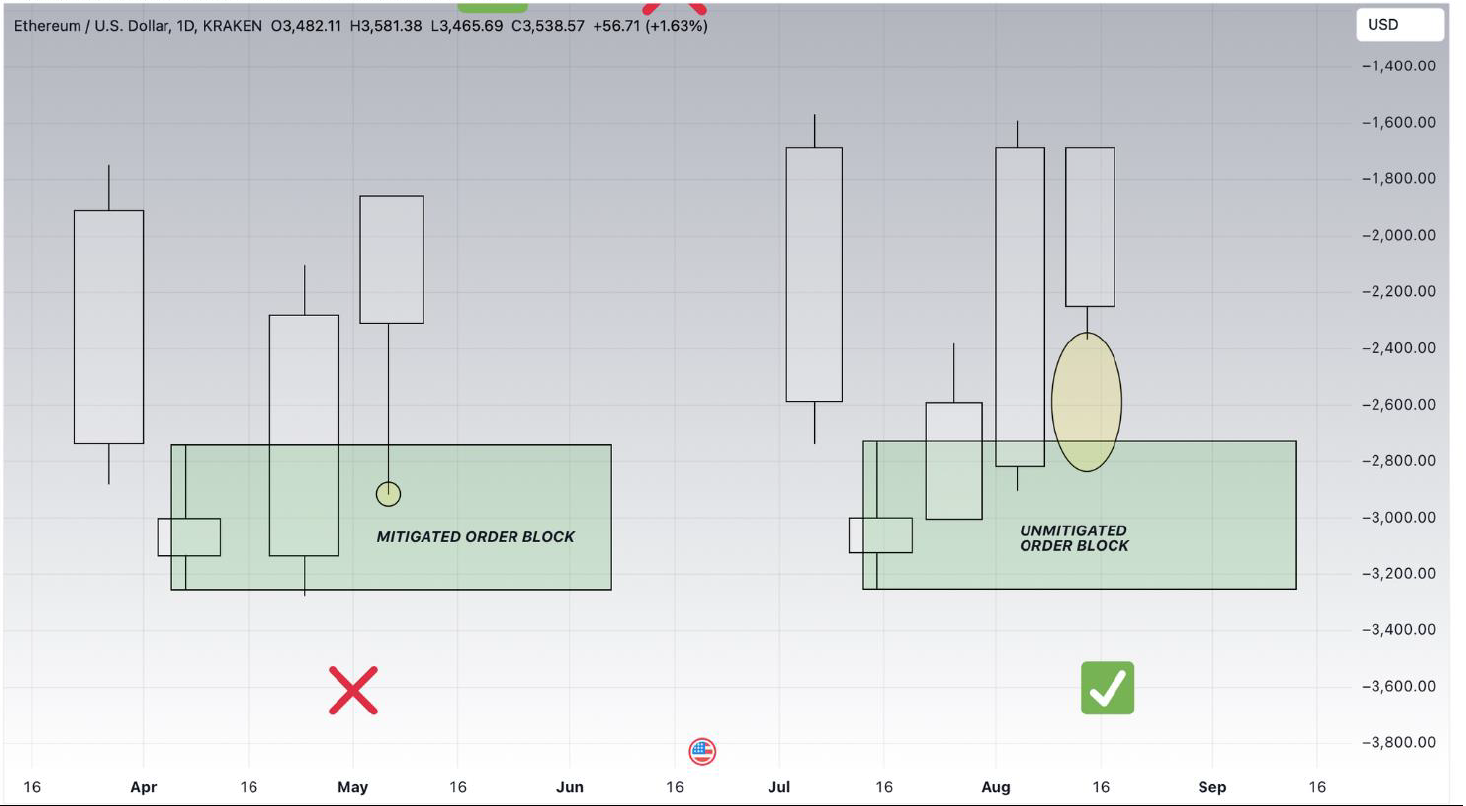
A mitigated order block has been tested by price action — price returned to the OB and orders at that level have been filled. Once mitigated, the unfilled orders that caused the initial movement are now executed. Orders executed → less probability for price to get attracted there again. This is the Partial Order Blocks territory.
An unmitigated order block has not been revisited or retested. The likelihood of seeing price revisit it increases — fresh liquidity, untested. That's why we look for unmitigated OBs.
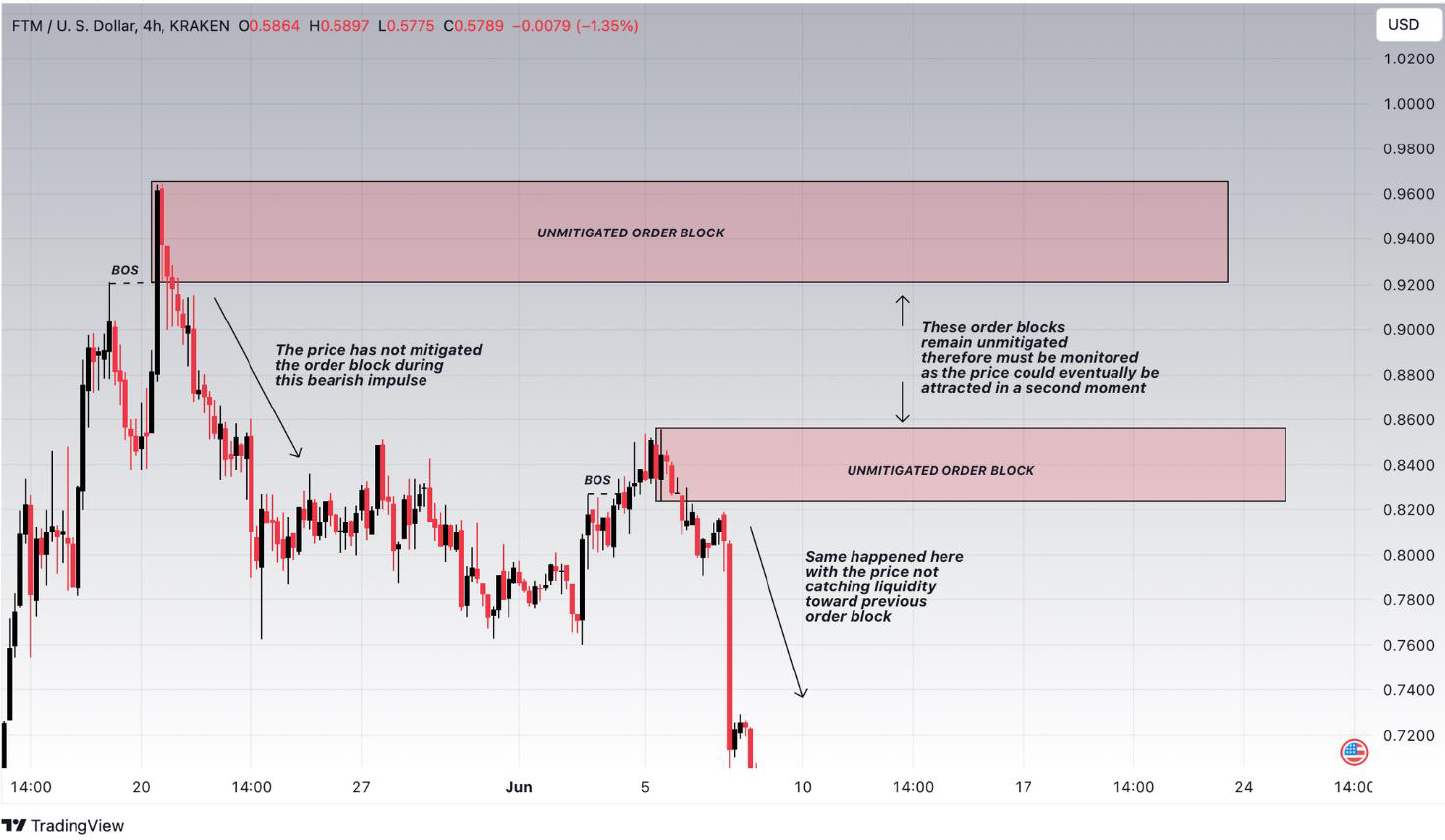
Two Order Blocks formed on the 4HR chart. During both bearish impulses, price never came back to test them. They remain unmitigated and therefore attractive.
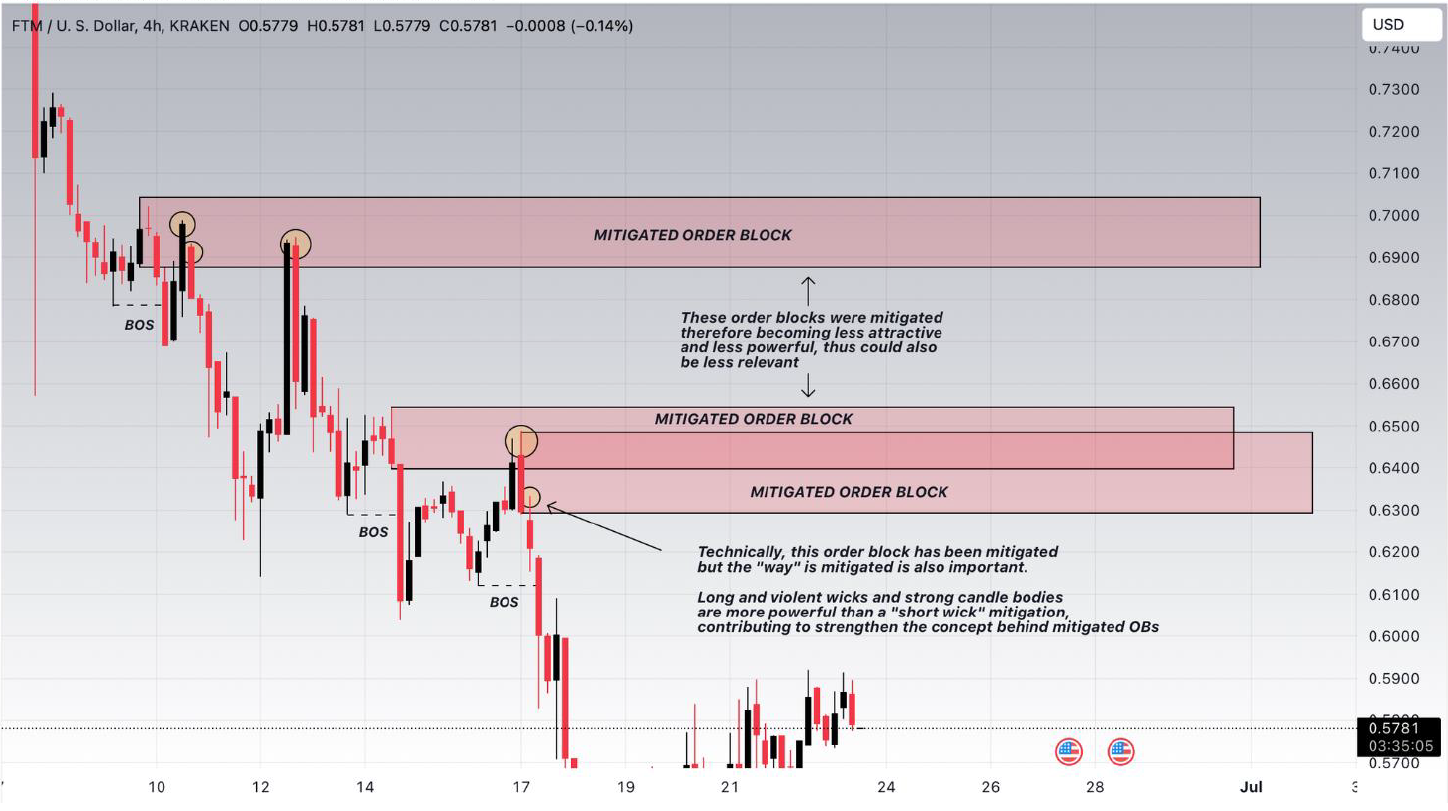
Scrolling forward in the same chart, those previously unmitigated OBs were mitigated when price came back, absorbing the liquidity needed to continue the move down.
The way OBs are mitigated matters. A small wick or a quick light touch may not count as proper mitigation, leaving the OB still relevant. A long violent wick or a strong candle body toward the OB makes it properly mitigated, reducing its importance.
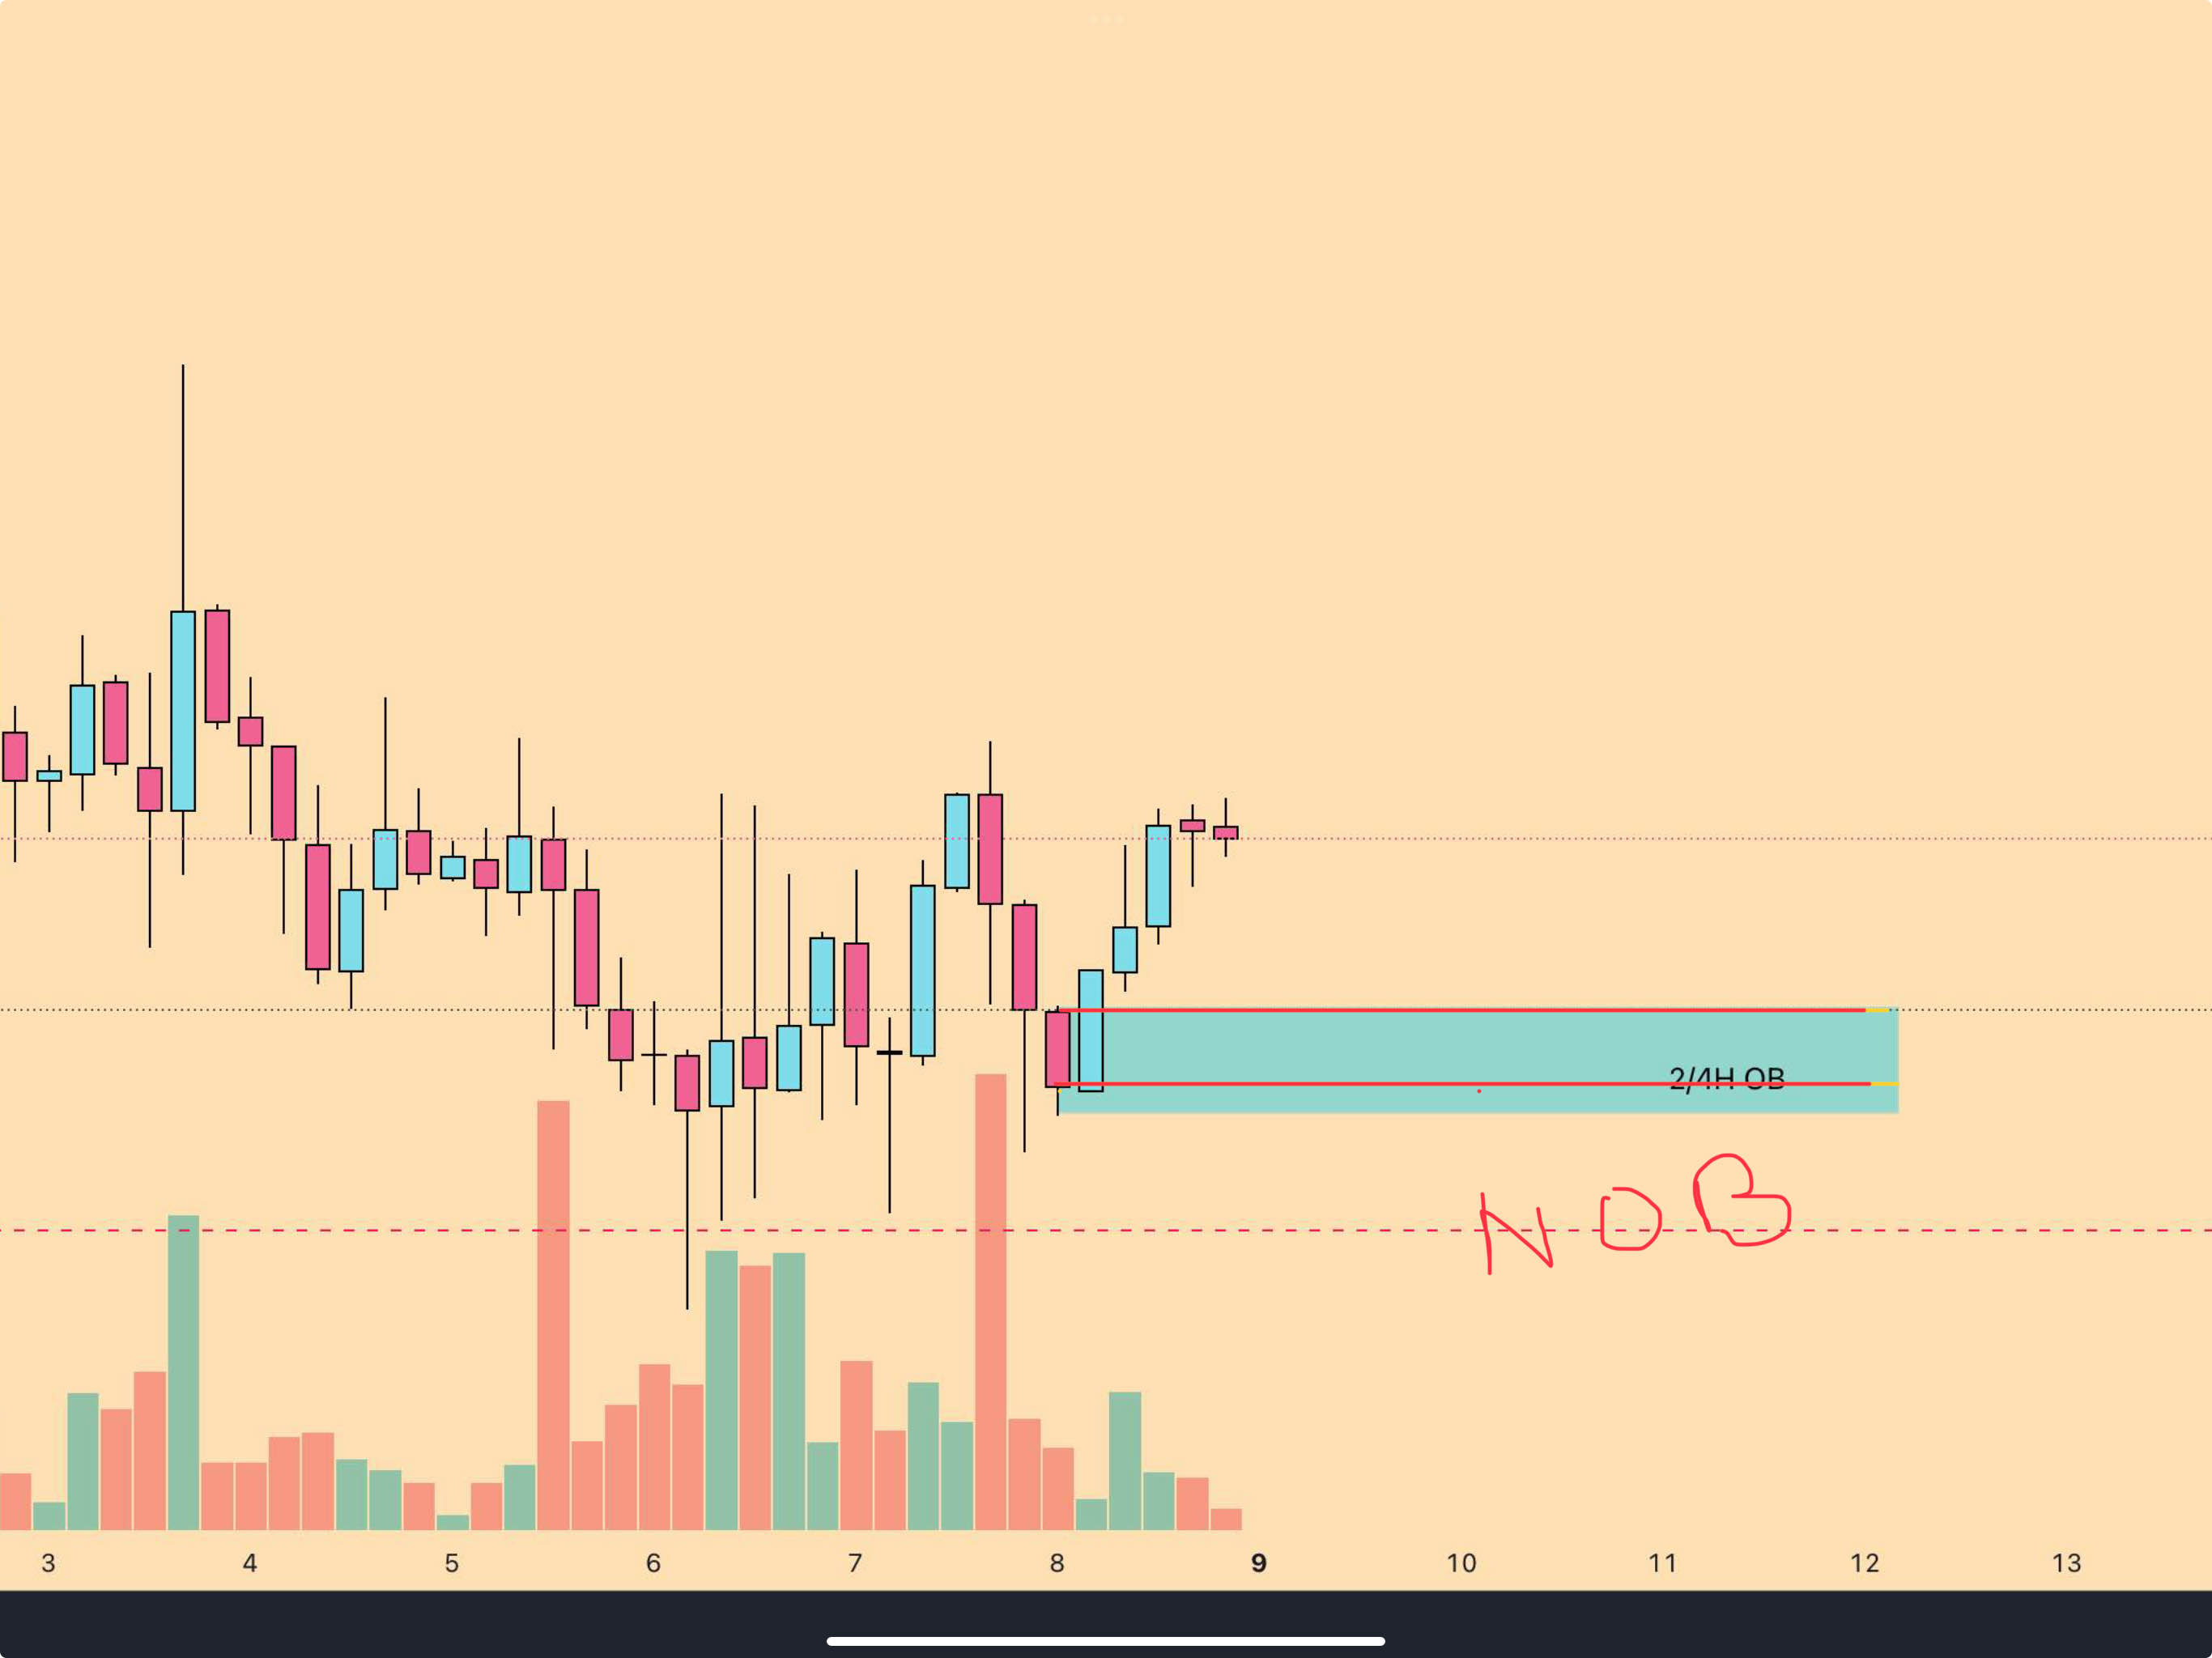
Naked OBs (NOBs)
A NOB is what most retail traders see — the standard, visible order block. No FVG hides it. It's right there on the chart, easy to spot.
Look for supply/demand orderblocks followed by engulfing candlesticks (preferably two in a row).
Note the very large red candles after the OB was created.
Supply:
Demand:
HTF blocks can be hit multiple times before a true reversal, but each hit weakens the level.
A NOB is the OB everyone can see. Bodies only — no wicks.
Examples of NOBs from chart studies:
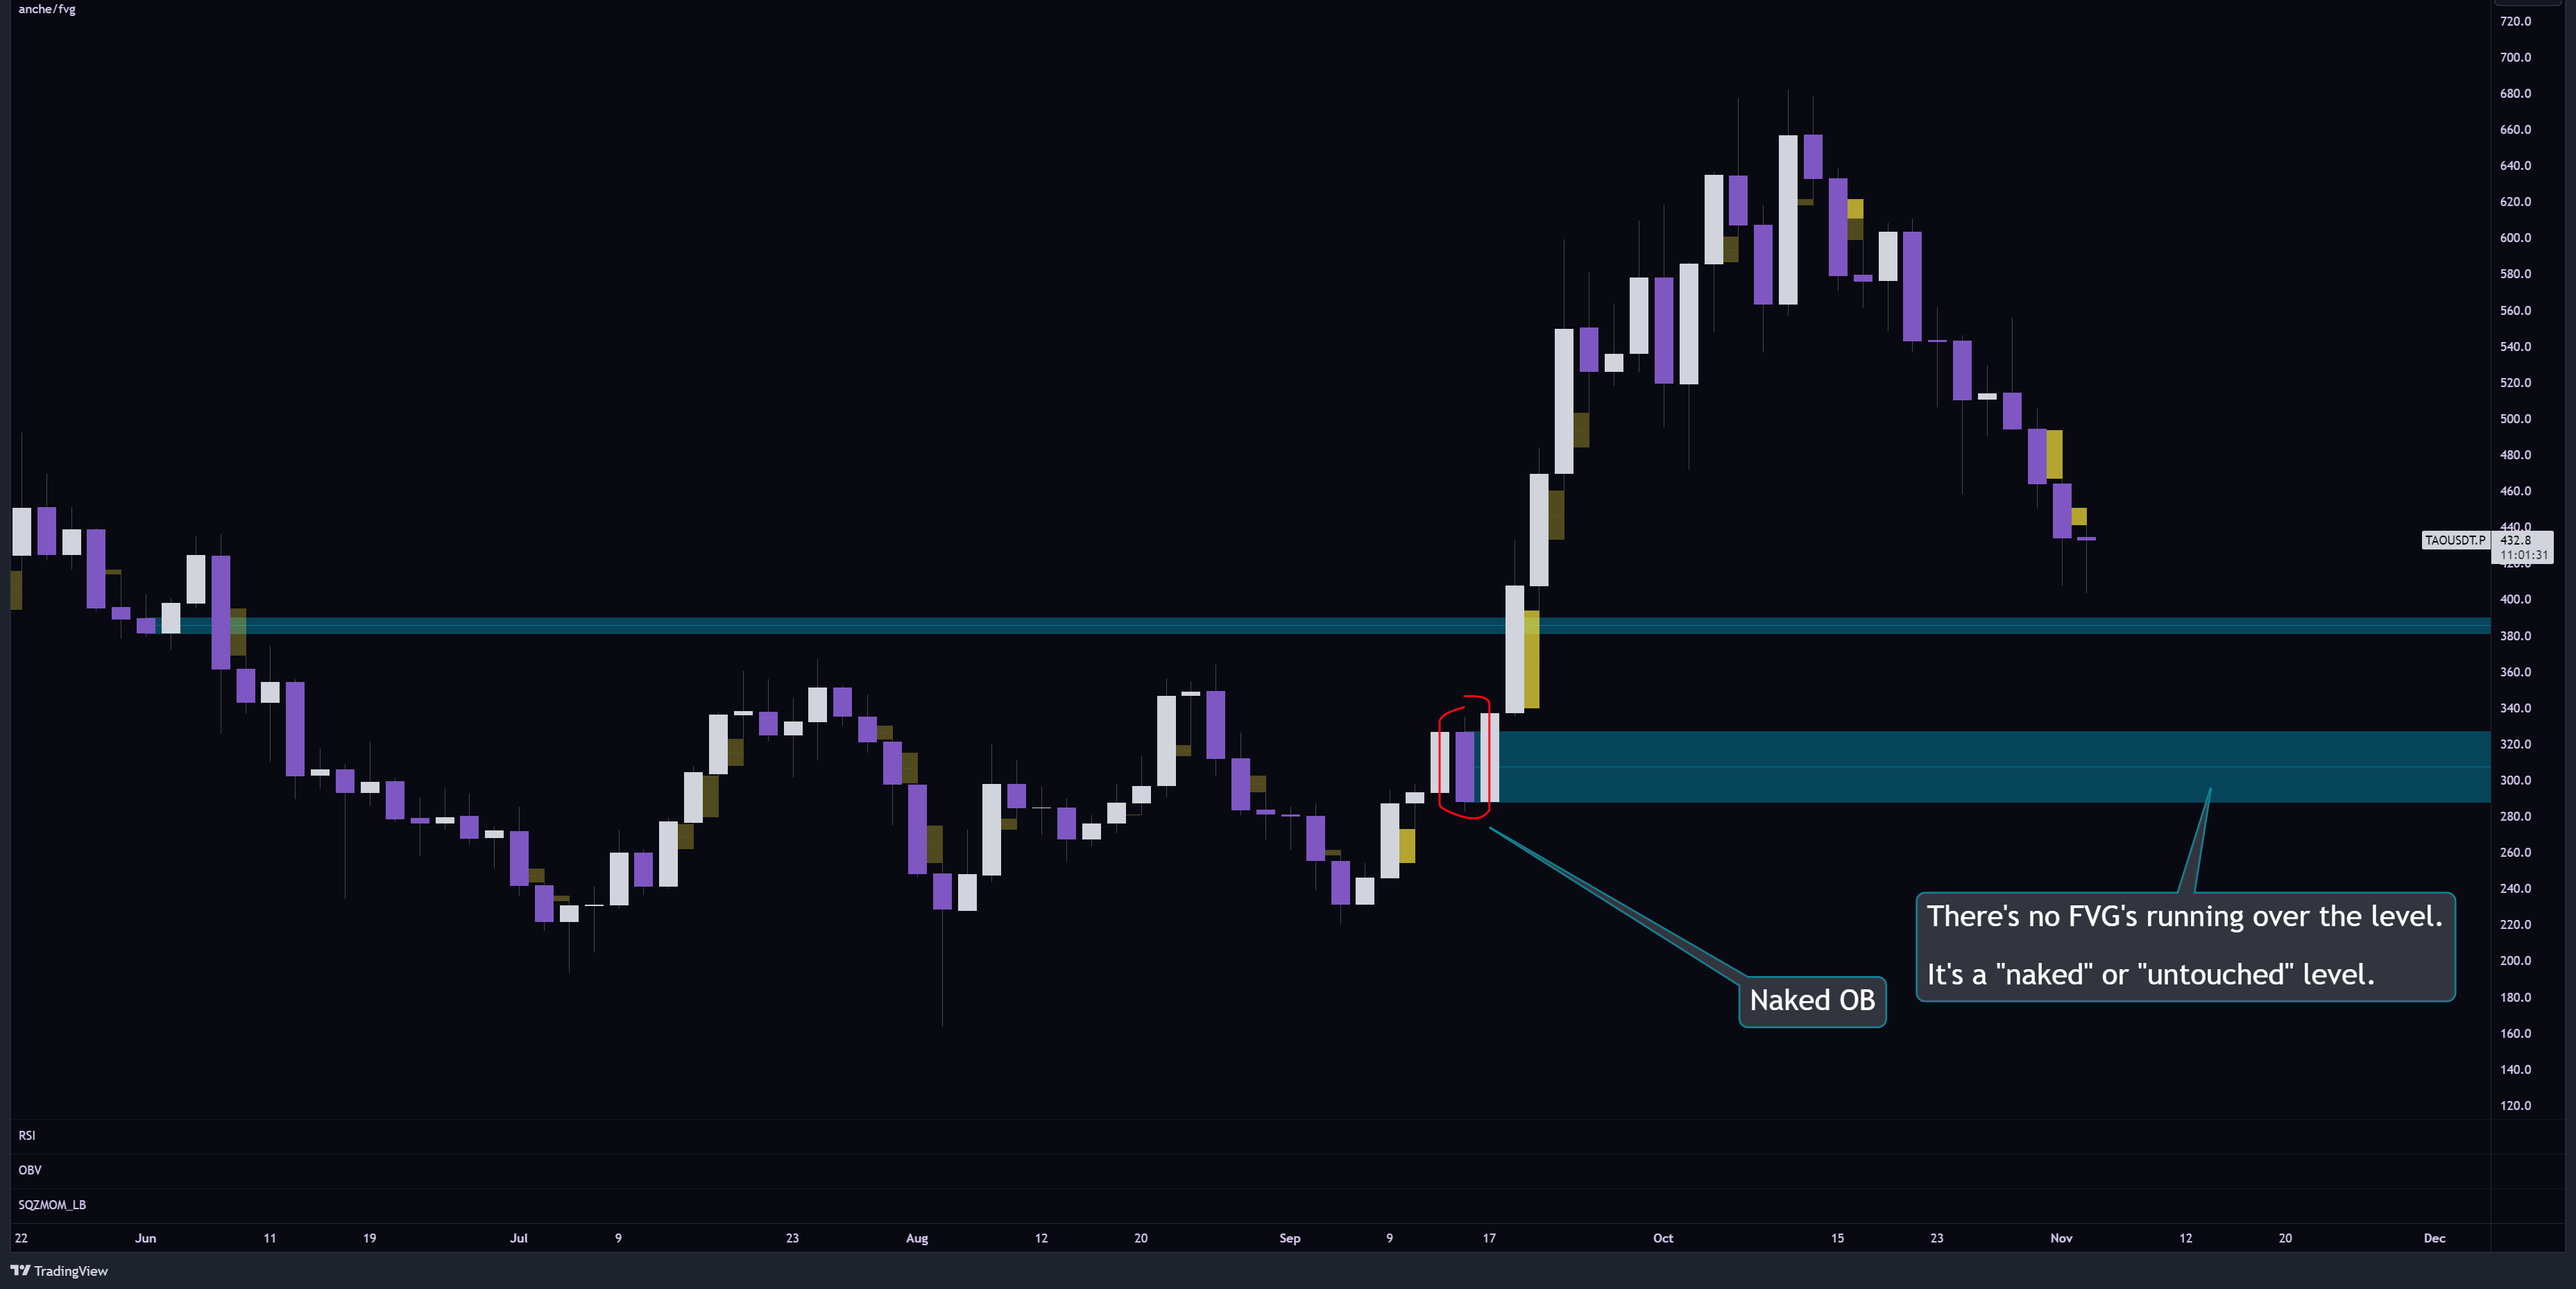
These are the most powerful HTF levels you might find when scanning charts, not yet refined:
For me I try to look at what could be wrong with each setup. Most people look for what is right with it and try to convince themselves into taking the trade because they want it to be right — instead of looking for the things that are wrong with it.
If you draw an OB and a candle has already closed over it, the level isn't hidden anymore. It would need an FVG to hide it:
When several order blocks sit on MTF, go for the "stronger" TF where there's more confluence. The .5 fib is used for wide blocks to identify the entry — small NOBs typically don't need it because they're not as powerful as fat NOBs:
Hidden Order Blocks (HOBs)
This is the concept that separates students who profit from students who don't.
A HOB = Hidden Order Blocks. Hidden meaning that FVGs are running over the OB level — which makes retail think the level is already "touched" and has lost its reversal power. They're wrong. The opposite is true.
Example of HOB:
It's one of the most important things in this game. HOBs are more powerful, more optimal, more likely to have a reversal.
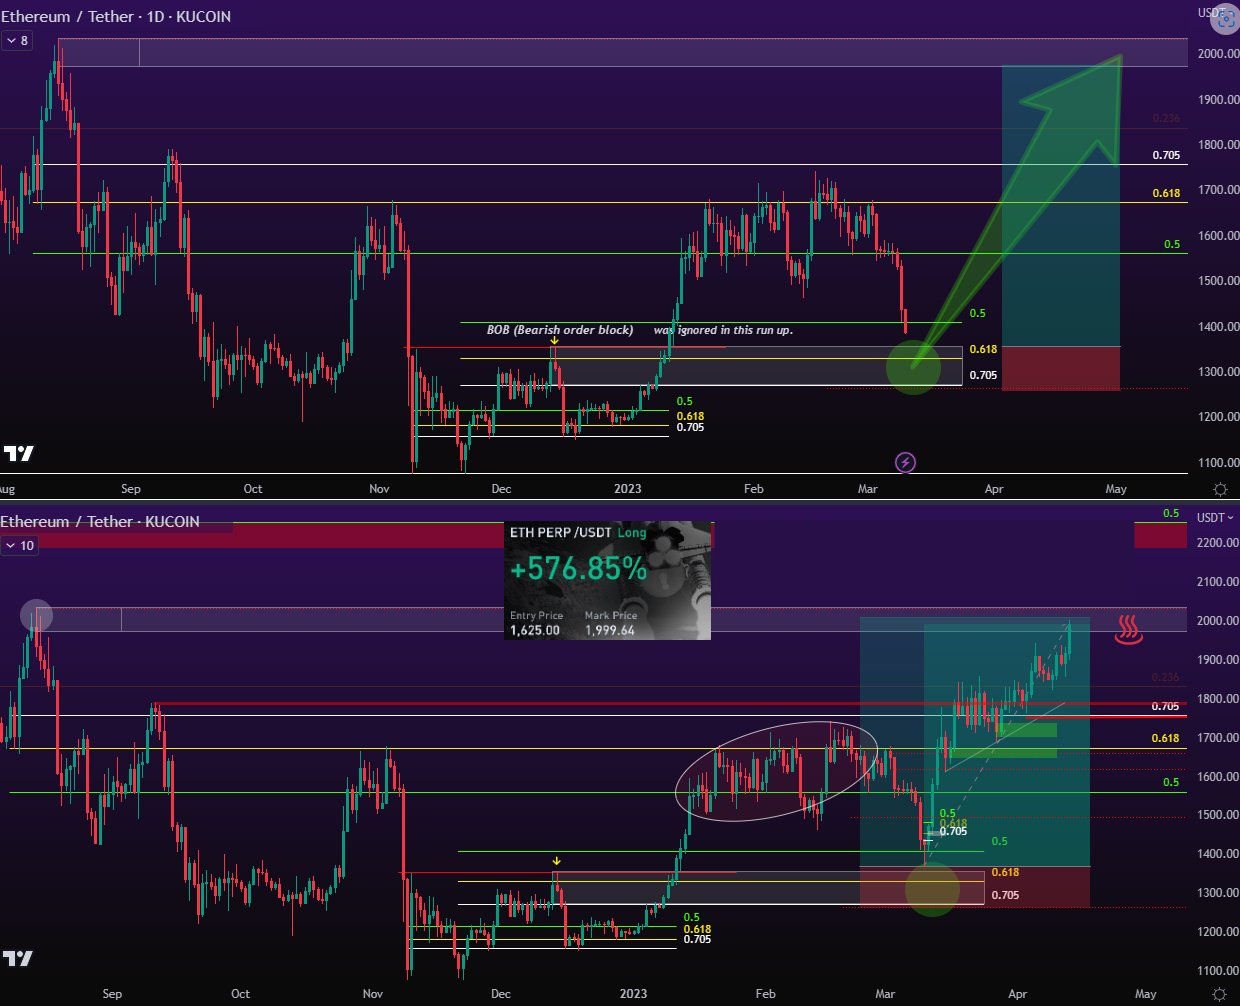
A hidden order block buried behind multiple FVGs often becomes a powerful reversal point once taken, especially when refined across multiple timeframes and aligned with a strong move targeting such liquidity levels.
This is a concept brought to light long before others started mimicking the framework.
Why HOBs Are So Powerful
Why are hidden order blocks so powerful? What are the algos doing when one is left behind?
Because everyone's been taught to look at the typical OB, supply and demand levels — and the secrets in this game are obviously not in the hands of moonboys and average retail investors.
FVGs ignore OBs, hiding them, and taking them later on levels retail can't see.
People assume success in this game is found by studying publicly available trading books and using lagging indicators. It's far from that. Everyone's been lied to.
Target 0.5 of "fresh" blocks, and don't enter on levels retail can easily find. 90% of the time they're not where market makers will reverse price. 10% they will, so retail traders can claim their strategies work — but it's a micro % of success they get, and they don't show how much they fail.
You can only be sure with traders that share the before-and-after without bullshit.
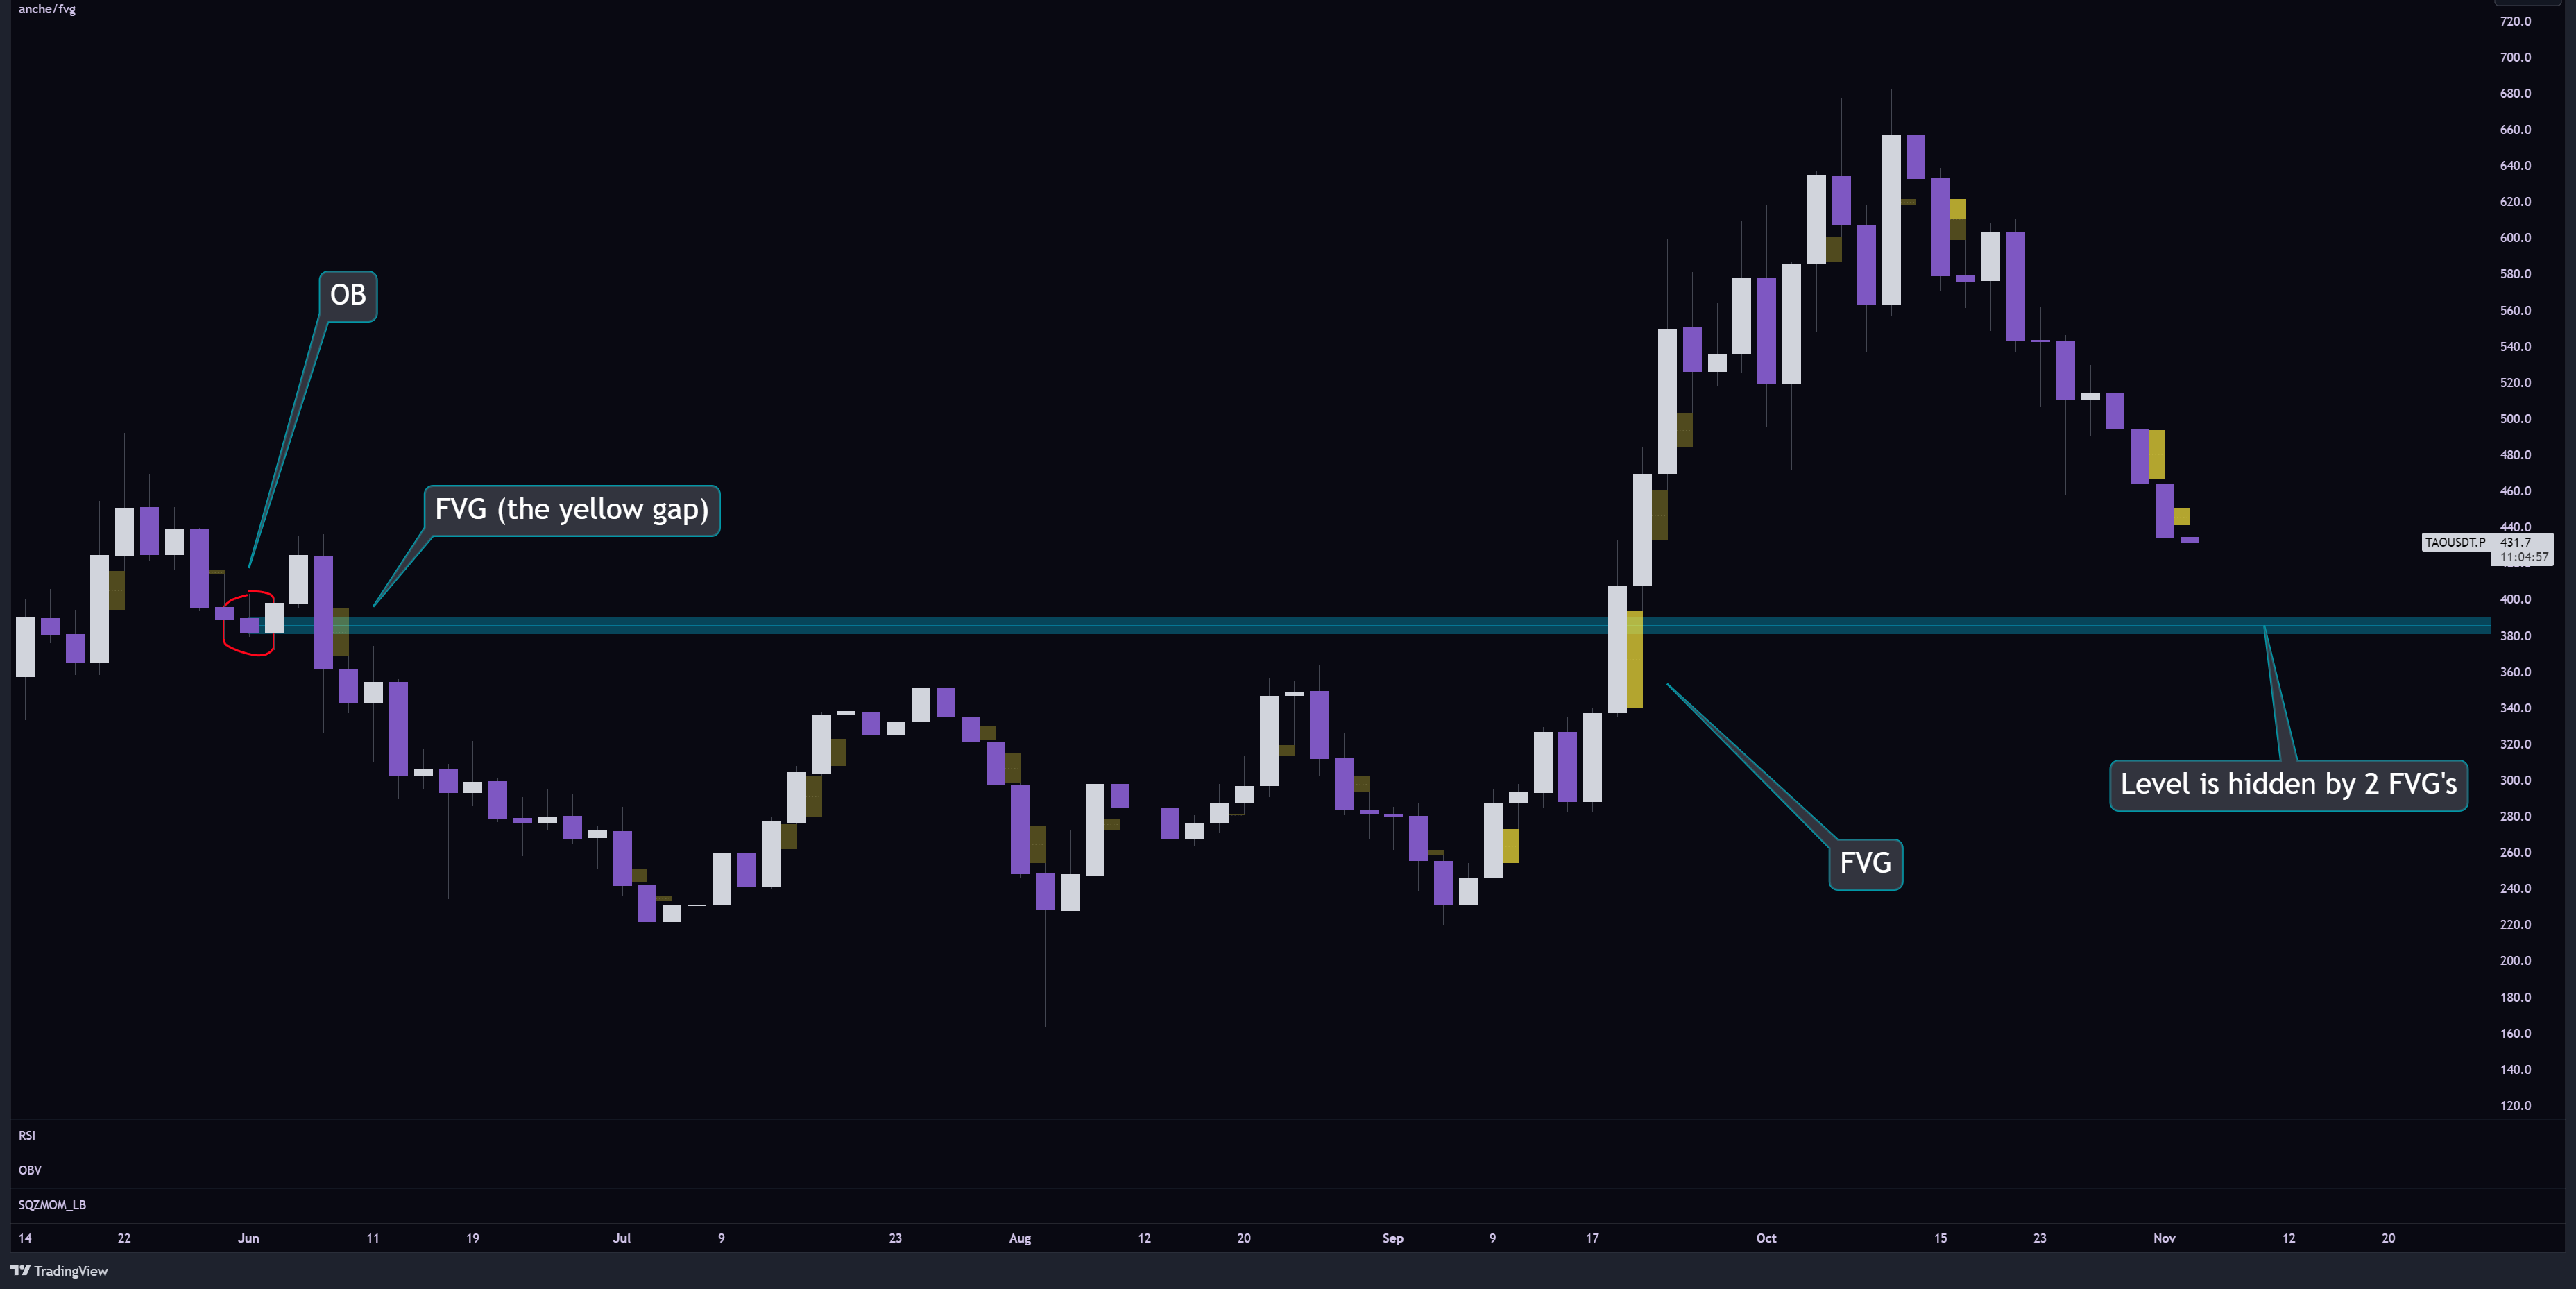
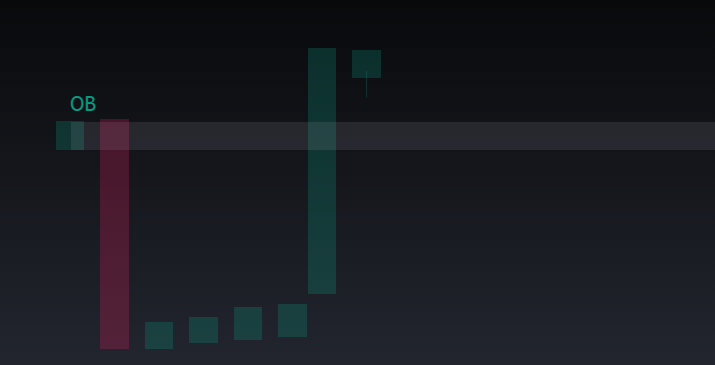
This single chart explains the concept clearly:
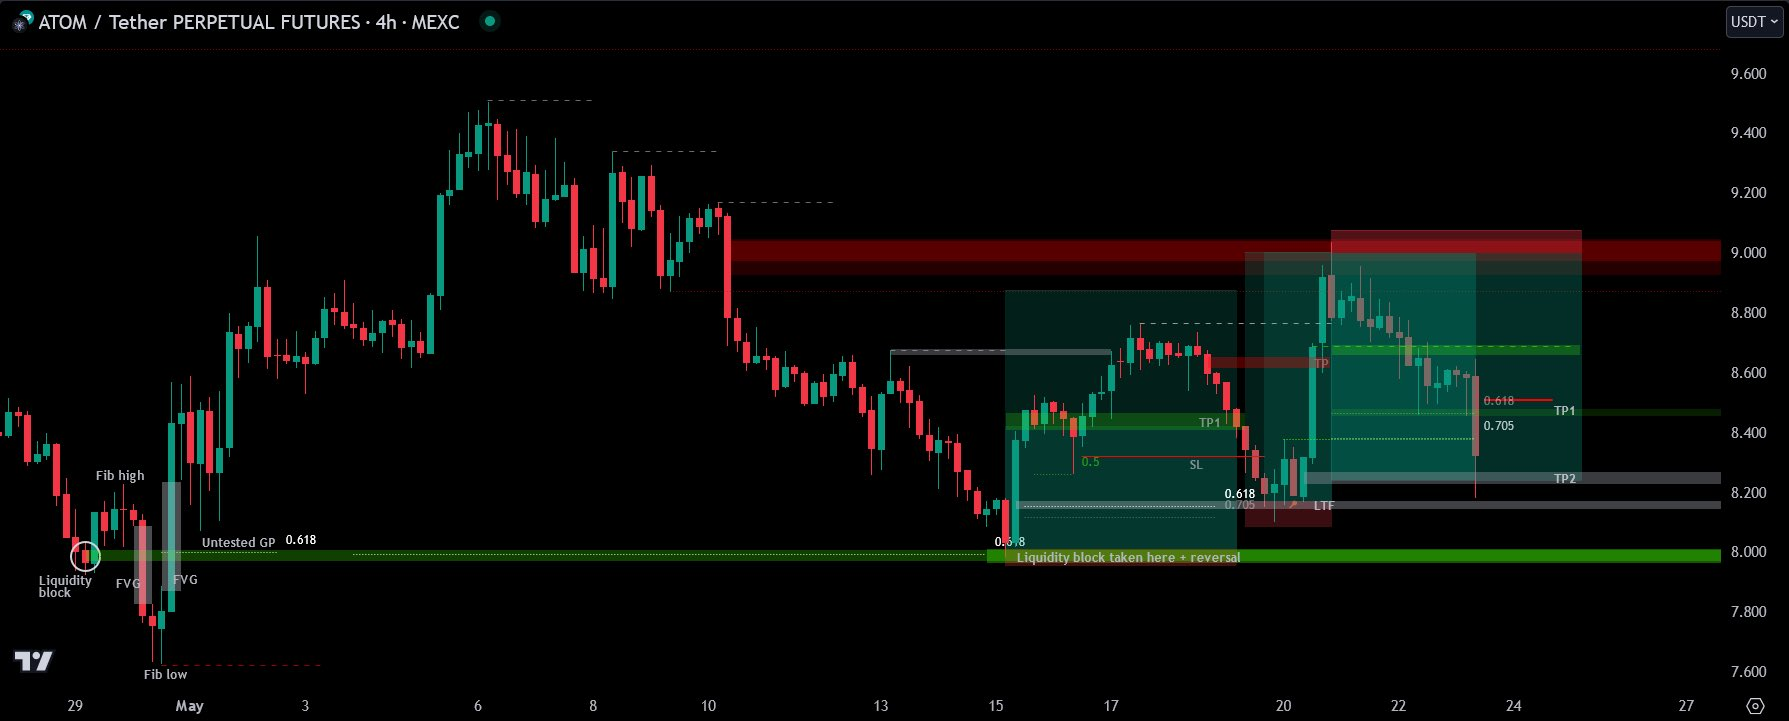
The "liquidity block" on the very left is a breaker block (BB) behind the FVGs. The more FVGs in front of it, the more hidden the BB is, which makes it more powerful. A BB is a failed OB which flips characteristics to an opposite support/resistance level. The FVGs flipped the OB. See ATOM 🎁.
When Does a HOB Become Valid?
A HOB is valid as soon as the first candle closes above the OB, transforming it into a HOB. You don't need to wait for another candle to form a full FVG. We're looking for an OB that is hidden behind an imbalance — the imbalance is the candle that moved very powerfully (market makers manipulating price). Once the candle closes, the OB is a valid HOB, and price can drop down to suck liquidity from the newly made HOB.
It's like the market makers are front-running students.
HBAR example:
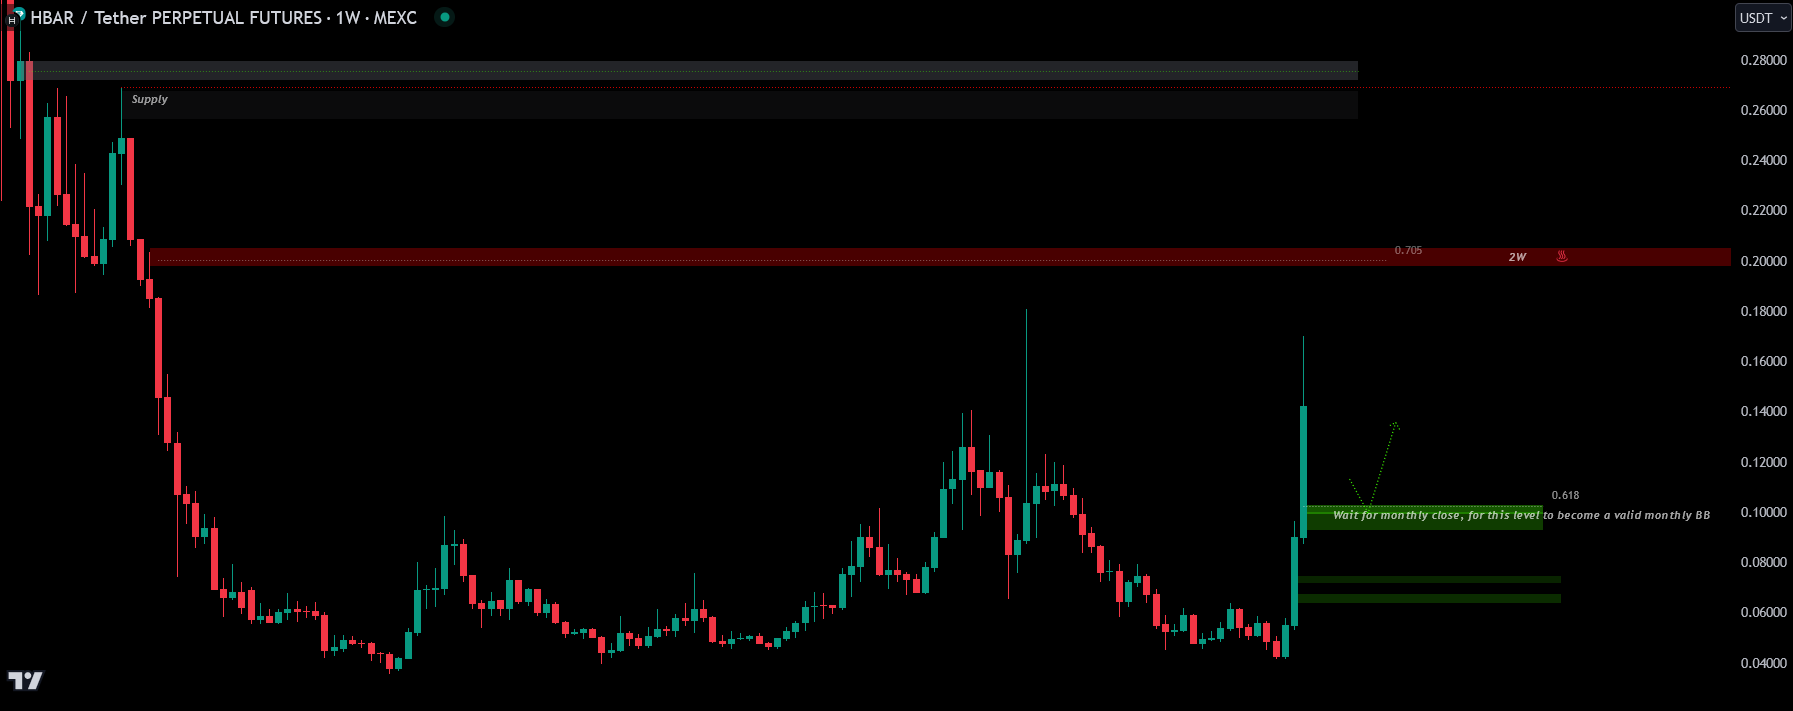
As soon as the candle making the OB "hidden" has closed, the candle creating the FVG starts reacting to the OB:
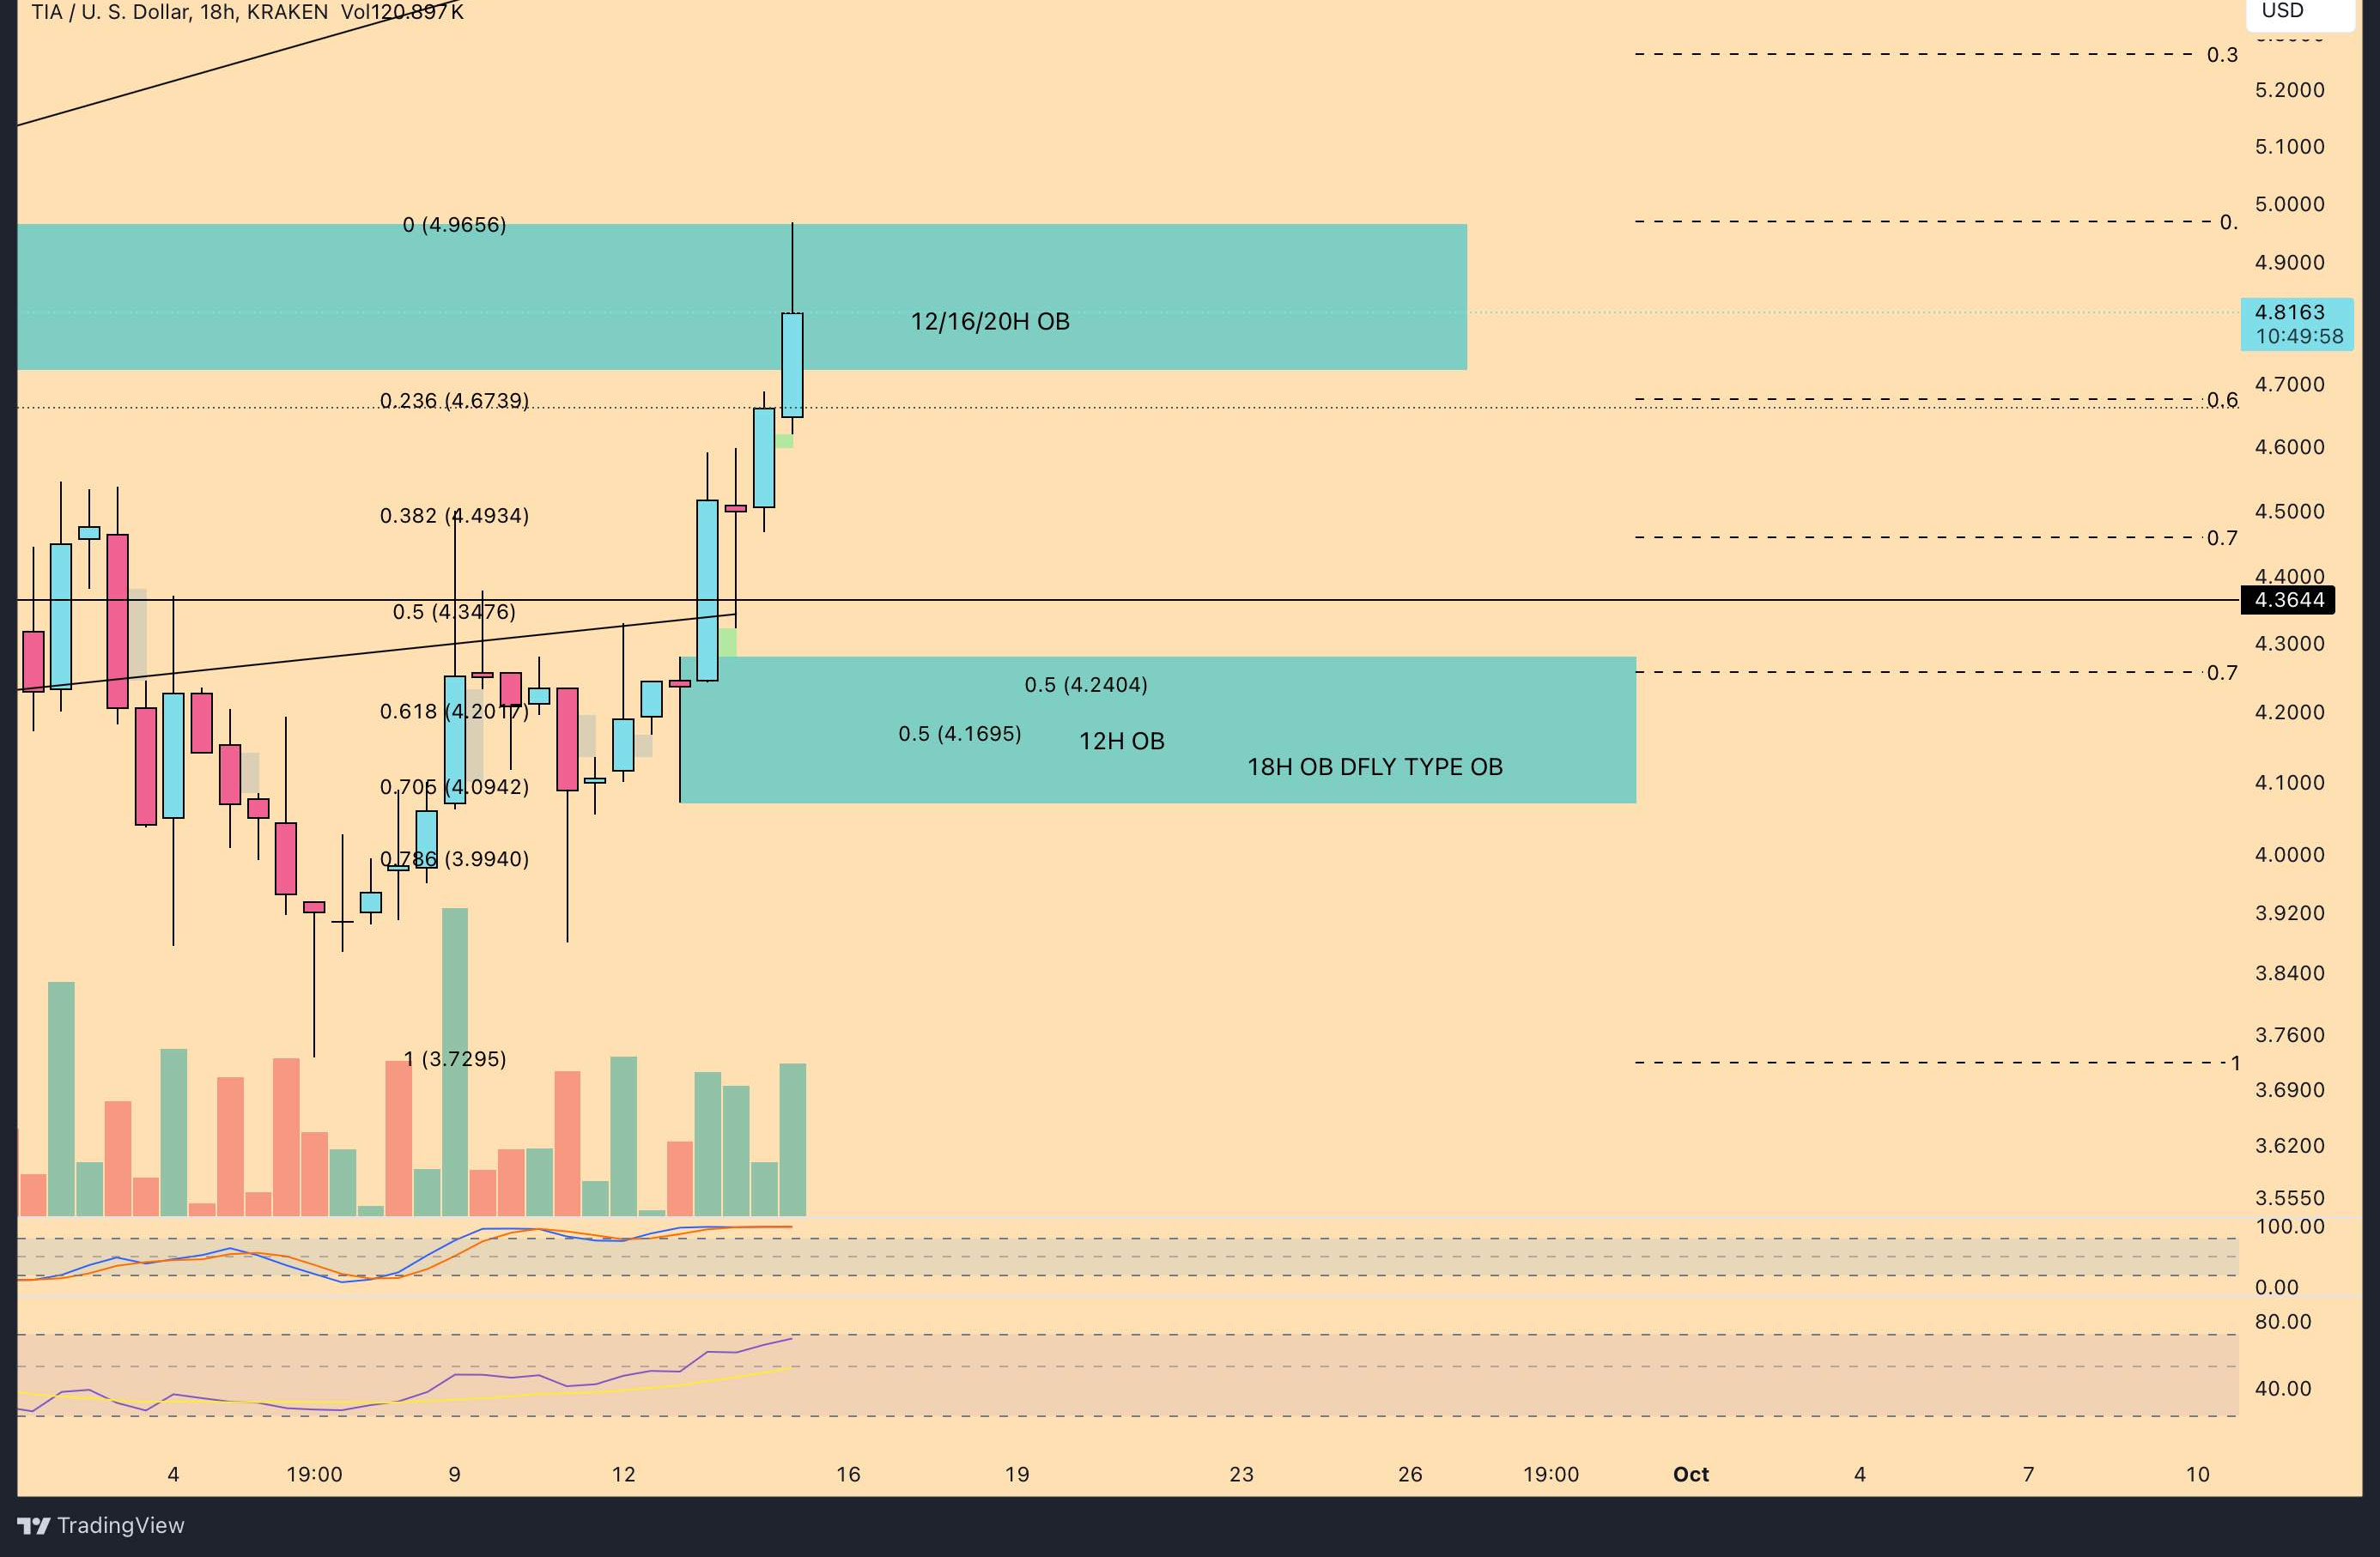
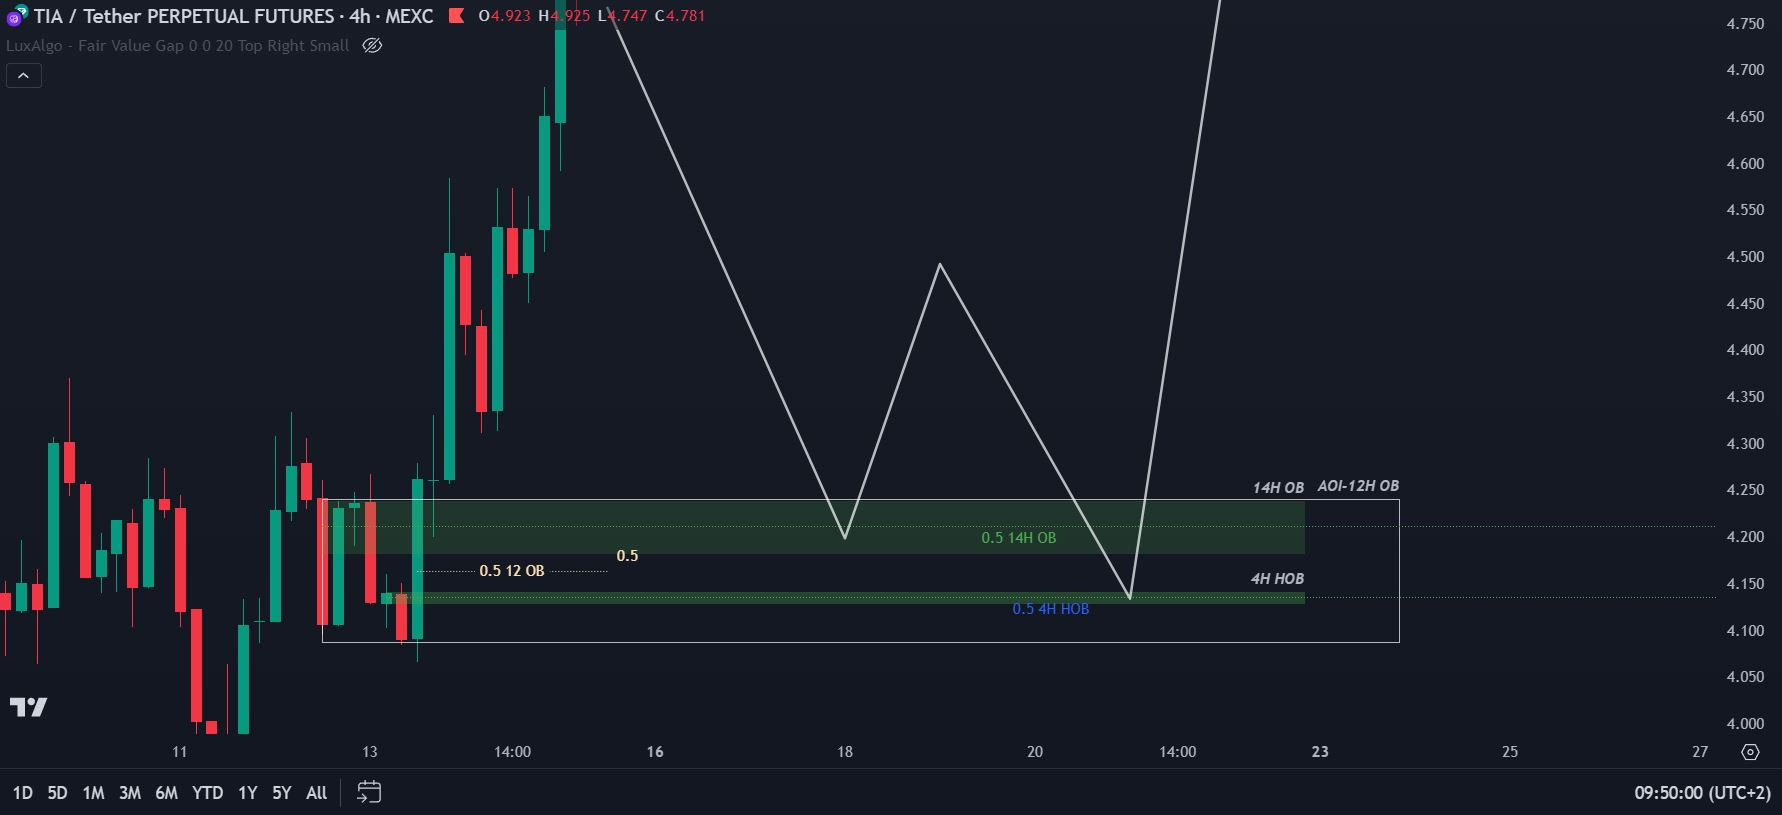
TIA example:
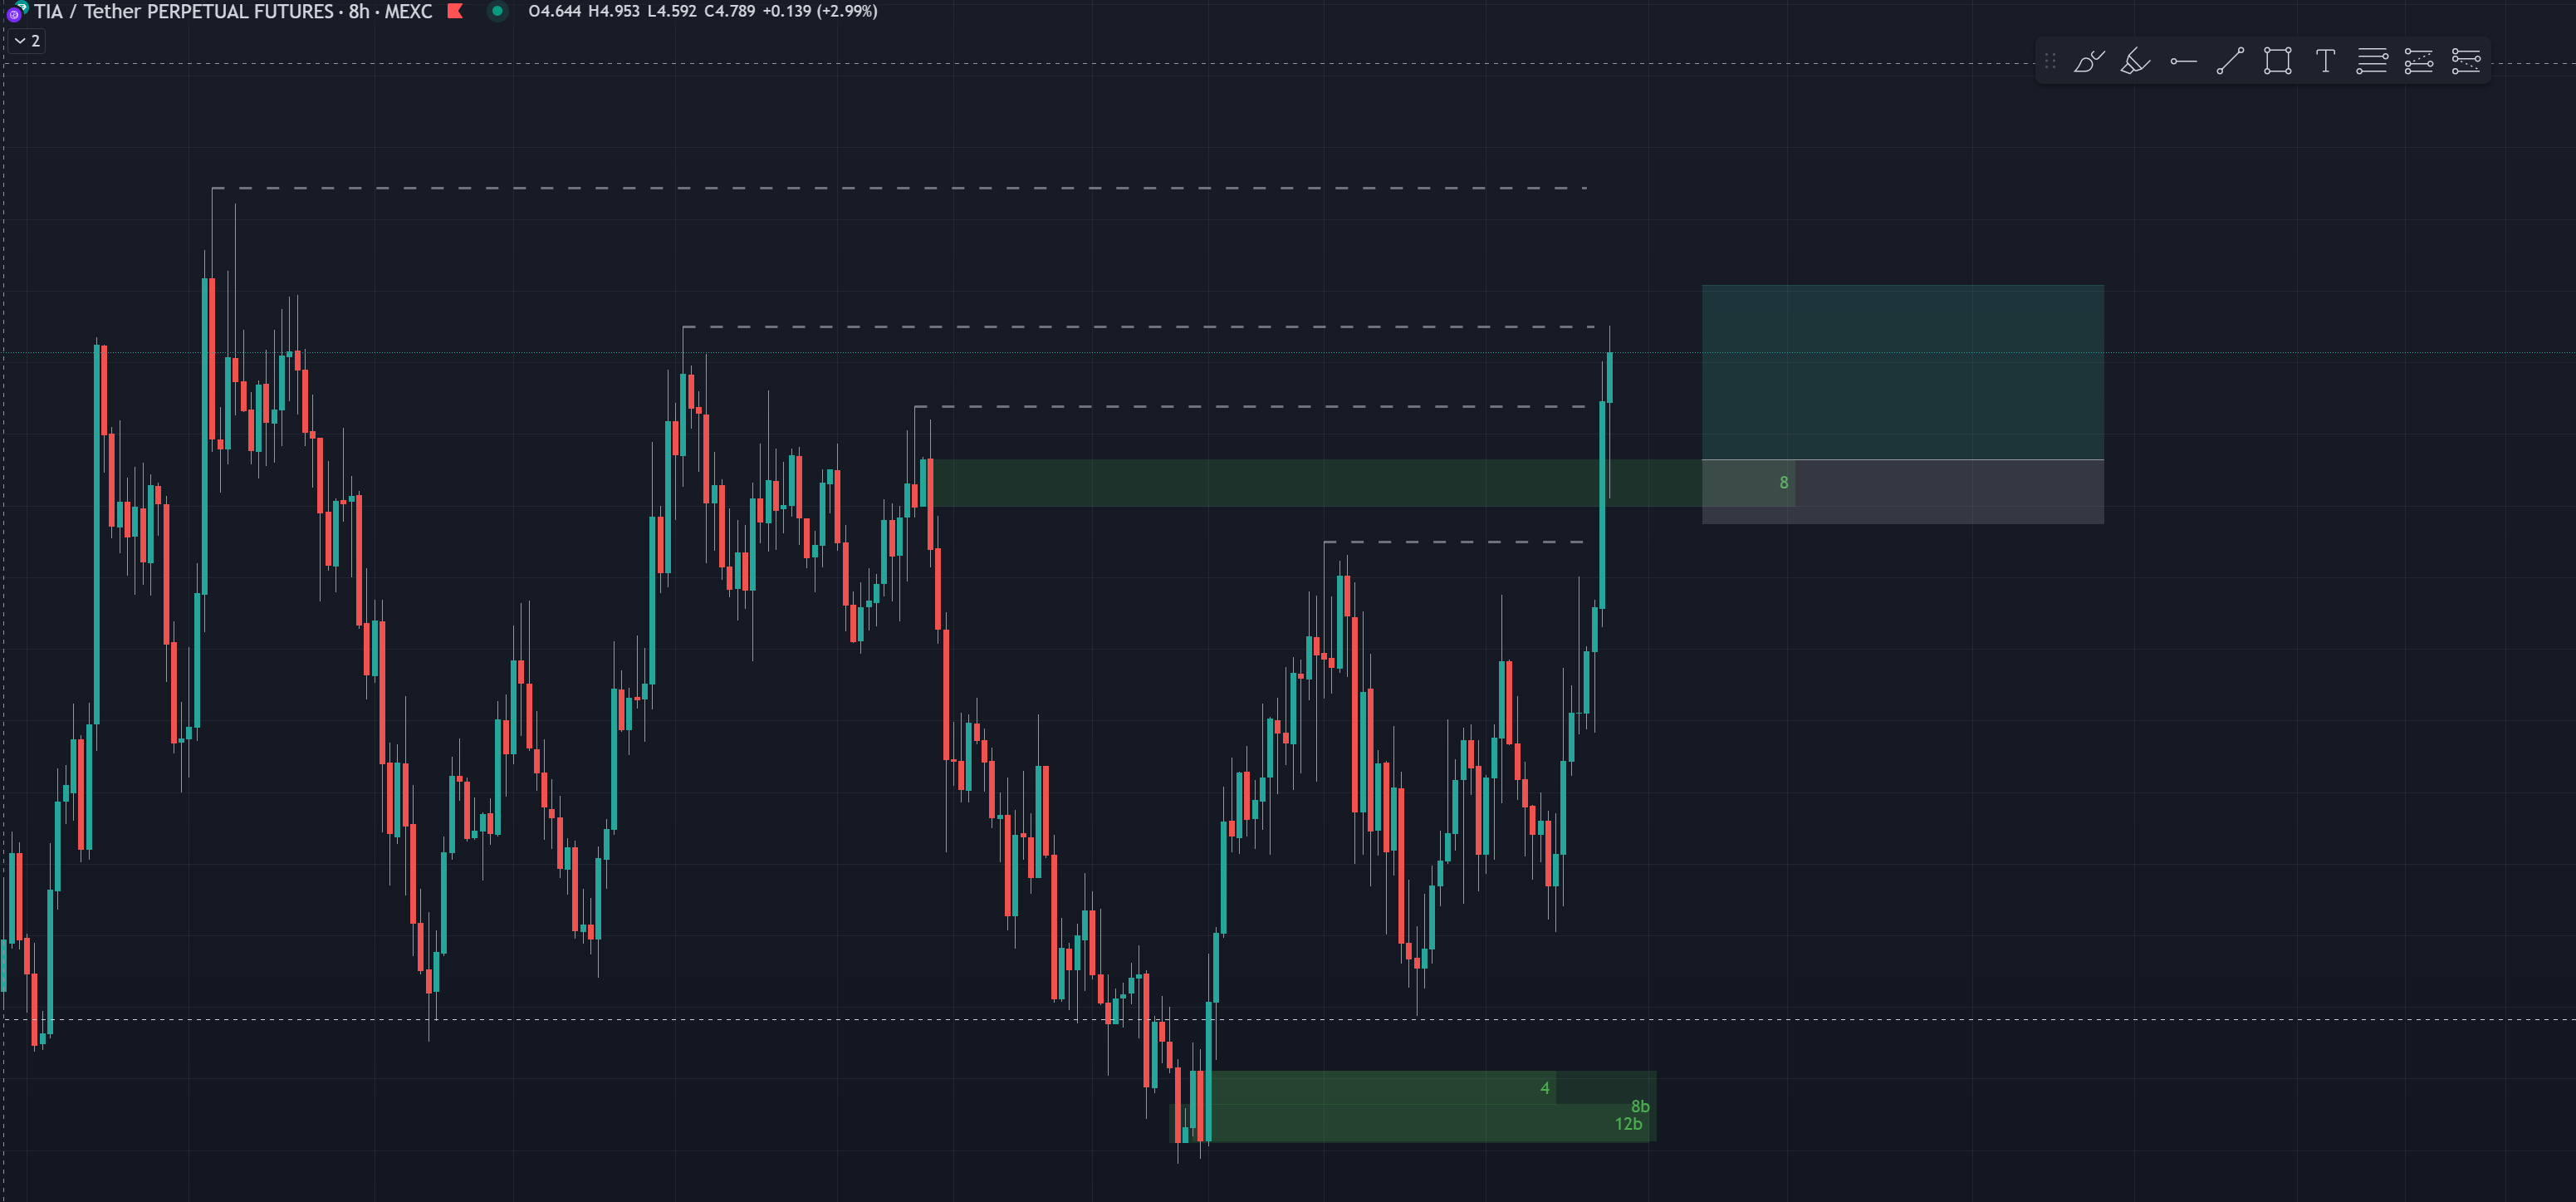
This is also why students sometimes notice that BBs without an FVG yet still give good reactions.
HOB ≠ NOB — Treat Them Differently
HOBs always take priority over OBs when it comes to entries. See 🔷Entry of Trades.
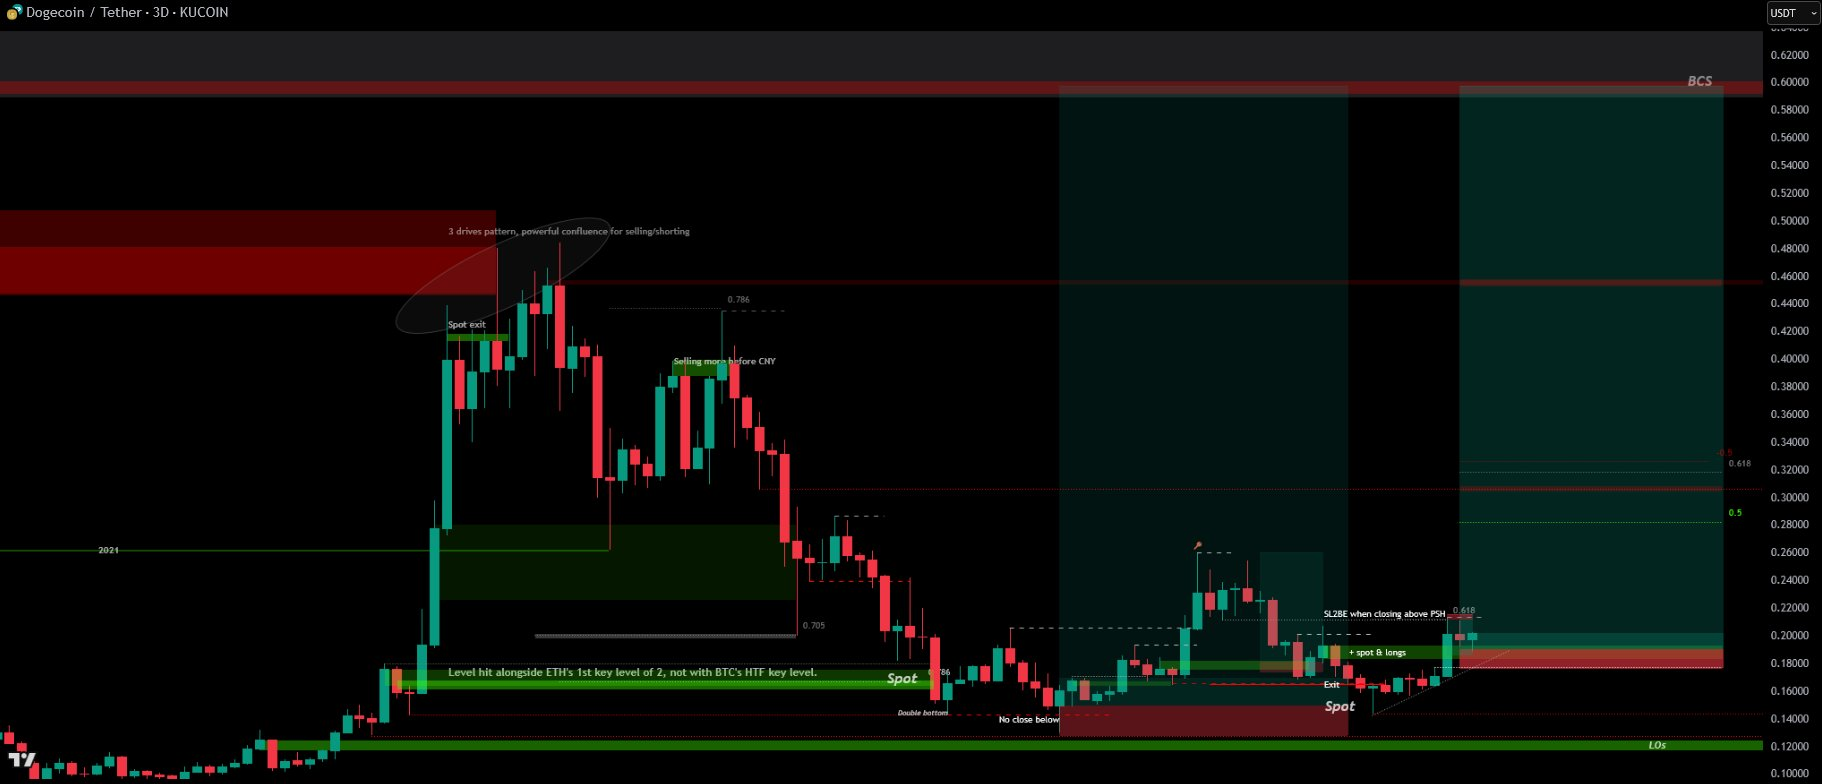
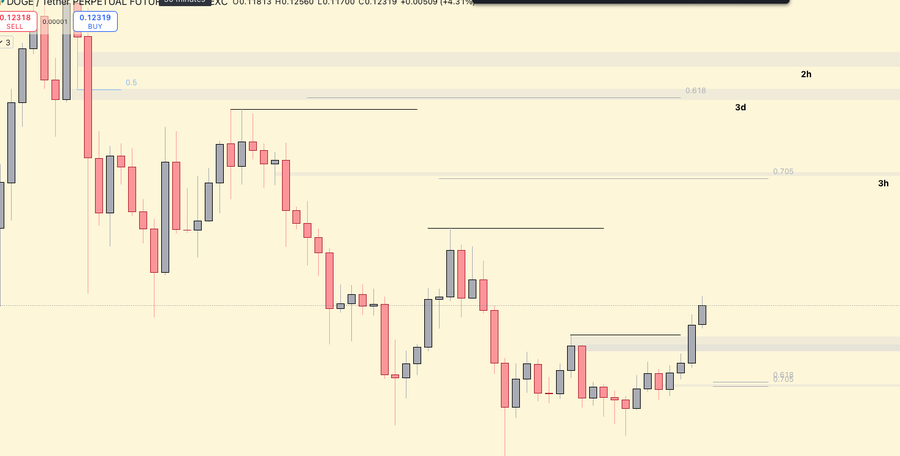
DOGE example — entry based on the 1D HOB rather than the exposed OB below:
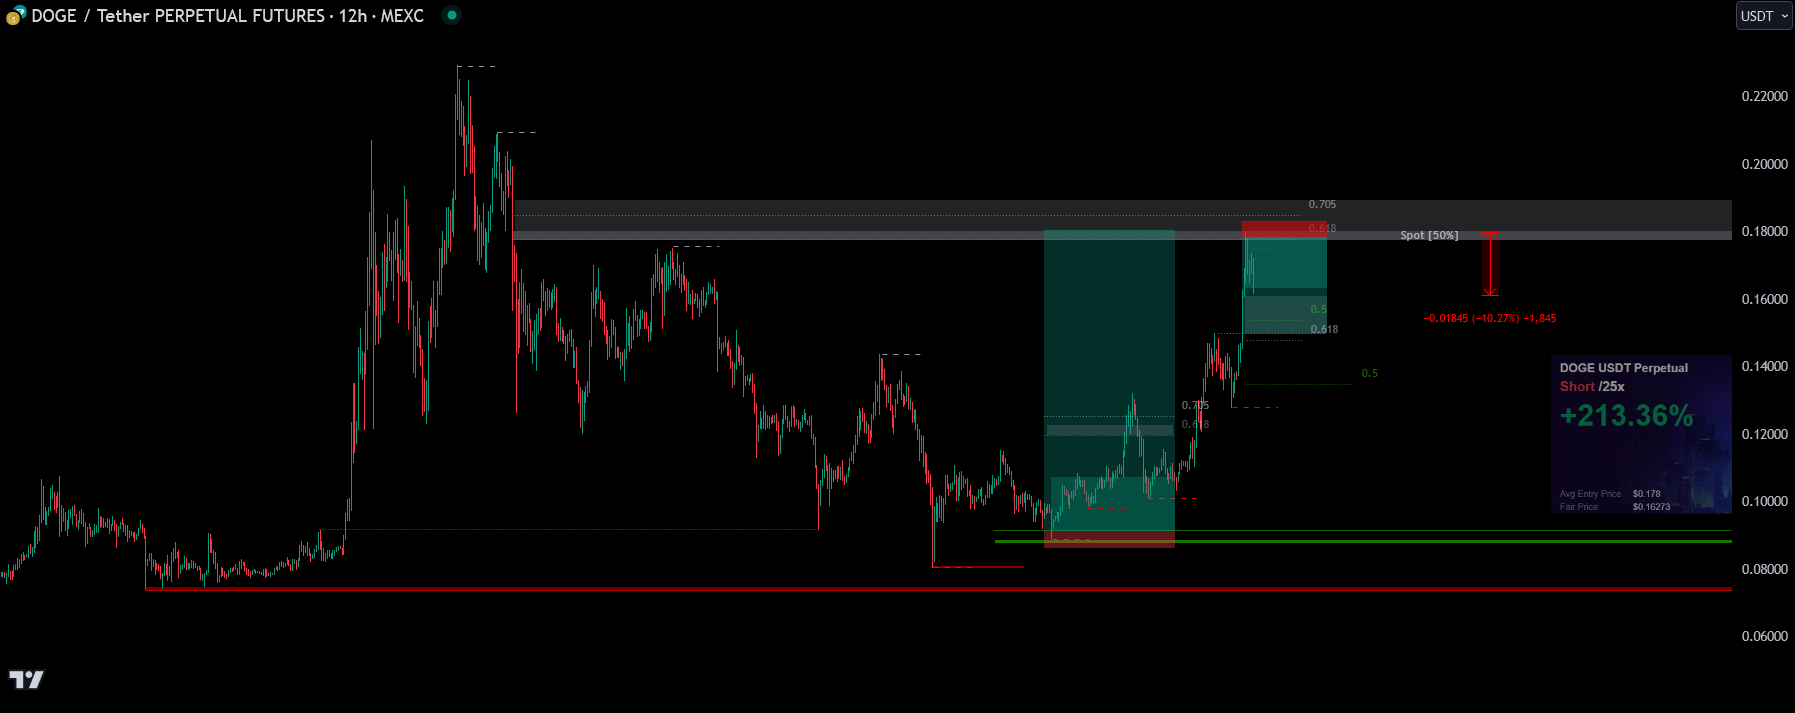
Boom on a HOB hit:
PENDLE example: a 21H OB hidden by 4 FVGs. The more hidden, the more powerful. PA reacted from this area pretty well — never closed below the highlighted area.
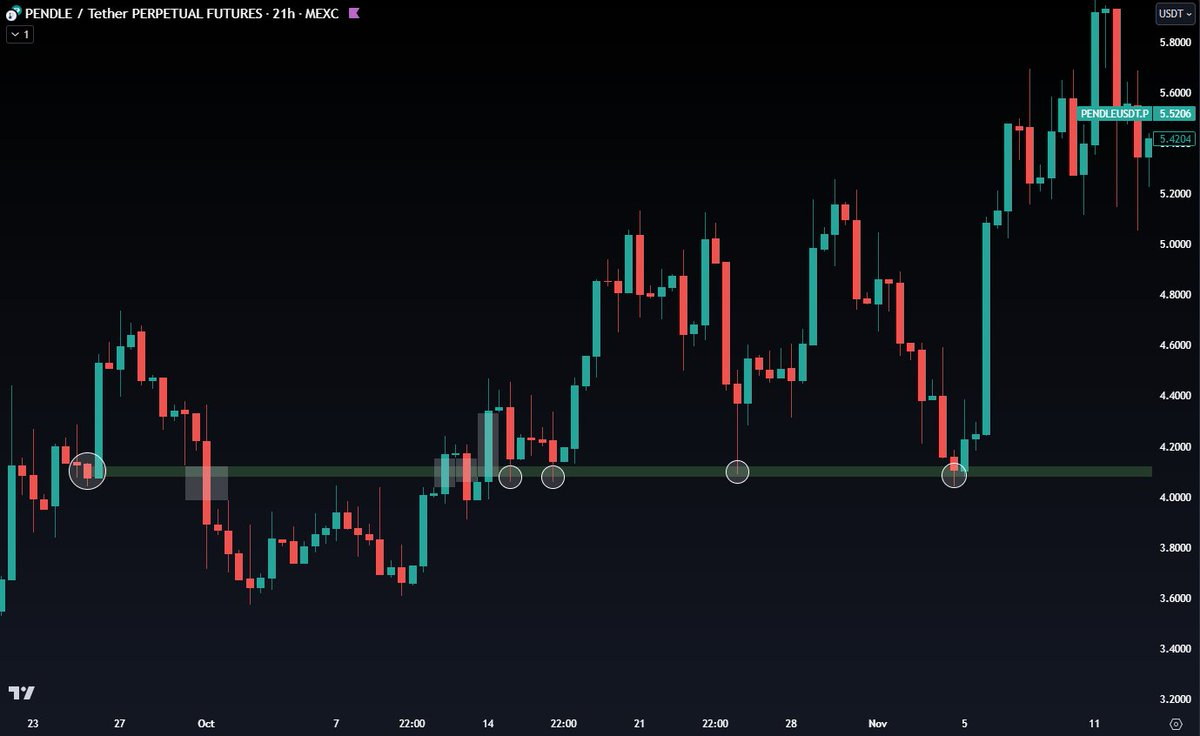
As it reacted multiple times, you may want to risk less on the 2nd, 3rd, 4th try, or risk nothing at all.
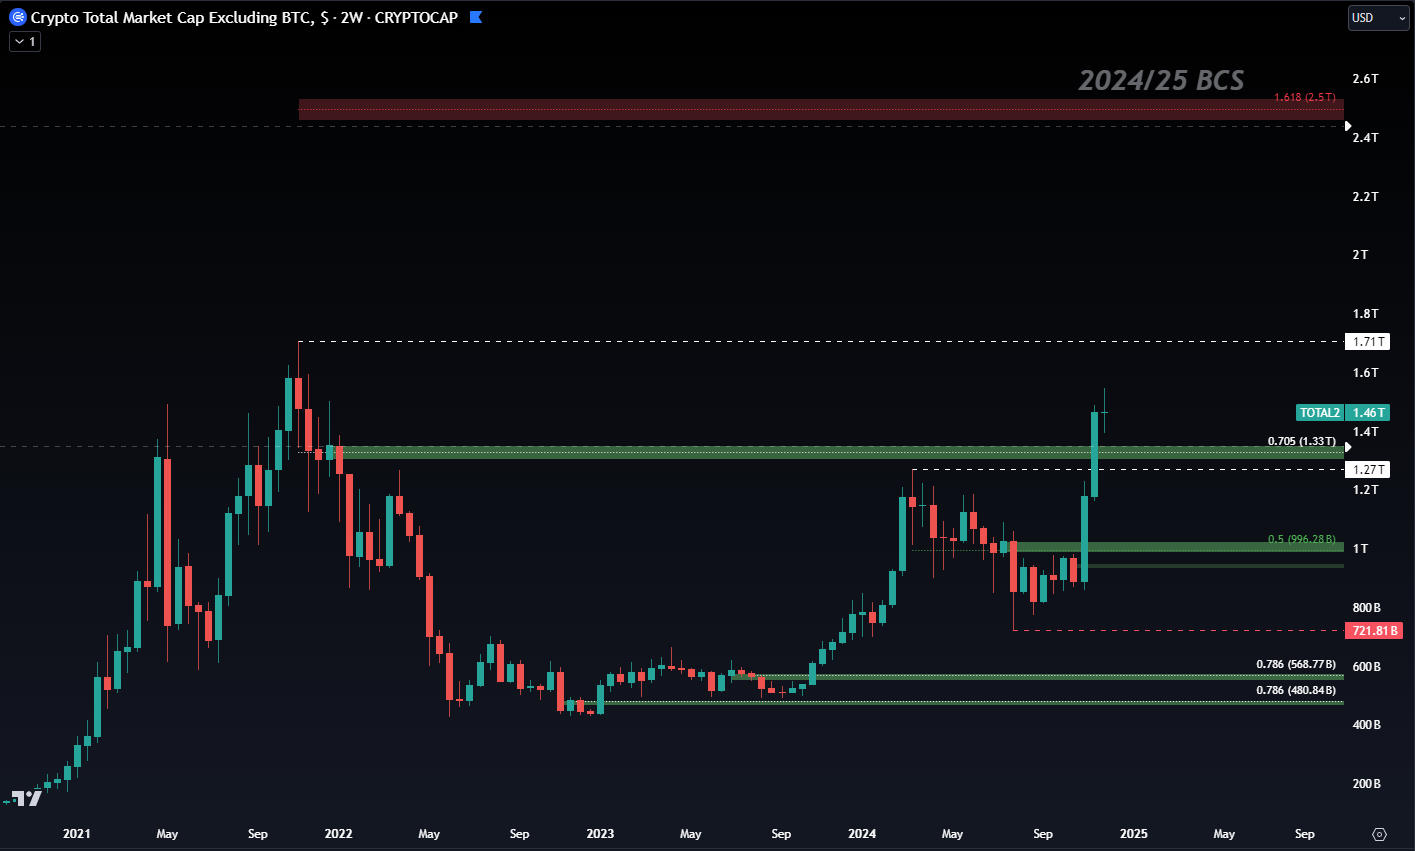
TOTAL2 Becoming a HOB
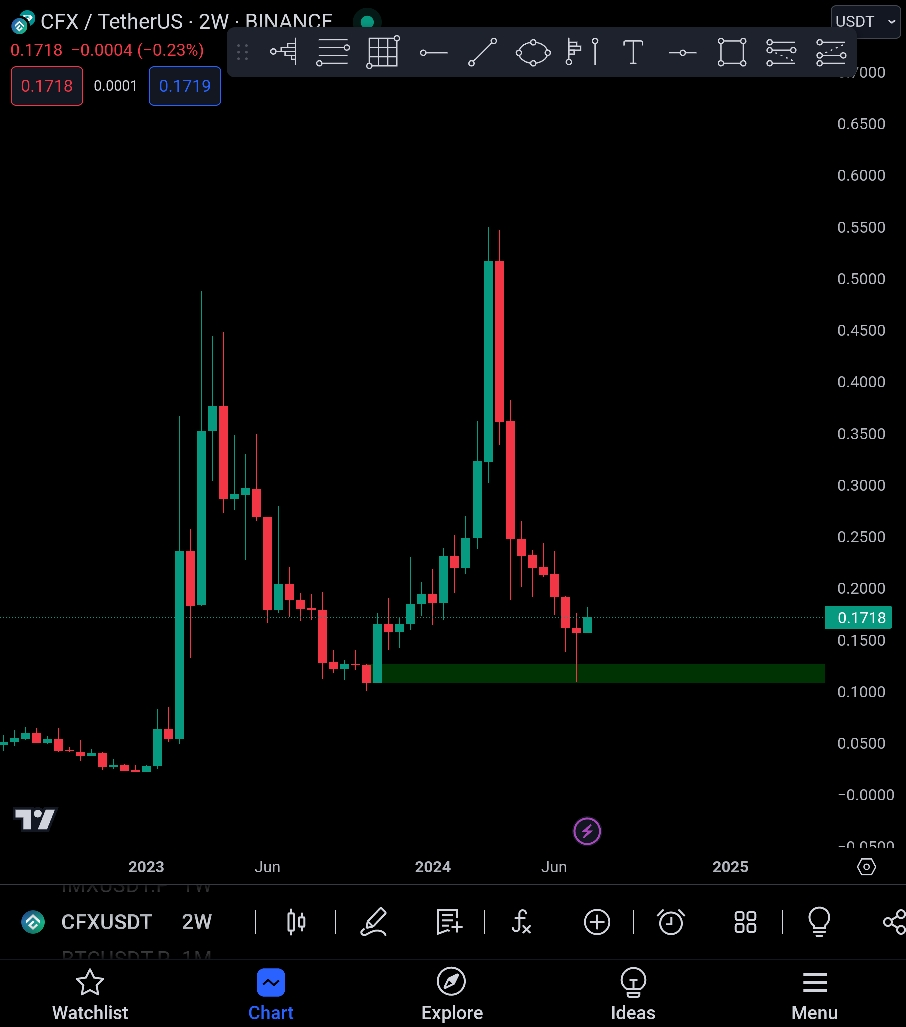
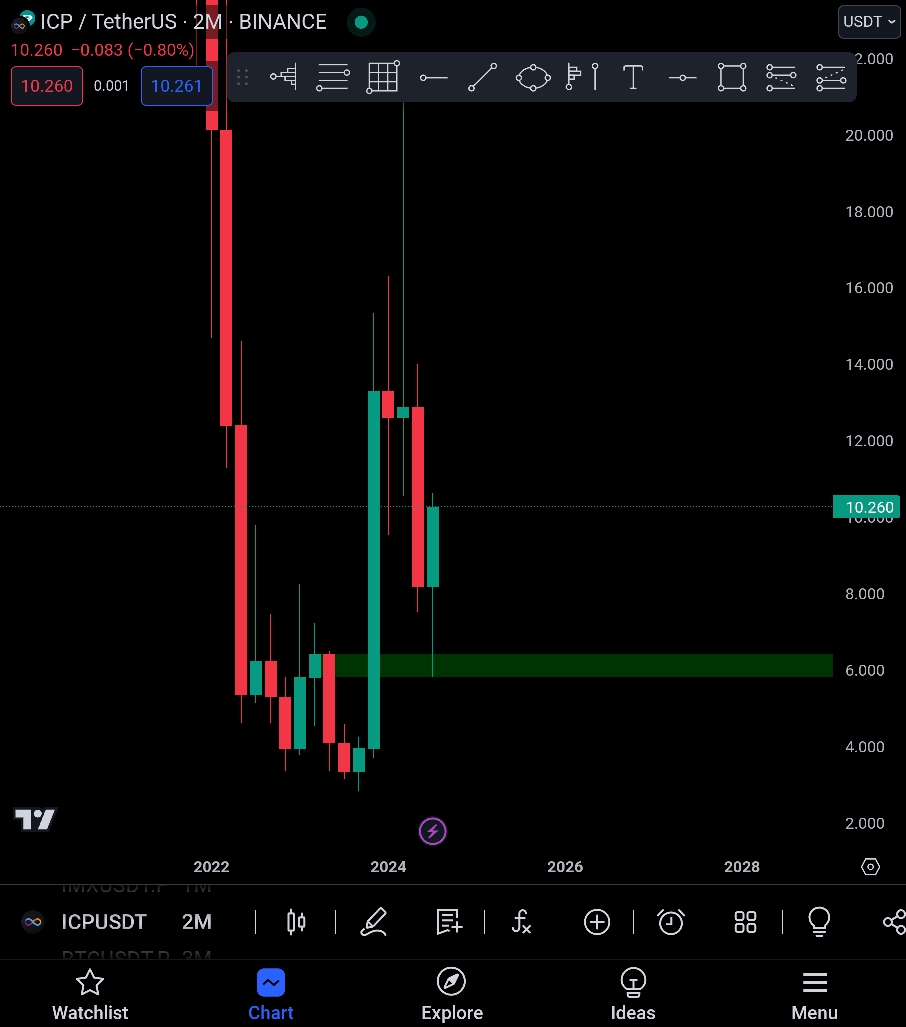
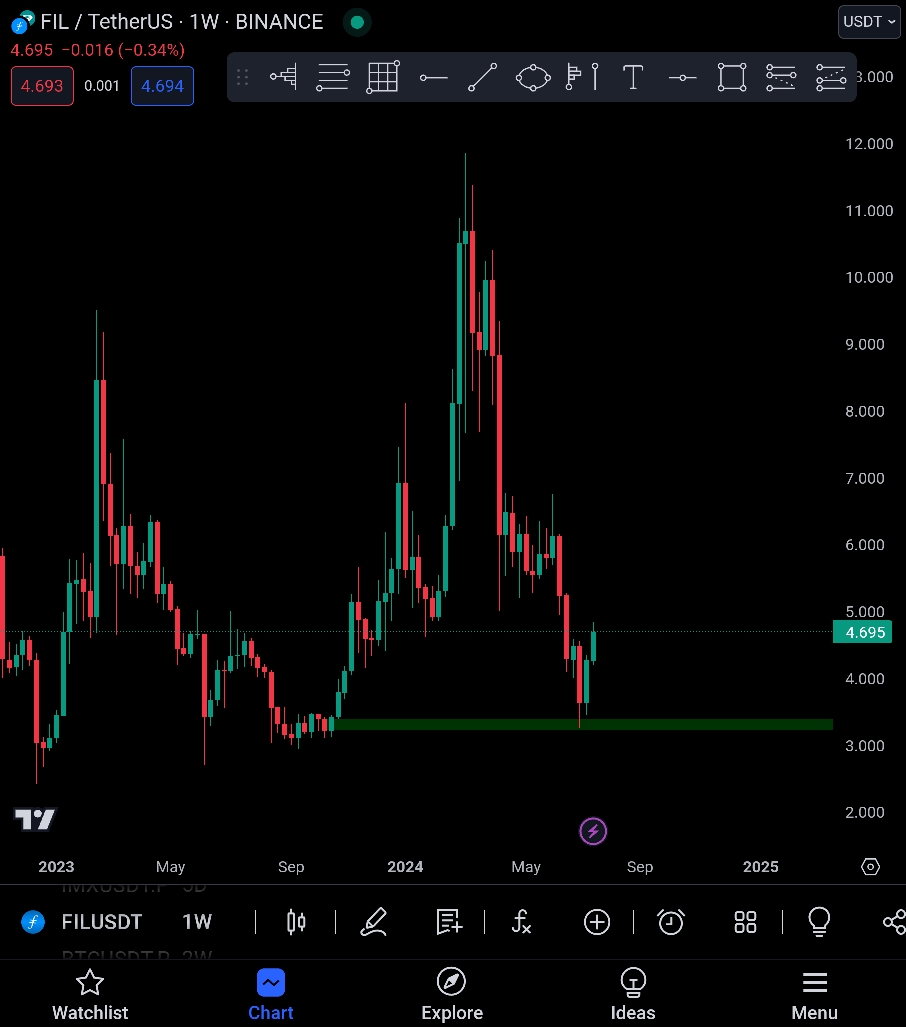
When a 2W OB turns into a HOB, that's a good chance to buy spot/long when the level is hit:
HTF, Multiple Touches Allowed
Normally you don't draw HOBs that were touched by wicks. The exception is HTF — multiple touches are allowed when the timeframe is high enough.
A coin can rug in less than 1 hour:
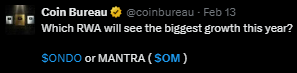
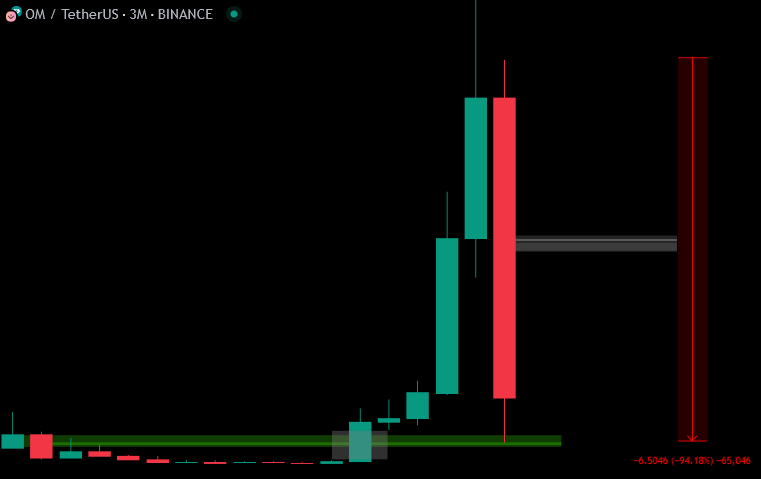
A glimpse of what will eventually happen to most coins.
Levels Within HOBs
There are levels to it depending on:
- Timeframe — the higher, the more powerful. See 👑Timeframe Rules.
- How hidden it is — fully behind FVG bodies vs partially behind.
- How much you can refine it — covered more in-depth in future lesson
ALPH context: hidden order blocks on HTF, refined into lower timeframes, and positioned at or near range extremes (supply or demand) are far more powerful than if they're sitting near the middle of the range. Optimal levels can mostly be found on BTC and ETH — other high trading volume coins can have optimal levels too, just not as optimal as Bitcoin.
ETH/BTC example:
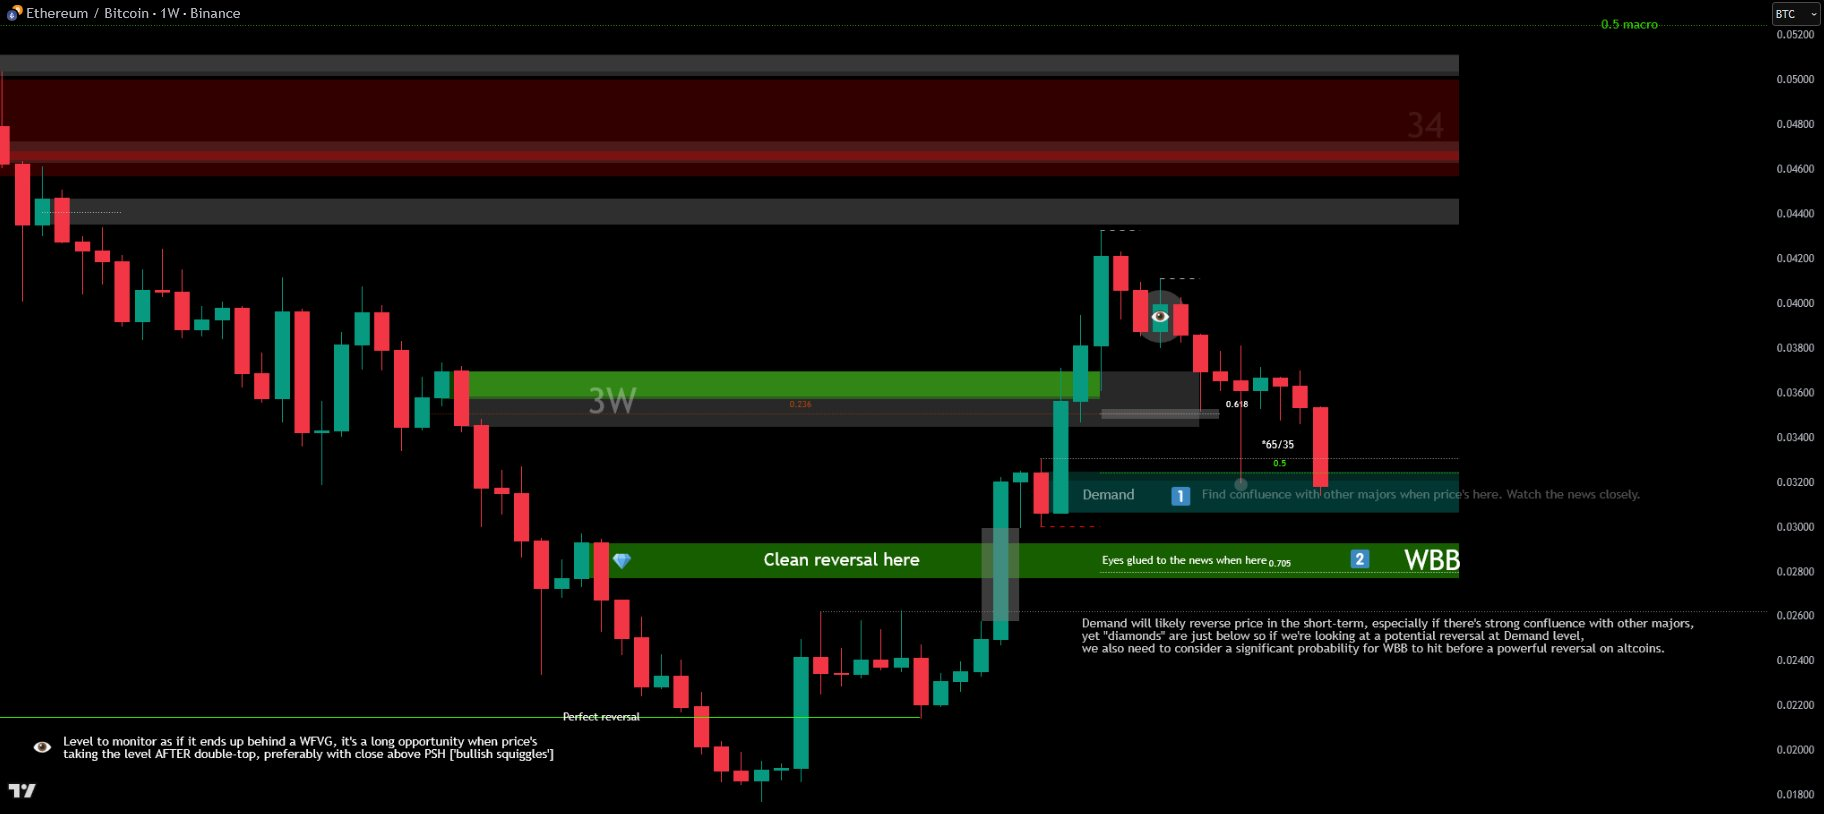
Demand will likely reverse price in the short-term, especially with strong confluence on other majors — yet "diamonds" are just below. So while we plan a reversal at Demand, we also need to consider significant probability for WBB to hit before a powerful reversal on altcoins.
Whales Skip Levels for Bigger Liquidity
Sometimes the most-likely reversal level isn't the first one you'd guess.
REEF question:
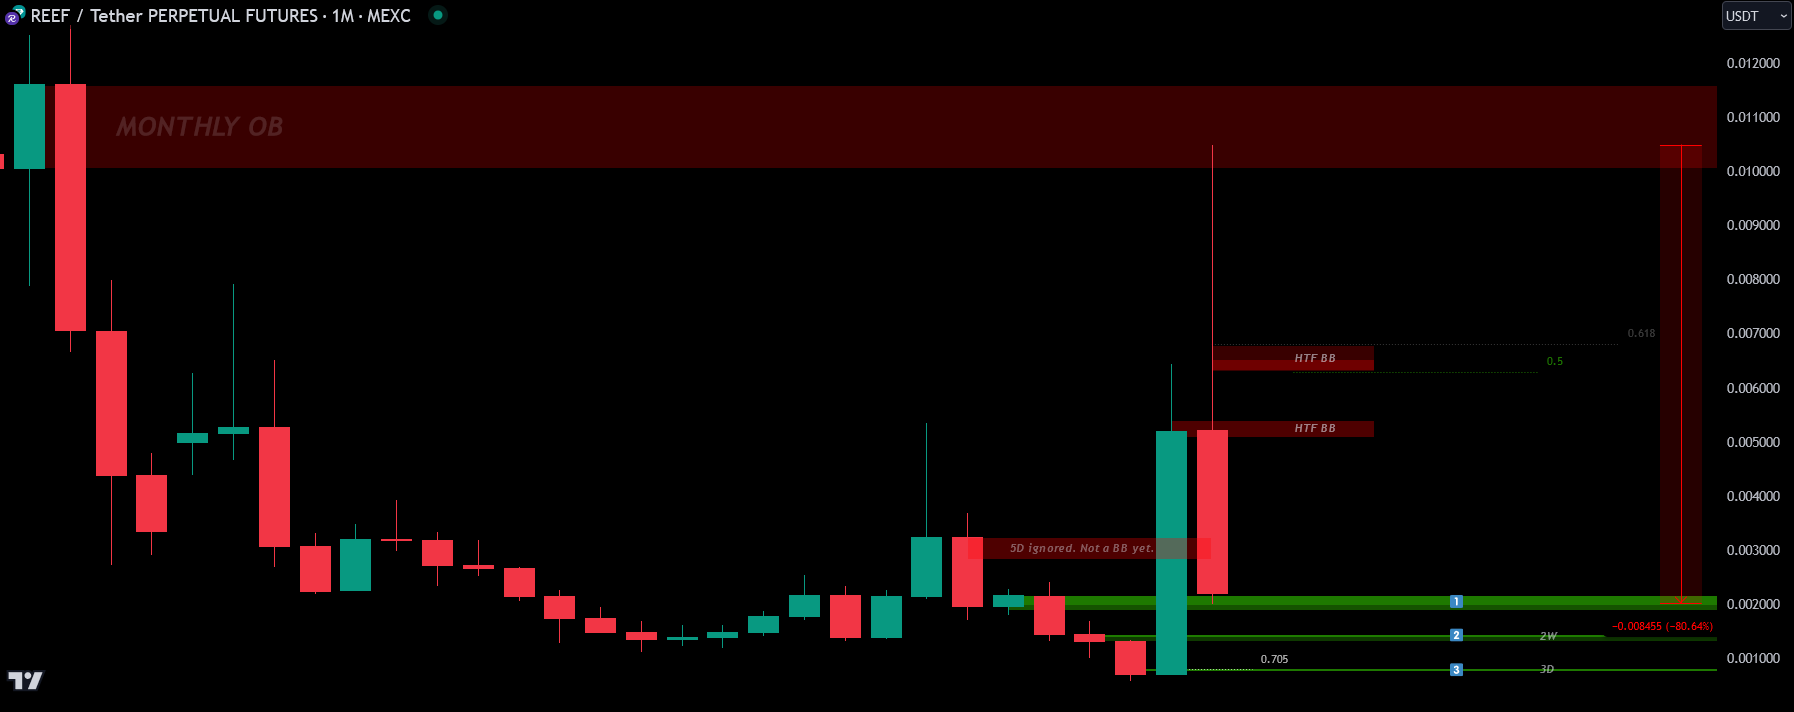
If you're a thief and discover a pile of gold, but right beside it lies a diamond, and the only way to unlock the diamond is to use the gold as the key, what do you choose?
Whales like to skip levels if there is stronger liquidity a bit further away. They turn a weaker level into a BB to get at the stronger level.
The 5D OB at 0.003 is a BB, but it's not the last one in an aggressive down move — there are larger BBs below it. If it were the last one, you'd consider it a more powerful reversal level. It could evolve into a powerful 5D BB in the future if it ends up hidden behind two or more FVGs.
Breaker Blocks
A Breaker Block occurs when a previous order block fails (is broken), and price reverses against the direction of the initial move — turning that area into a key level of support (in bullish setups) or resistance (in bearish setups). See Stop Loss Hoodstock.
The classic SMC definition: simply a broken order block, no FVG required behind it. We don't take ordinary SMC/ICT breakers — we only take the advanced breakers and ignore any breaker block that doesn't have an FVG in front of it.
In other words, BBs in this curriculum are broken order blocks that become key levels — and for them to be worth playing, they need to be hidden by an FVG.
In order for a BB to be a BB, it has to be "hidden" to some degree just by nature of being a failed OB. So HOB is inherently implied in a BB. And a HOB level couldn't have any FVGs running over it unless it's a BB (otherwise you'd call it an OB). So all HOBs are BBs. They're not exactly the same thing, but the labels are interchangeable because you can't have one without the other.
Same with NOBs — there's no such thing as a naked BB, so OBs are inherently implied in a NOB. All NOBs are OBs that are untouched.
- BB = HOB
- OB = NOB
Not technically identical, but essentially.
Mechanics of a BB
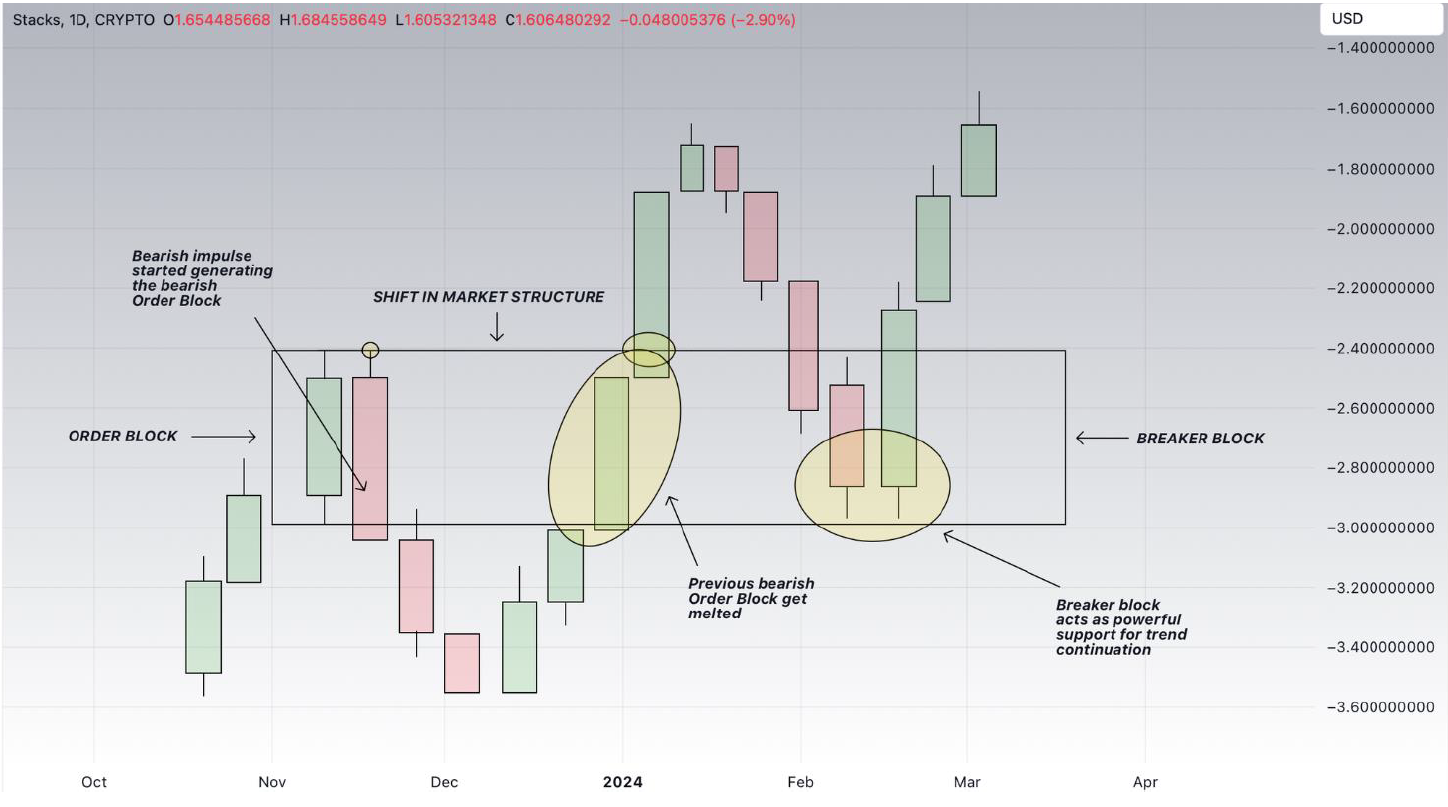
The bearish impulse generates the bearish order block that becomes a breaker block. Why? Because shortly after, price reverses back up, completely melting that bearish OB. It's then used as a demand zone where price bounces, continuing the trend:
Real example on USD/JPY:
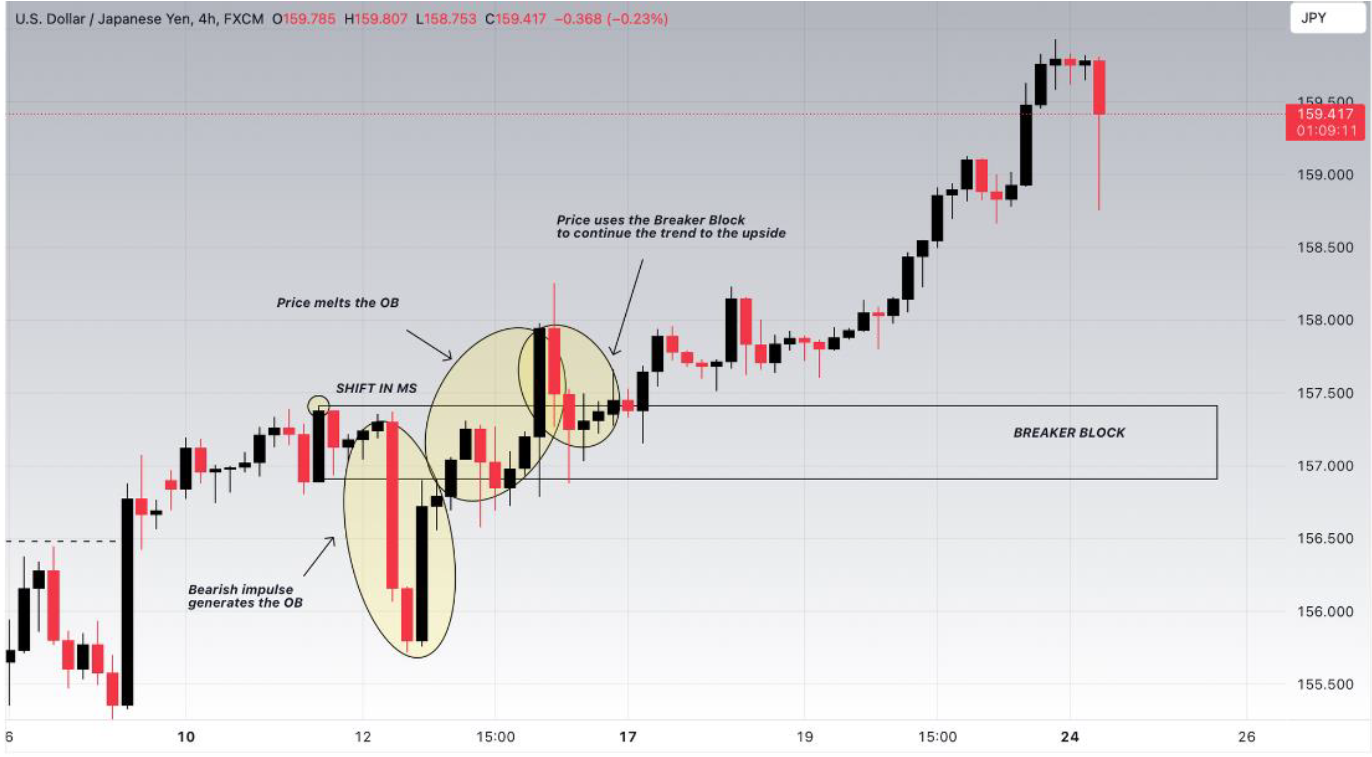
The strong bearish impulse generates the OB. At some point, price reverses back up, melting the OB and creating a Market Structure Shift (MS) with the break of the previous high. Price uses the OB as a demand area to bounce and continue upward — forming the BB.
This works in both directions. Bullish impulse creates OB, price pushes down with violence, OB becomes supply, trend continues down. Same recipe.
Pro tip: As BBs are highly monitored areas, they often act as key zones for confluence with FVGs.
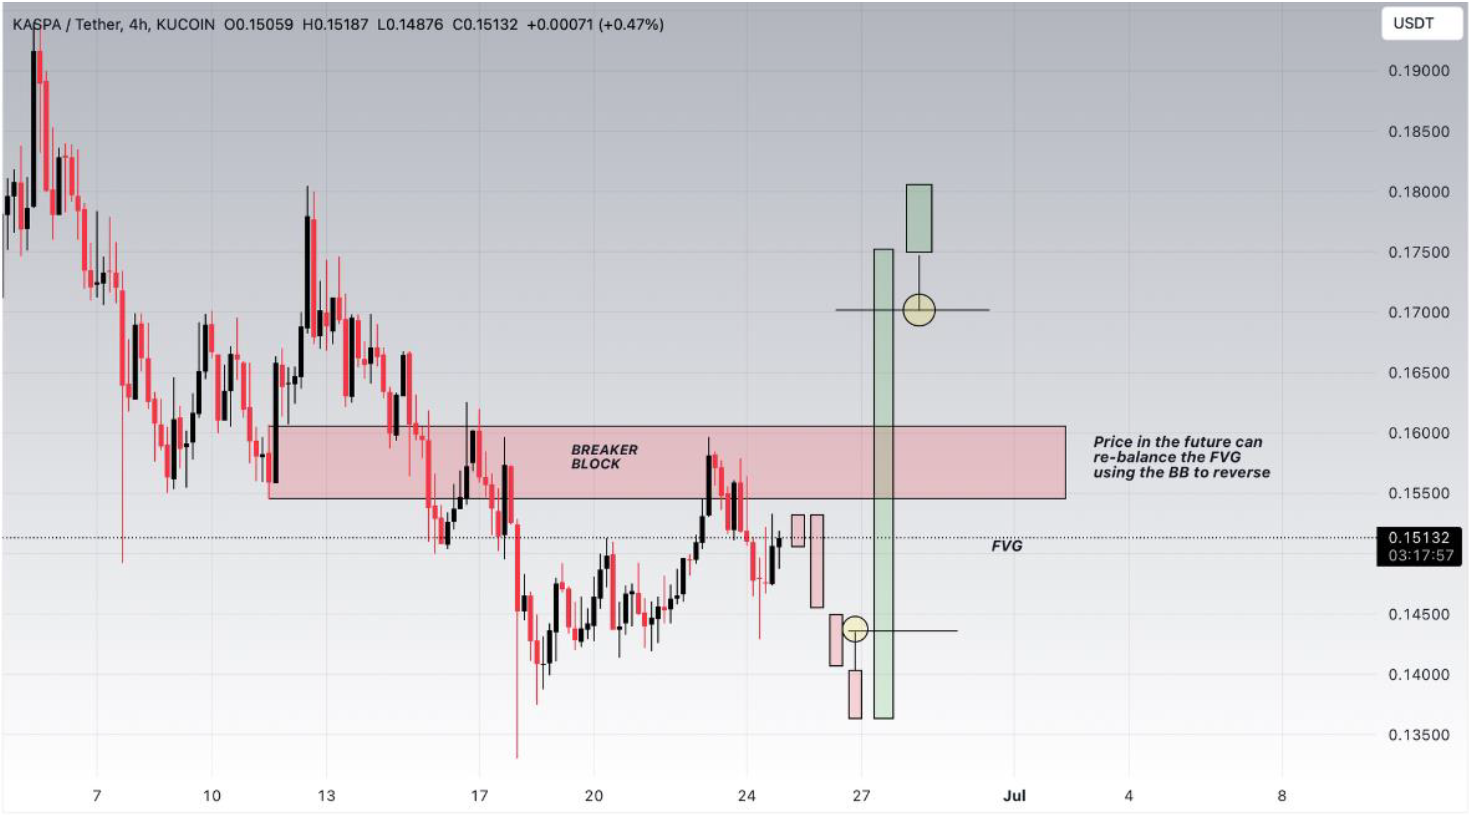
In the future, price could be attracted to the FVG, partially rebalancing it, using the BB as a reversal point.
Bearish or Bullish Flip
A bearish BB turns bullish if price pierces through and closes above. A bullish BB turns bearish if price pierces through and closes below.
If close above:
- Look for pullback into a key level. If there's none, expect higher probability for price to chase the next SH.
- If closing above, look for a pullback to a key level before bullish continuation.
- If you're long from a demand level, trail your stops below MTF/HTF key levels.
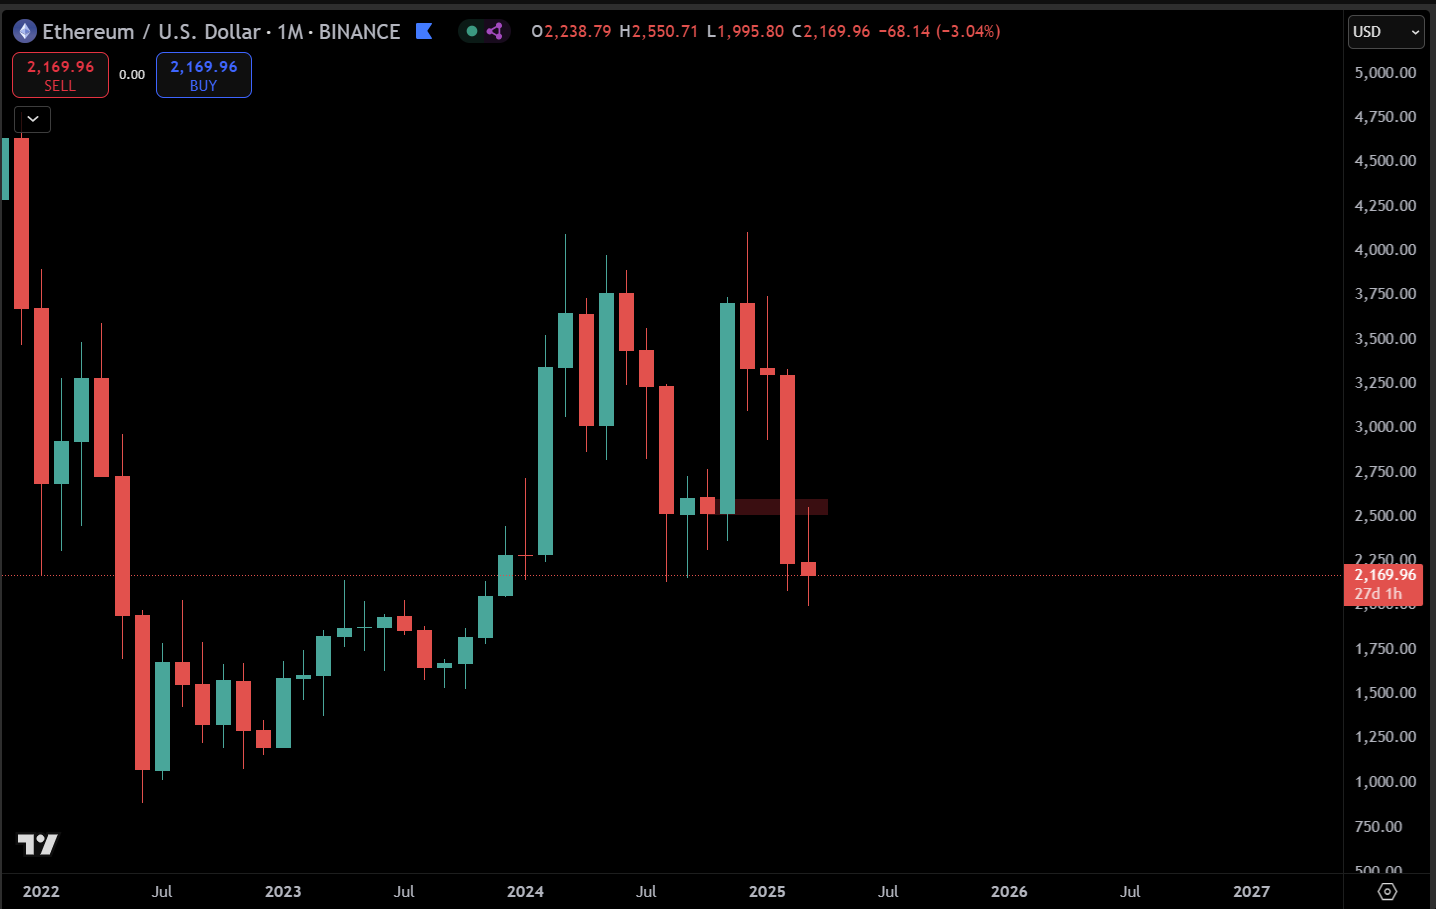
When ETH was taking the monthly BB, it became a BB after the monthly close — not before. You don't need an FVG already printed, but the close confirms it:
It's always valid if not taken — strength may vary:
Tighter FVG = Better R:R
The tighter the FVG on the BB level, the better:
Doesn't make the BB stronger by itself — it just gives a better 🔷Risk Reward because of the tighter SL.
Weak vs Strong Reactions on BBs
When price hits a BB, you don't want a weak reaction — meaning price closes past the equilibrium or beyond the level (invalidated) on the same TF where the BB was discovered. Close out the trade early if that happens.
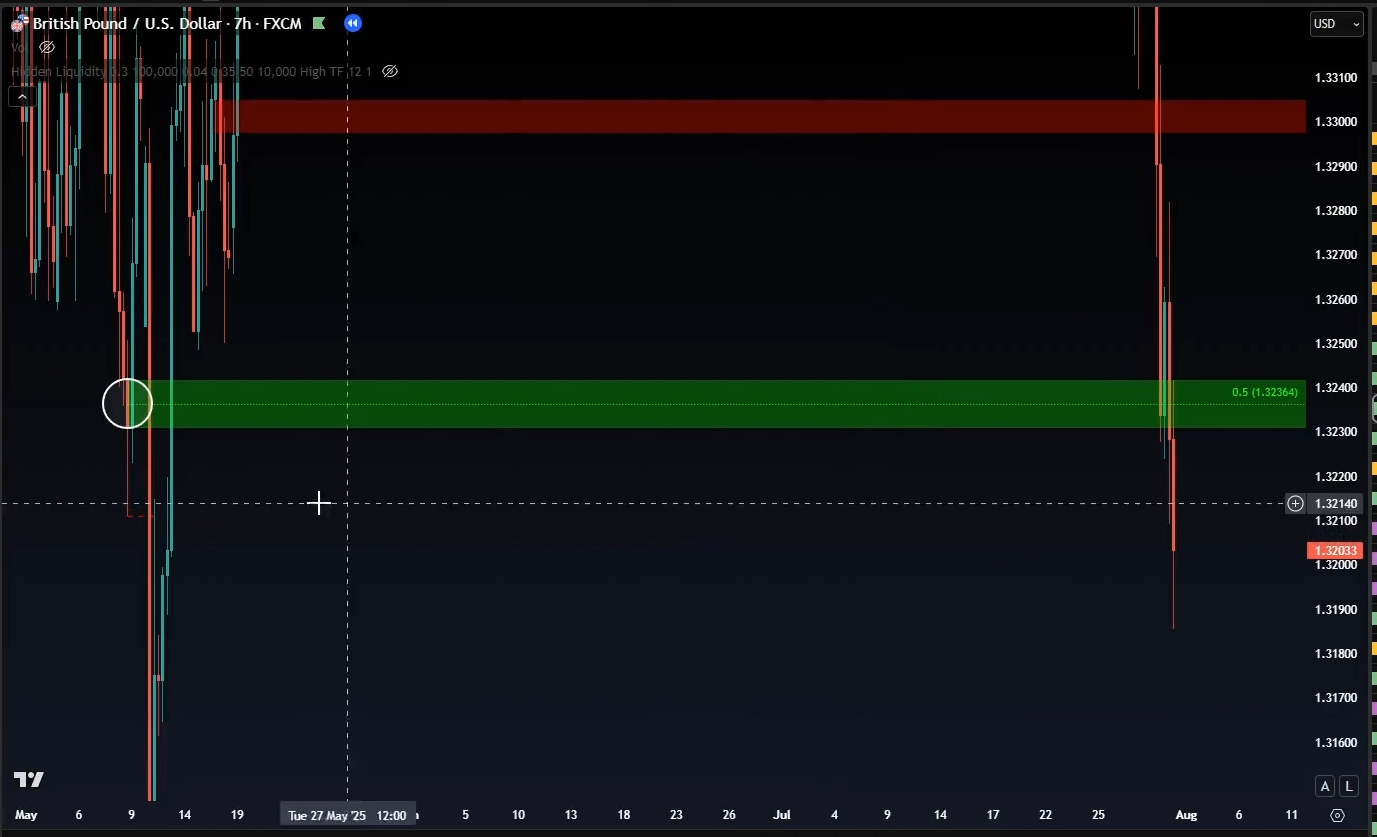
Weak reaction (7h BB):
Good reaction (validated):
Price doesn't normally spend a long time below the equilibrium of the OB. You don't want PA to close below the OB — that tells you the setup was invalidated. The reaction of PA as it touches the OB tells you how bullish or bearish the setup is.
Mitigation on the TF Where Found
The BB has been touched at LTF. Why are we considering a mitigated one here? Specially when it's not a HTF bb from which we can expect multiple tests.
It's not mitigated on the TF it's found at:
HTF BBs can be hit multiple times before a true reversal, however after each hit the level becomes weaker. LTFs might only handle one hit. Being on high alert with a reasonable SL is crucial.
When Price Skips BBs
When several coins with high trading volume disregard HTF BBs, it can hint at where Algos🐋 are likely steering the market.
This behavior can indicate that key levels initially perceived as bearish BBs could become bullish BBs. Look for HTF close above the PSH, followed by pullback into those BBs — which then become ideal zones for long entries before bullish continuation. Until major charts confirm optimal reversal levels, these ideas remain valid. See Check Multiple Charts and Have Multiple Plans📄.
If you haven't yet mastered managing these scenarios profitably, it's a clear sign to avoid significant position sizes. Mastery requires being in sync with the market and prepared for any outcome.
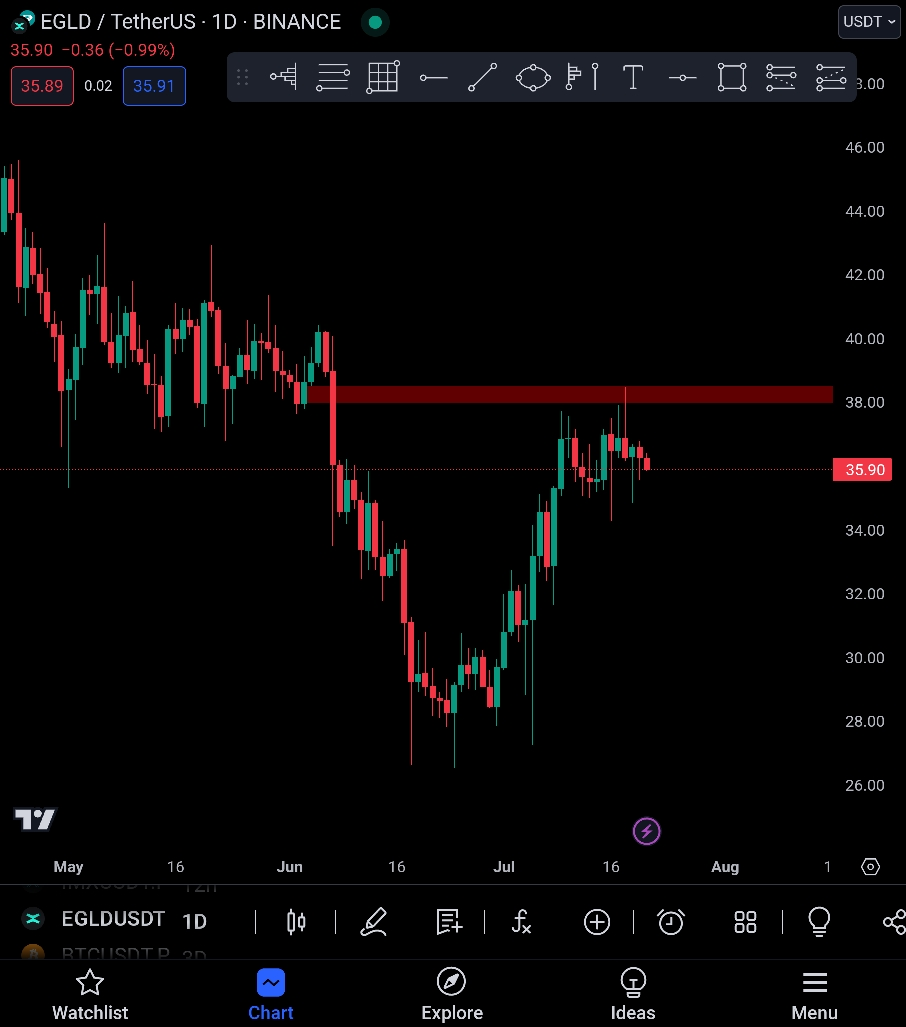
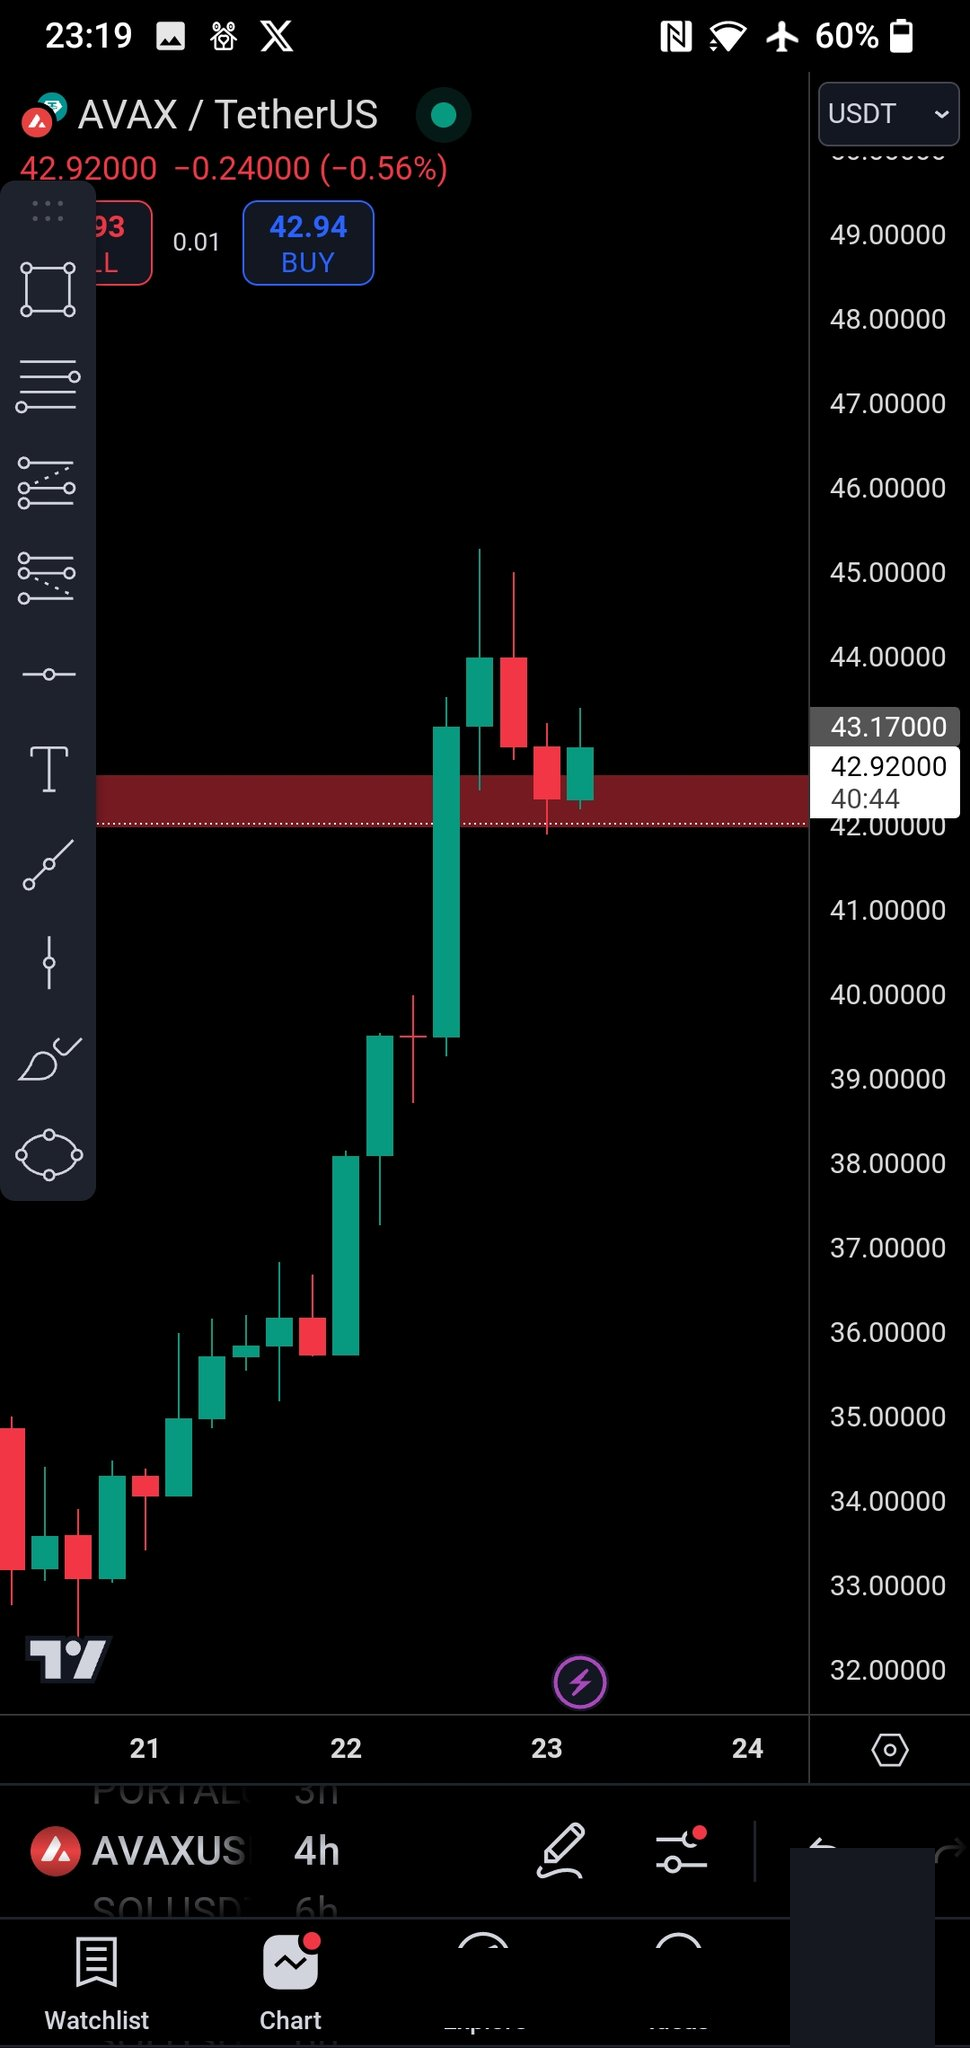
AR example:
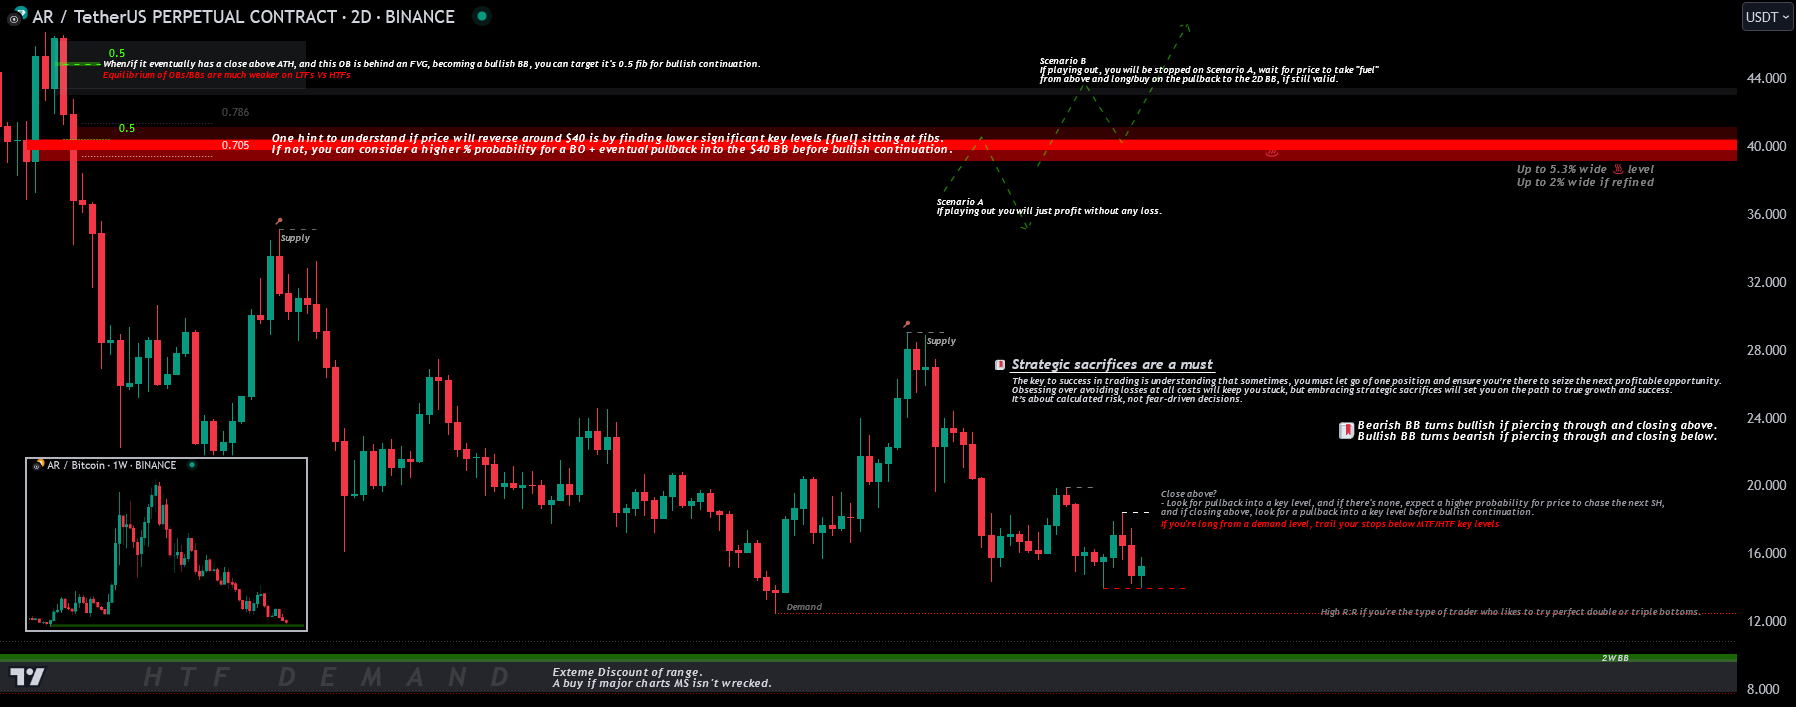
When/if AR eventually closes above ATH, and the OB sits behind an FVG (becoming a bullish BB), you can target the BB's 0.5 fib for bullish continuation. Equilibrium of OBs/BBs are much weaker on LTFs vs HTFs.
To understand if price will reverse around $40, look for lower significant key levels (fuel) sitting at fibs. If there are none, consider higher probability for a breakout + pullback into the $40 BB before bullish continuation.
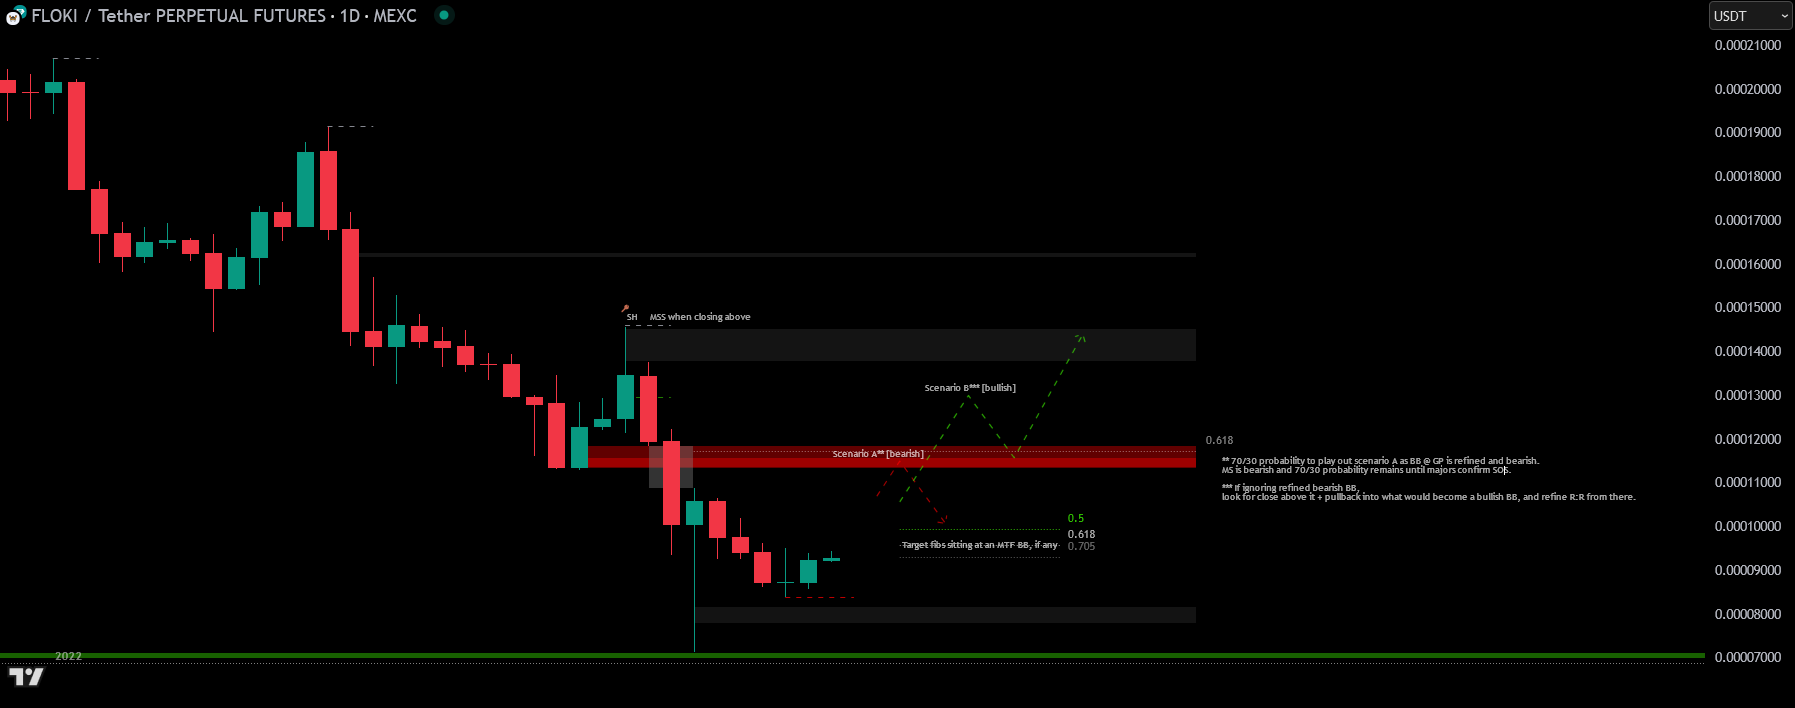
Have multiple scenarios ready:
- Scenario A — playing out, you profit without loss.
- Scenario B — playing out, you get stopped on Scenario A, wait for price to take "fuel" from above and long on the pullback to the 2D BB if still valid.
Strategic sacrifices are a must. The key to success is understanding that sometimes you must let go of one position to ensure you're there to seize the next profitable opportunity. Obsessing over avoiding losses keeps you stuck. Embracing strategic sacrifices sets you on the path to growth.
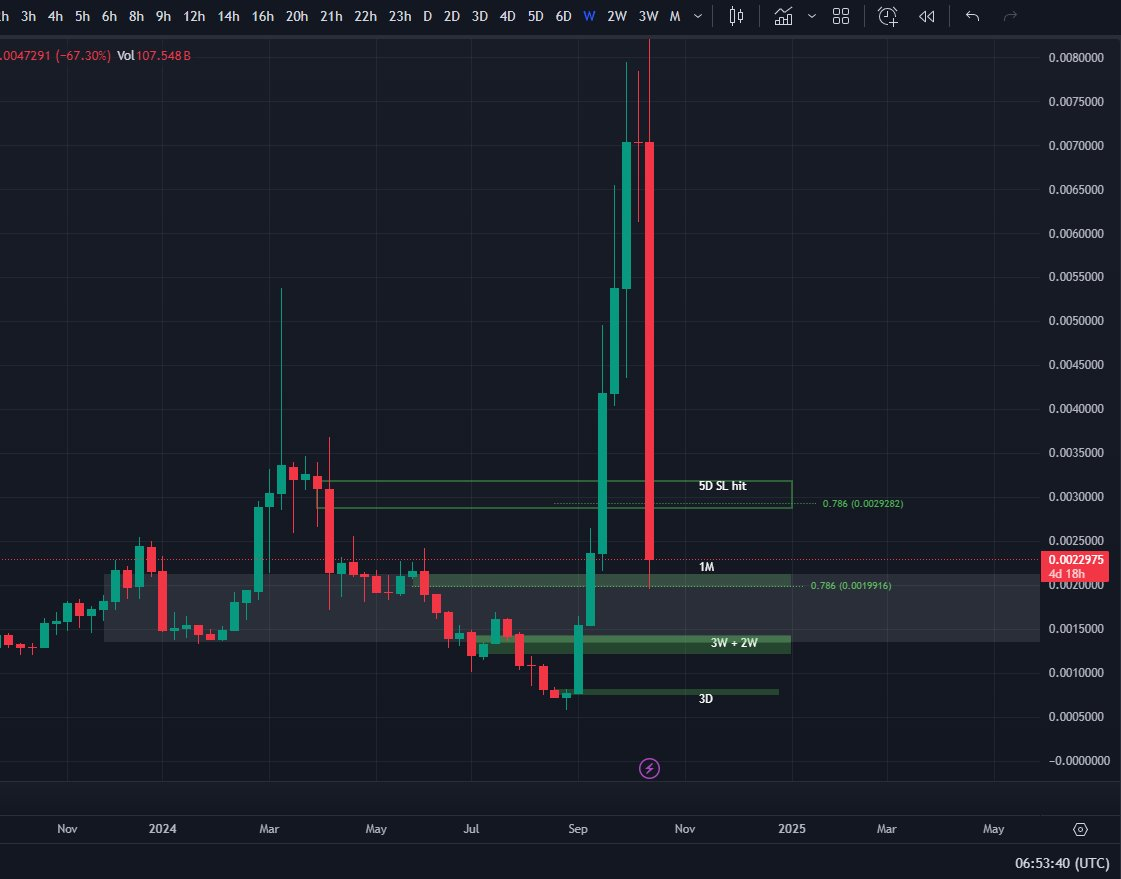
REEF [Oct 26, 2024]:
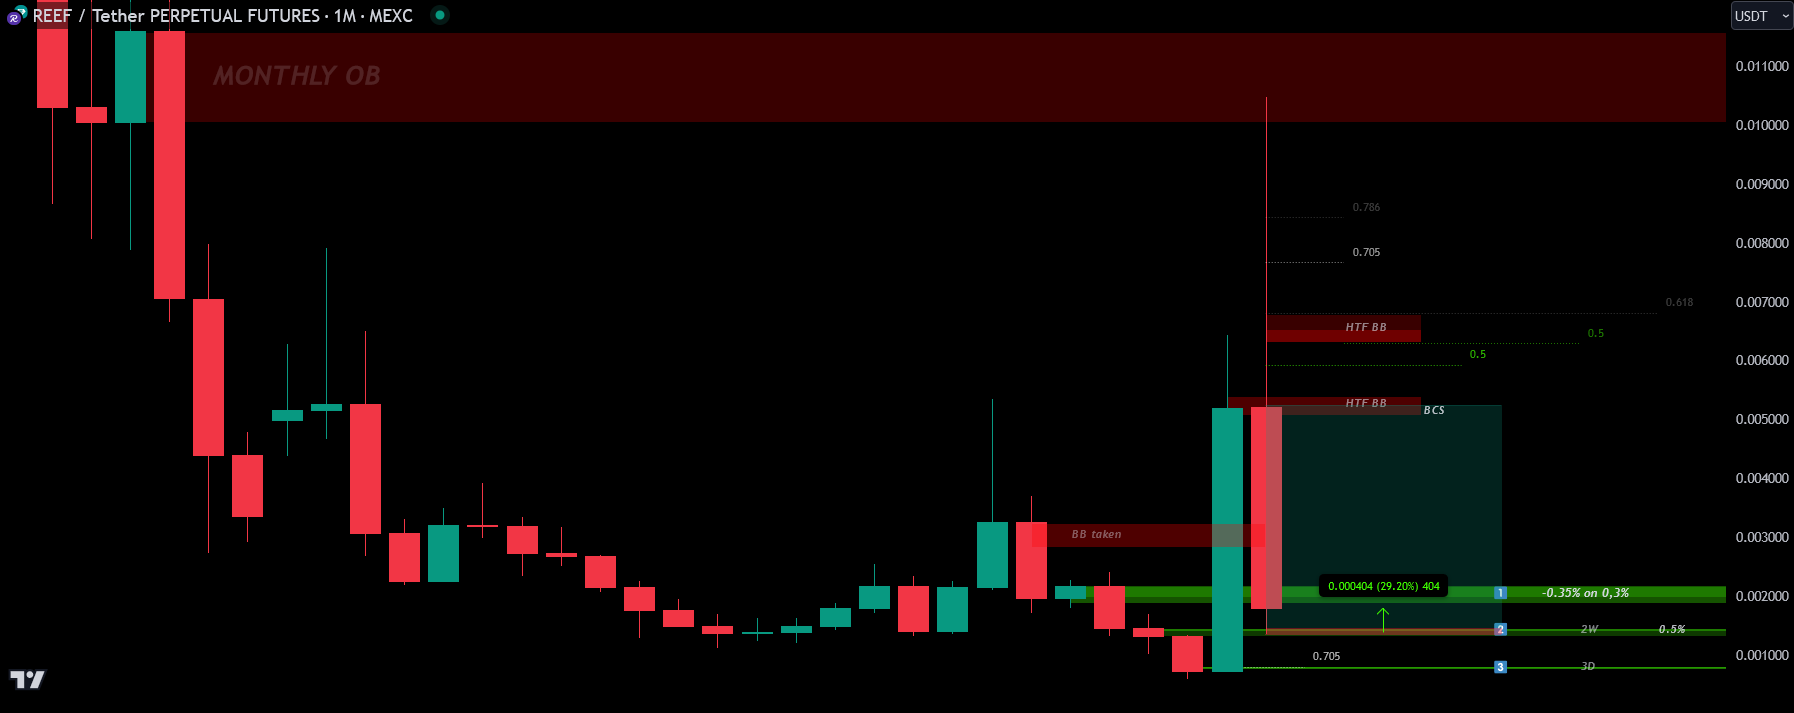
The plan is trying all three levels. First failed. Second is in play, on good profit and trailing wide. You can try all levels, get good reactions in all, and make money in all. Or you can wait just for the third and miss out on a potential HTF reversal. 🔷Position Size in each should differ.
You don't try every single BB you find:
- The more liquidity a coin has, the more powerful the BBs.
- The higher the timeframe, the more powerful the BBs.
- The more hidden the BBs, the more powerful they are.
Don't expect a 4H BB refined into 15min + fibs to have enough fuel for aggressive 20%+ reversals. You can expect that from HTF refined levels.
When You Can't Find HTF BBs
When you can't find HTF BBs, you play with 🎁Supply & Demand strategies.
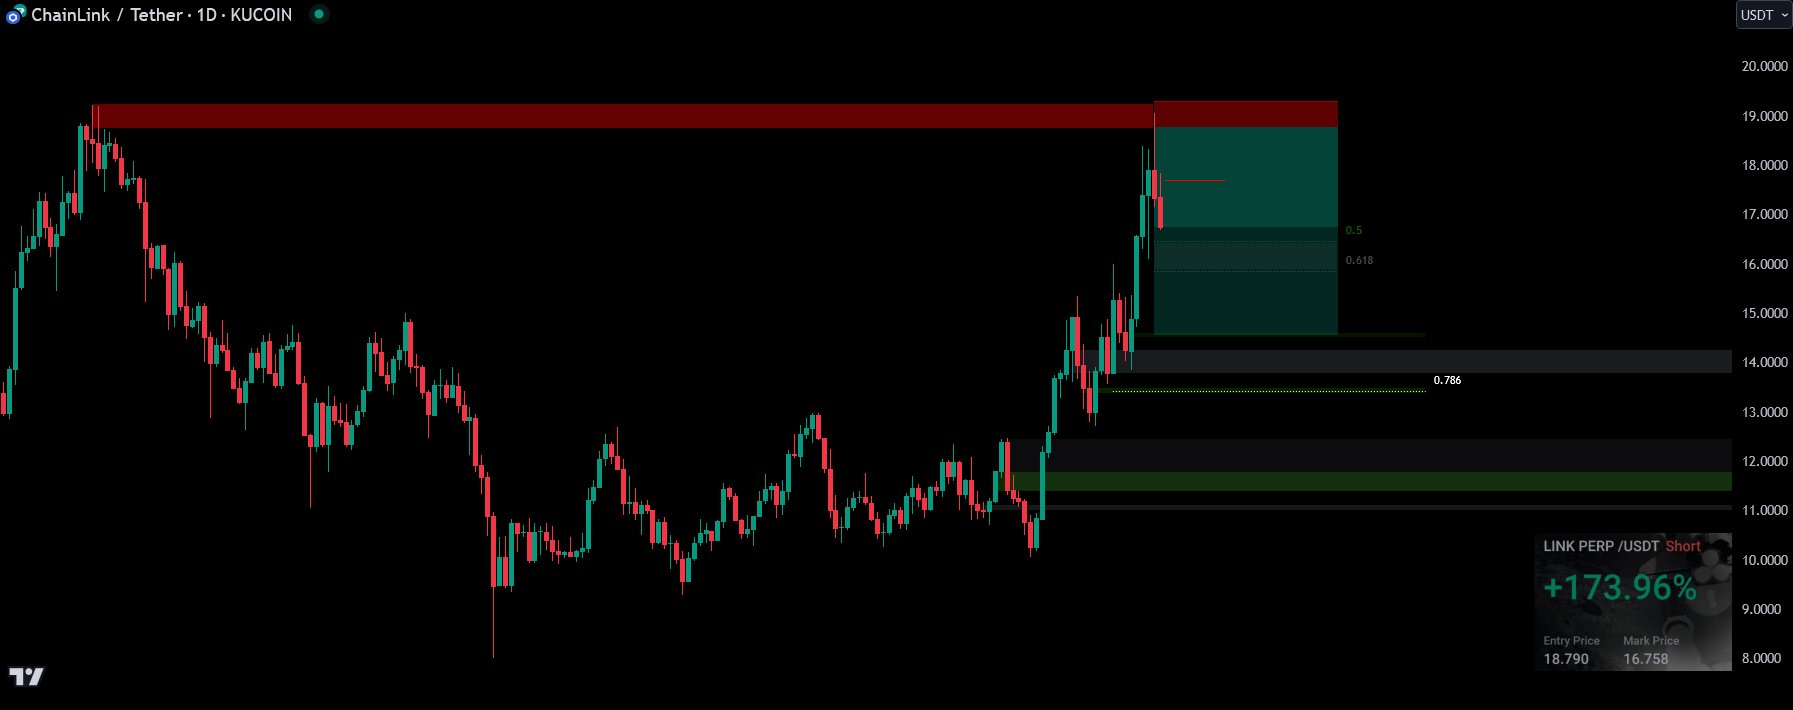
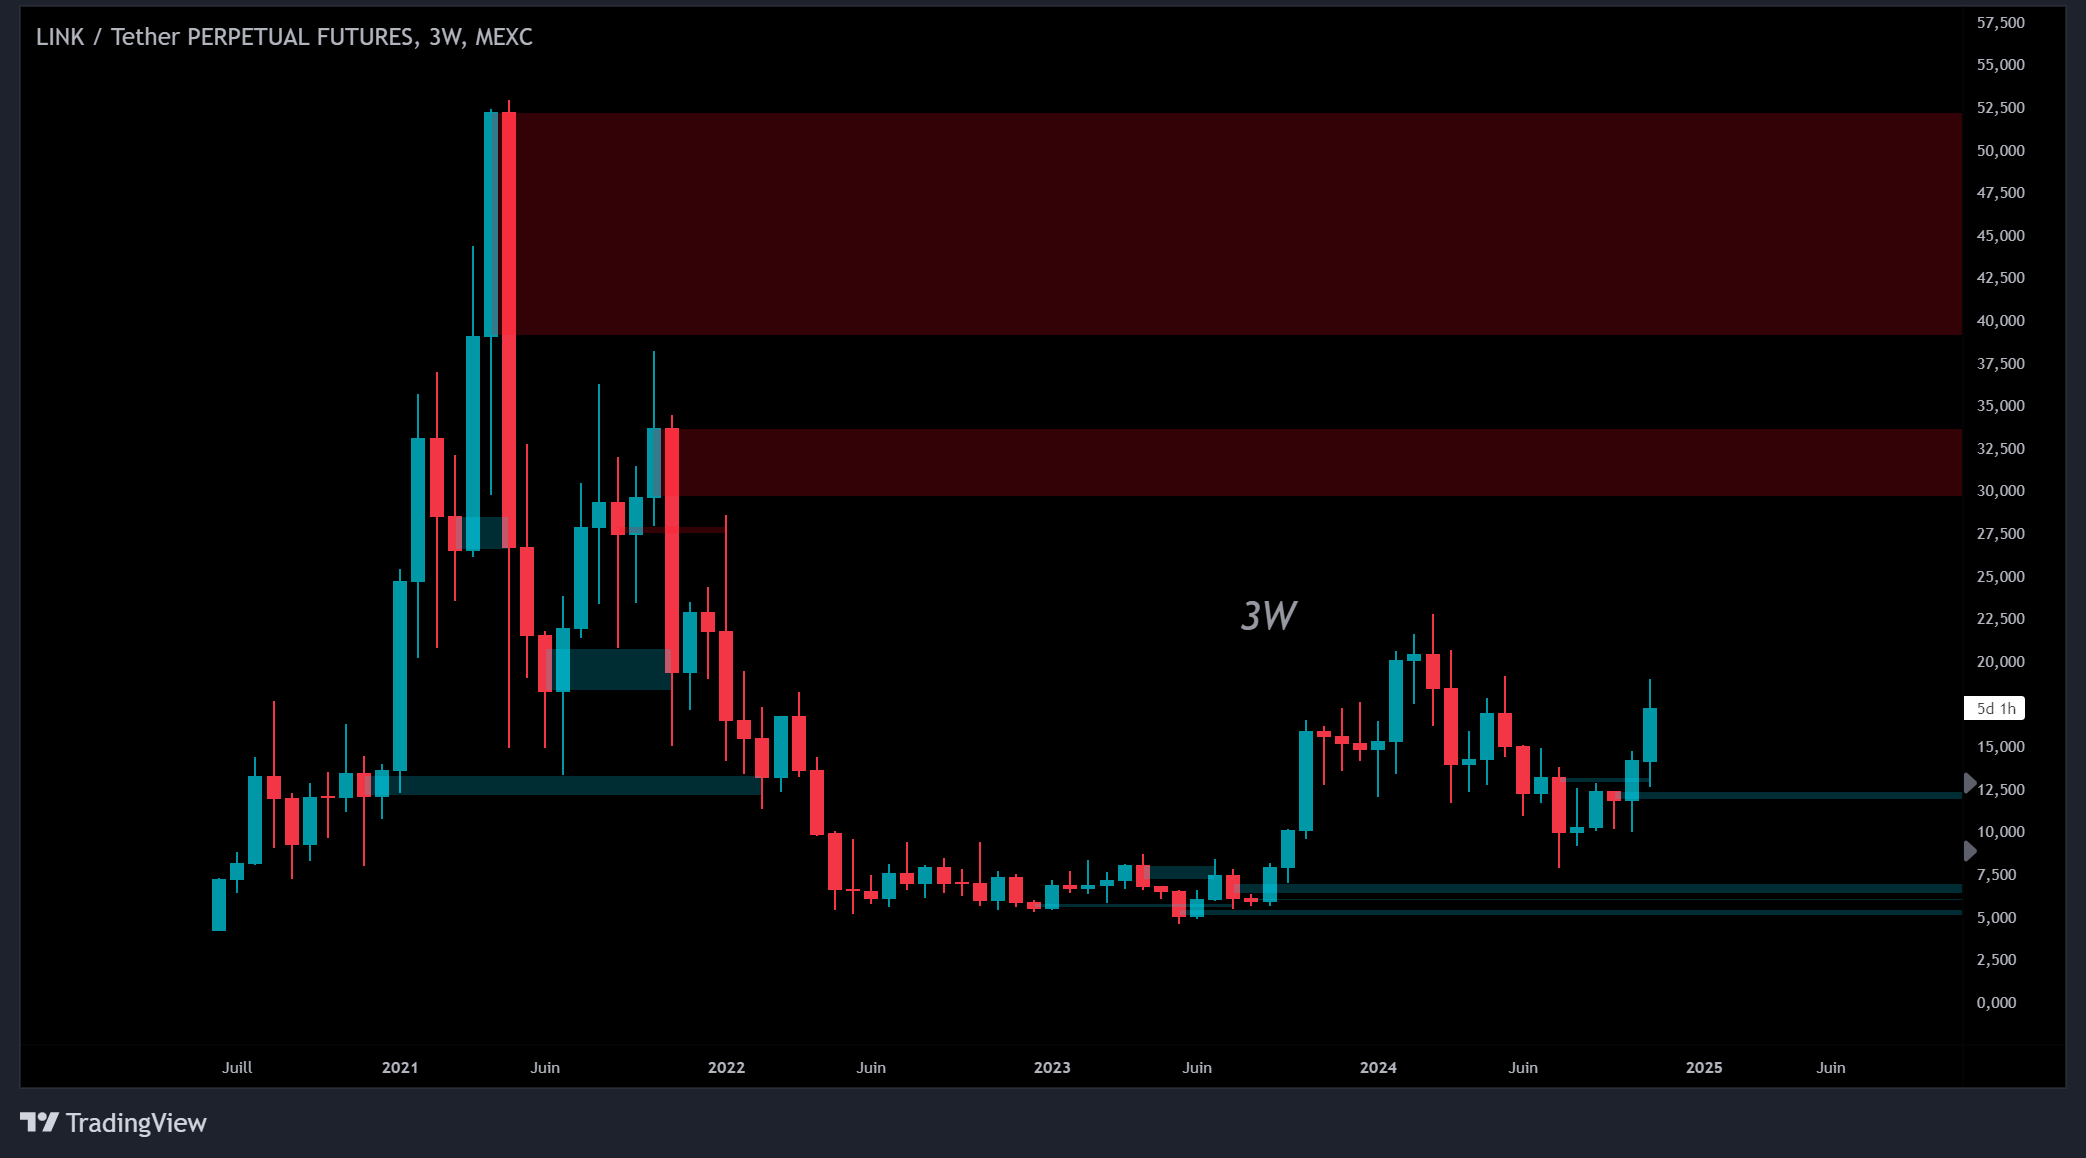
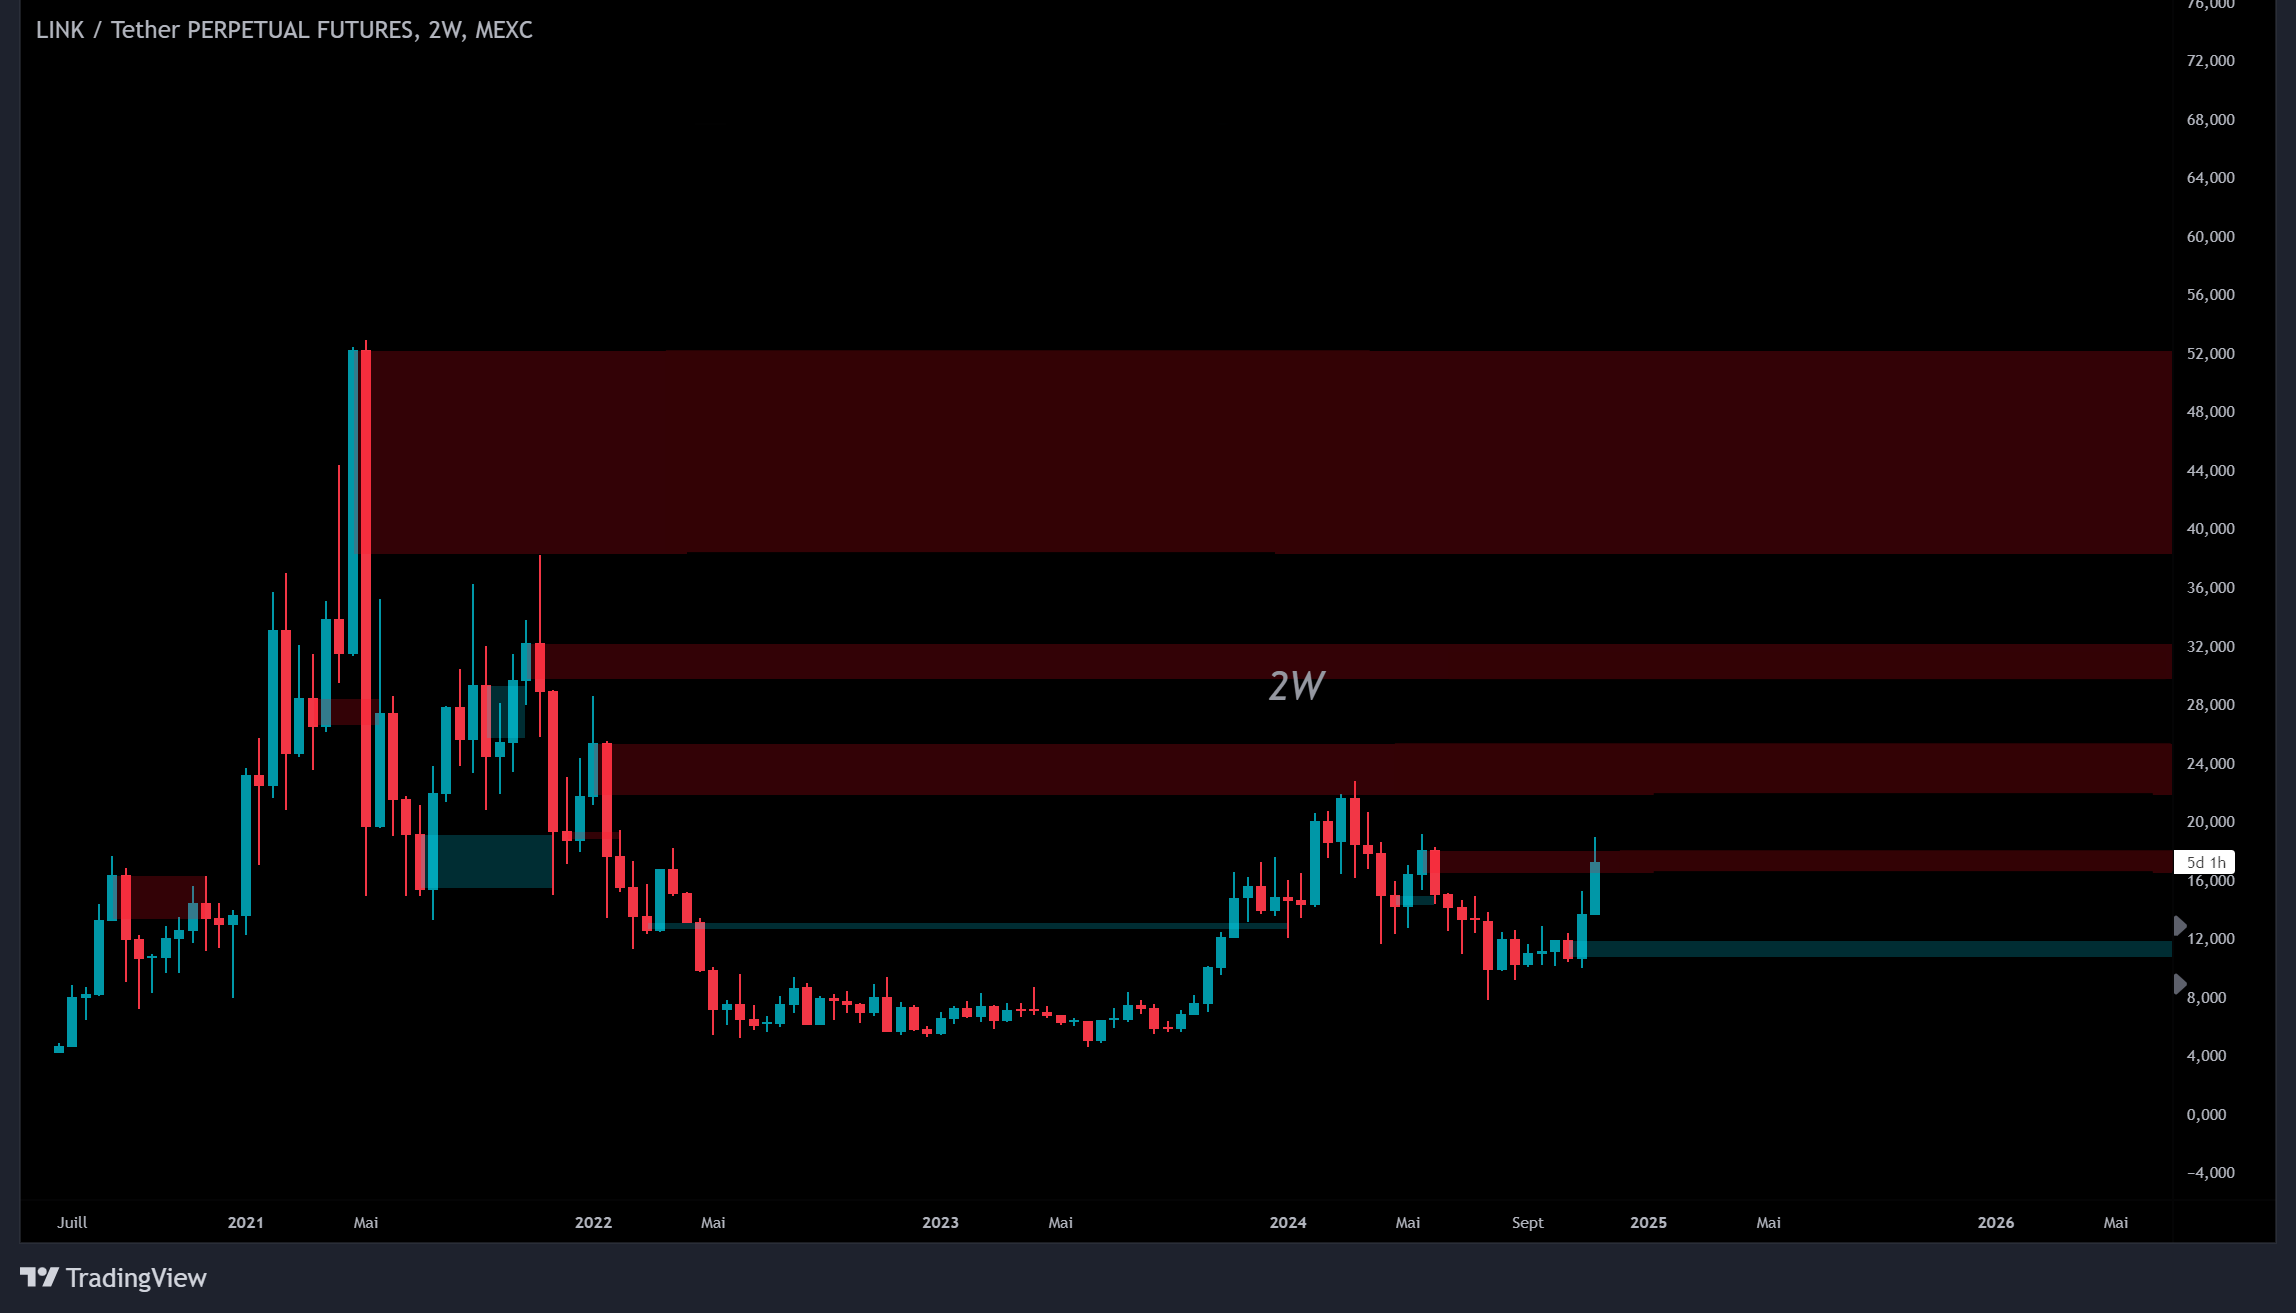
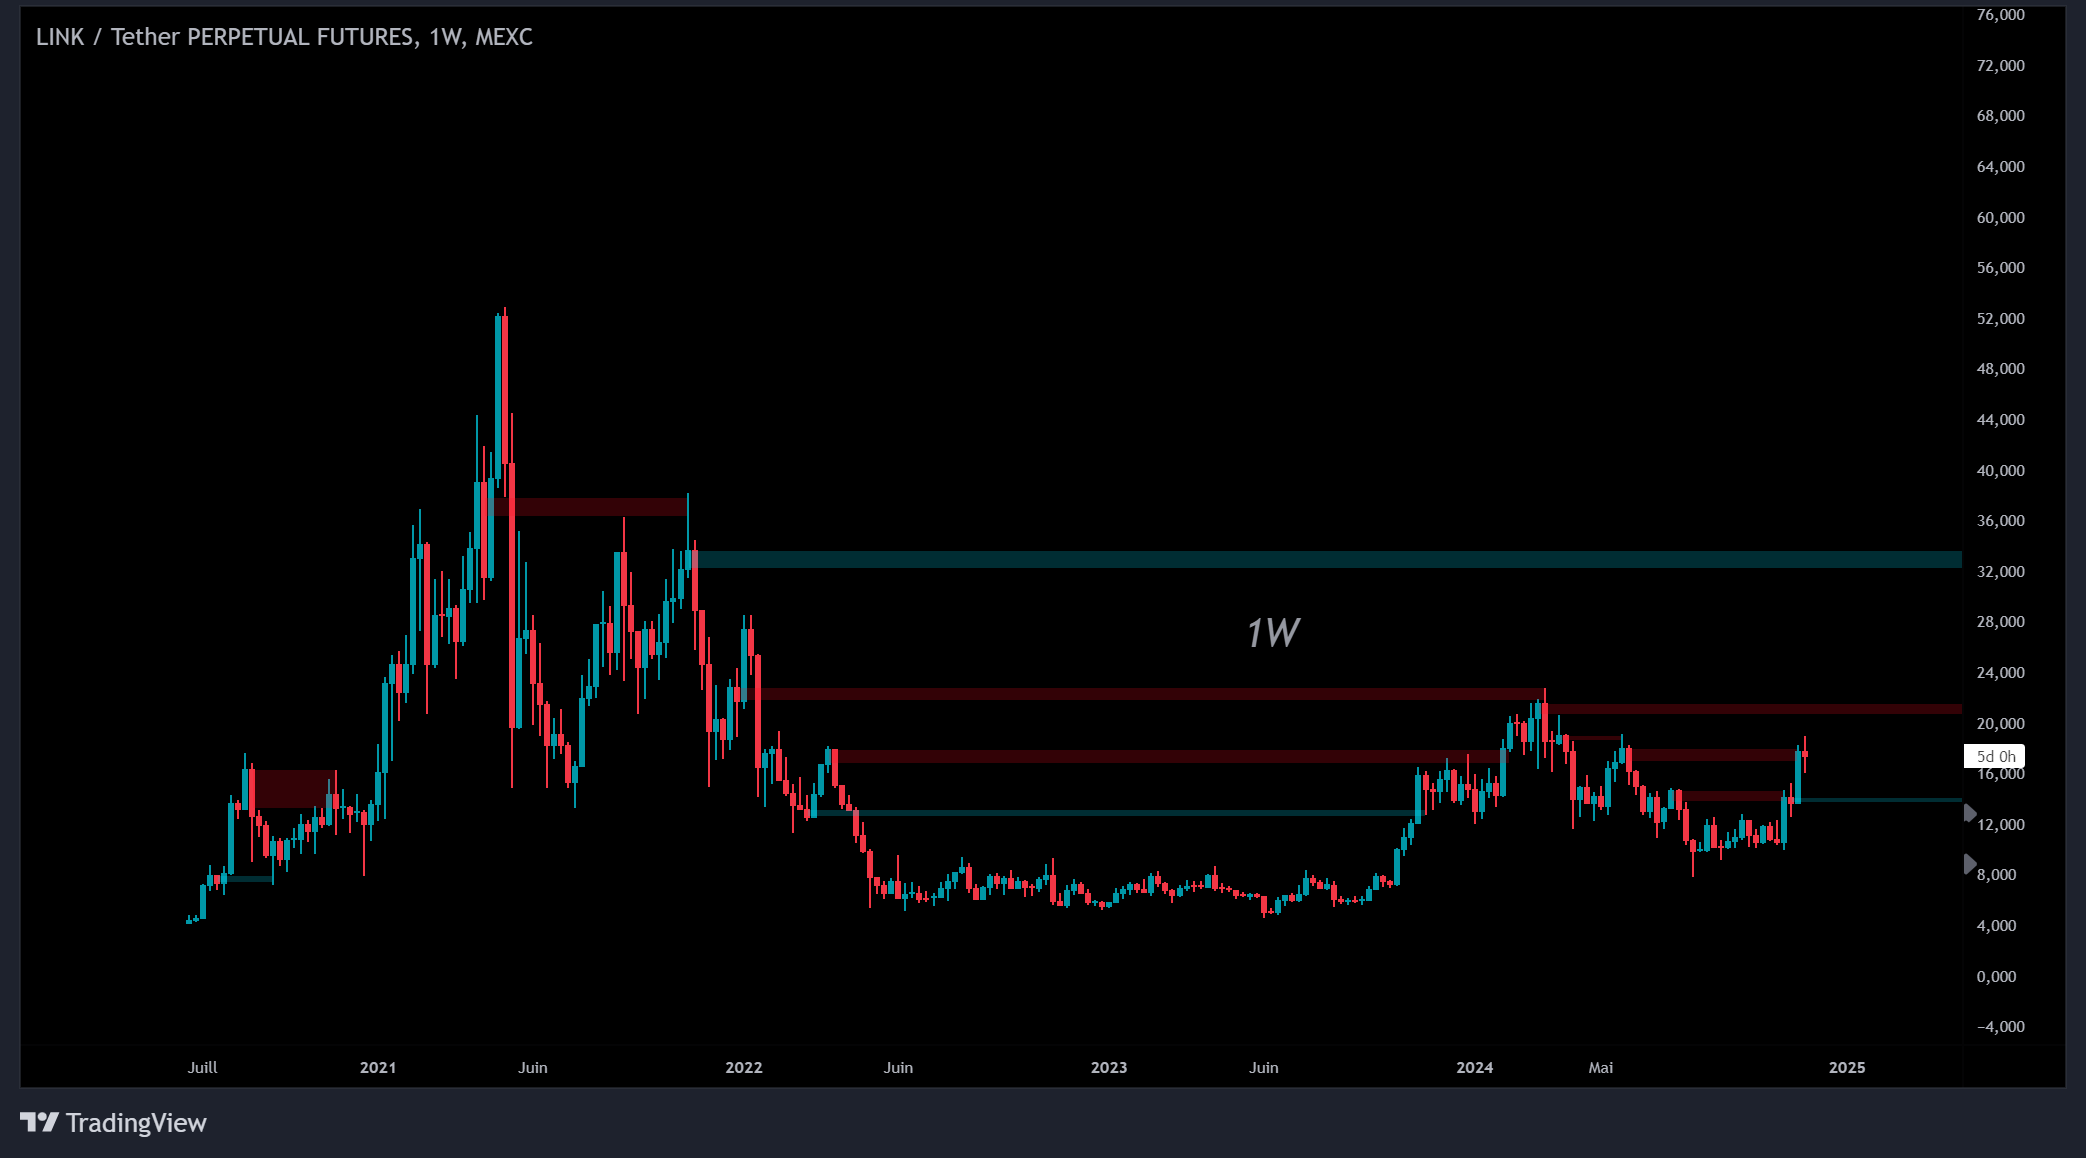
LINK example:
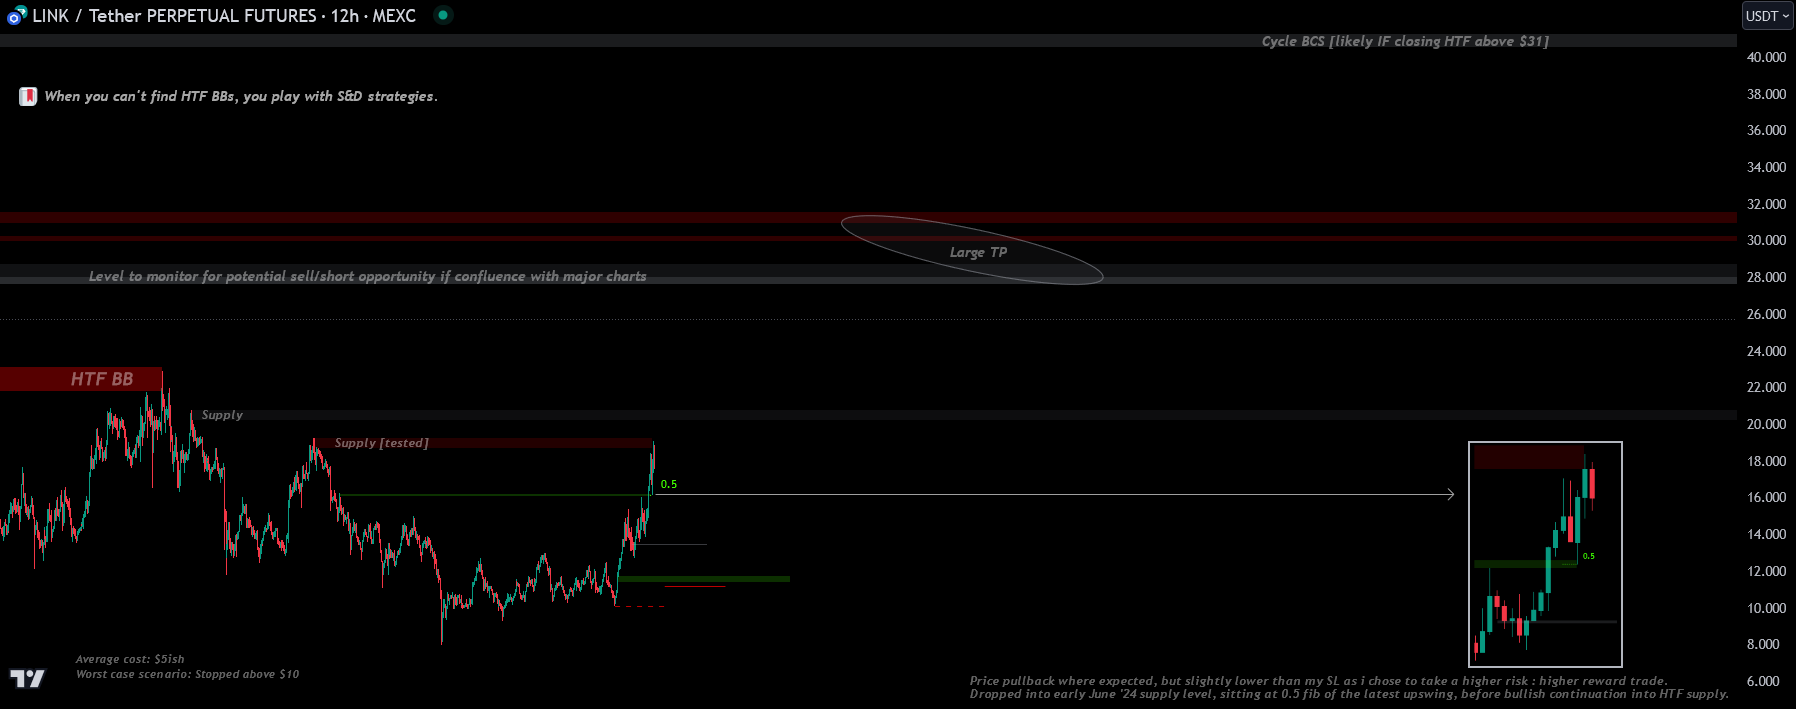
Buy with whales, sell with whales:
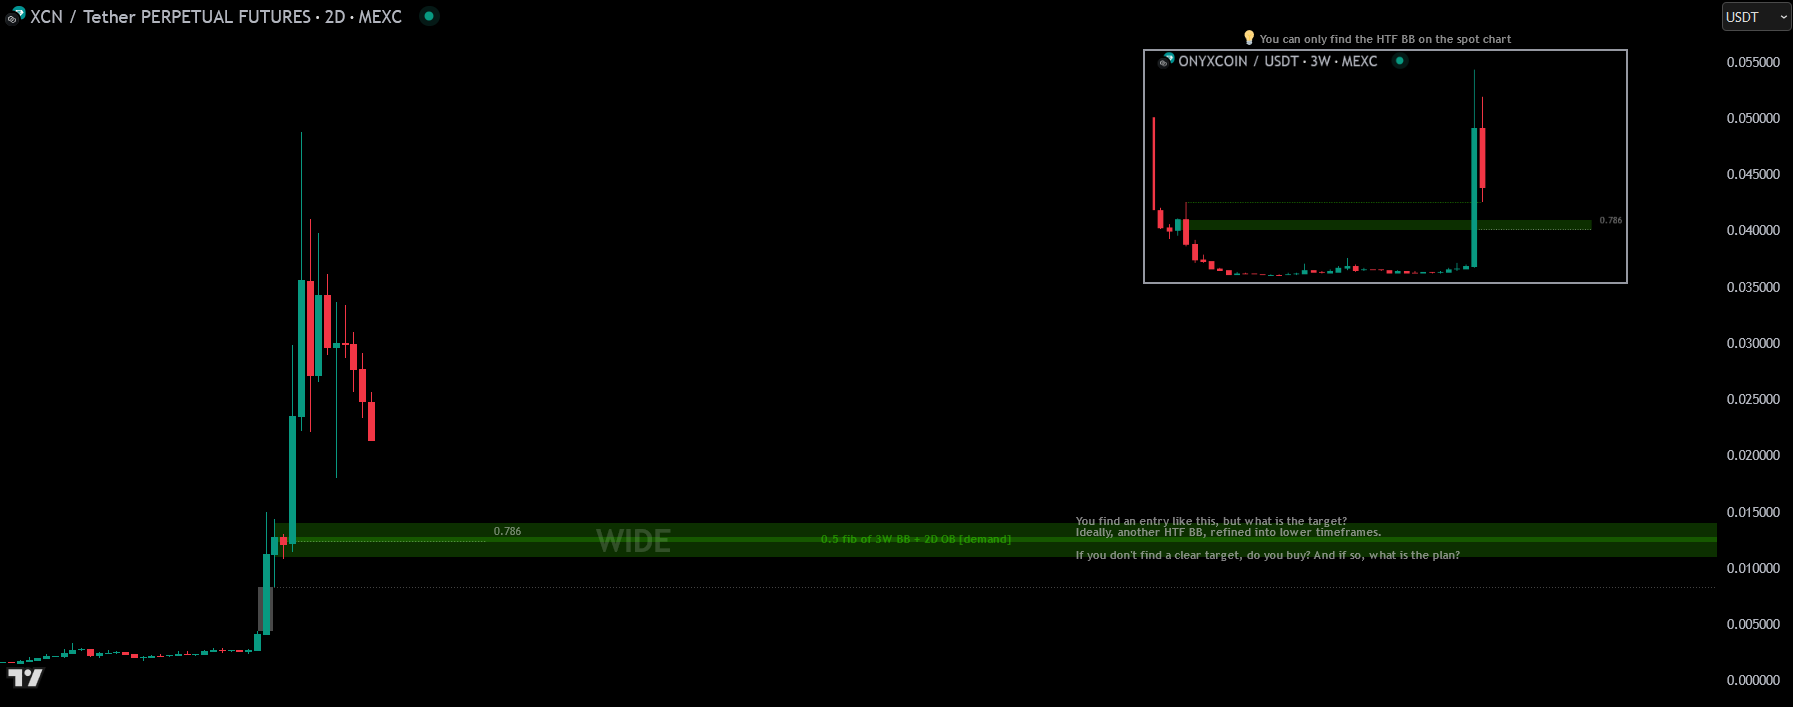
XCN — find an entry like this, but what's the target? Ideally another HTF BB at higher levels, refined into lower timeframes. You can only find the HTF BB on the spot chart.
BB at 0.5 of FVG
DBB perfectly aligned with 0.5 of DFVG:
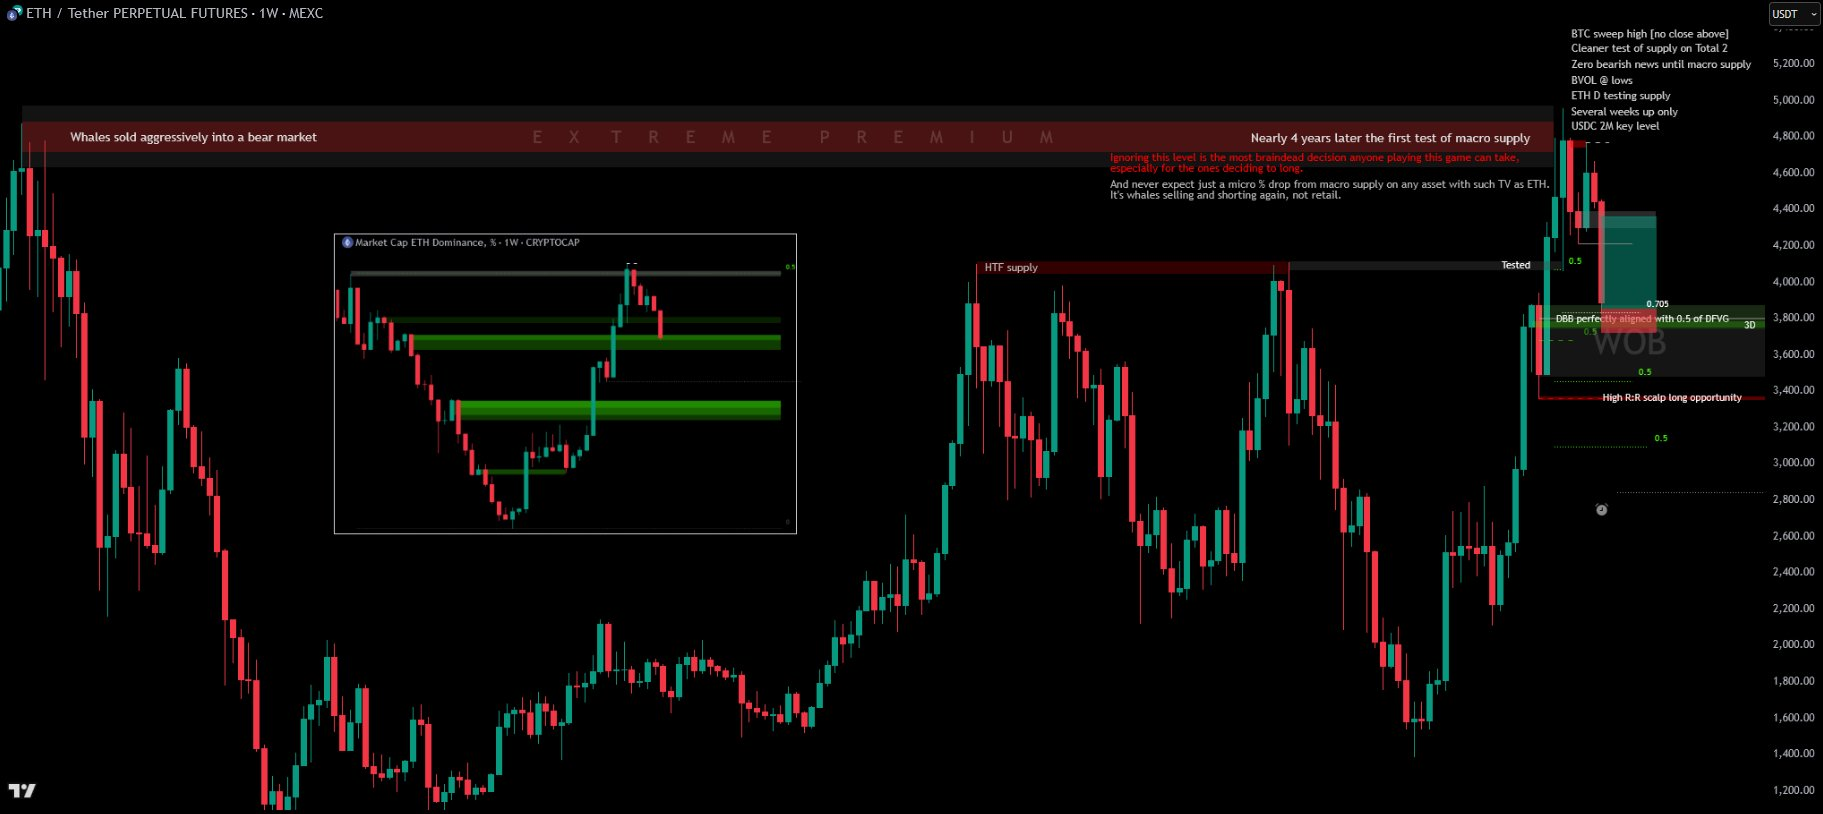

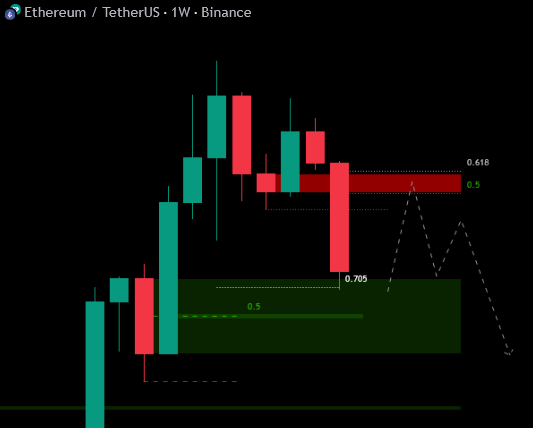
Ideal scenario is a move until WBB and bearish reversal back into WOB:
More BB Examples
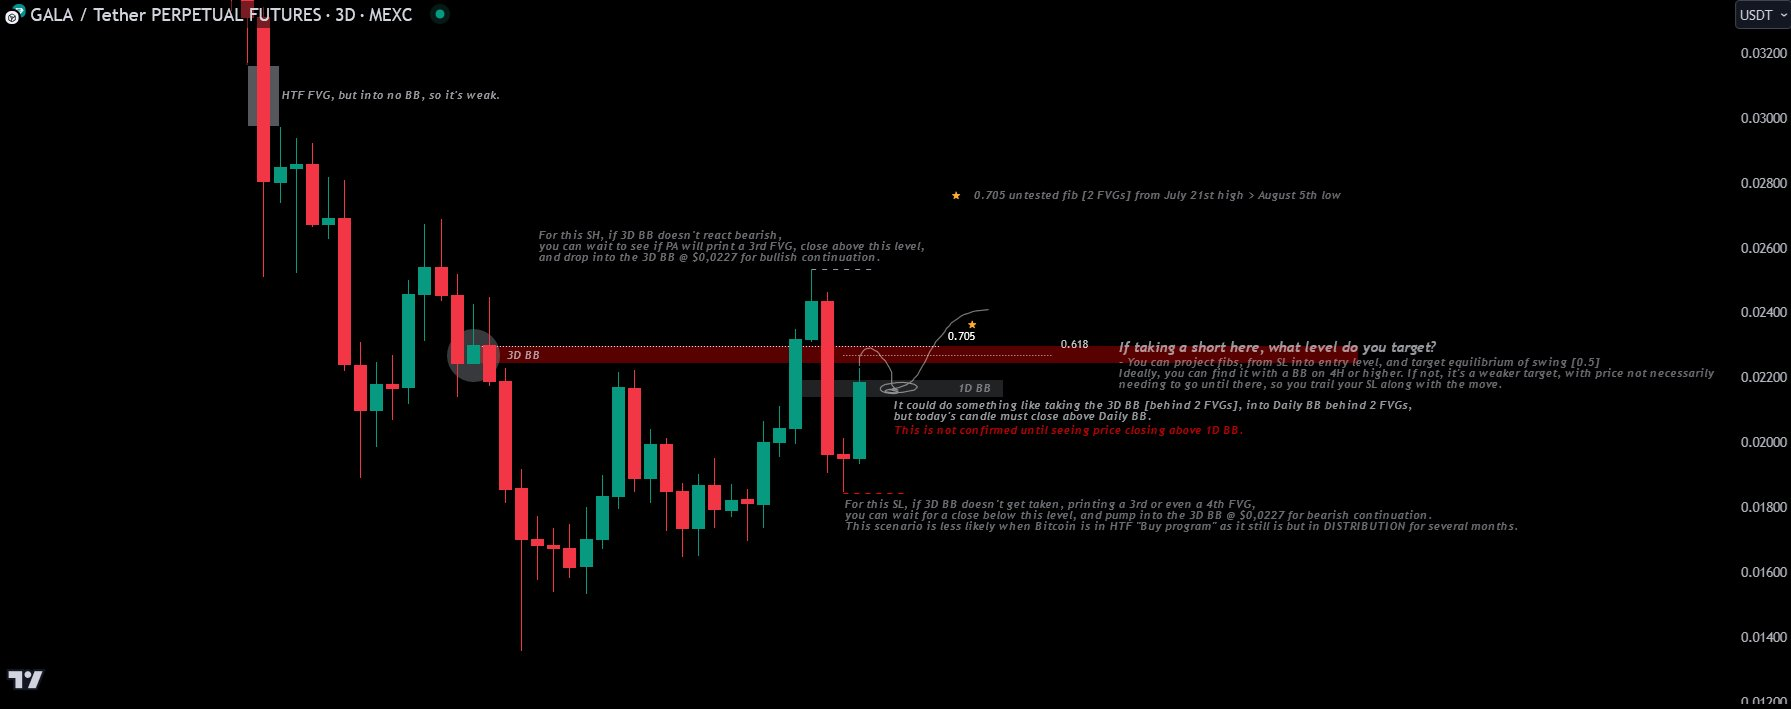
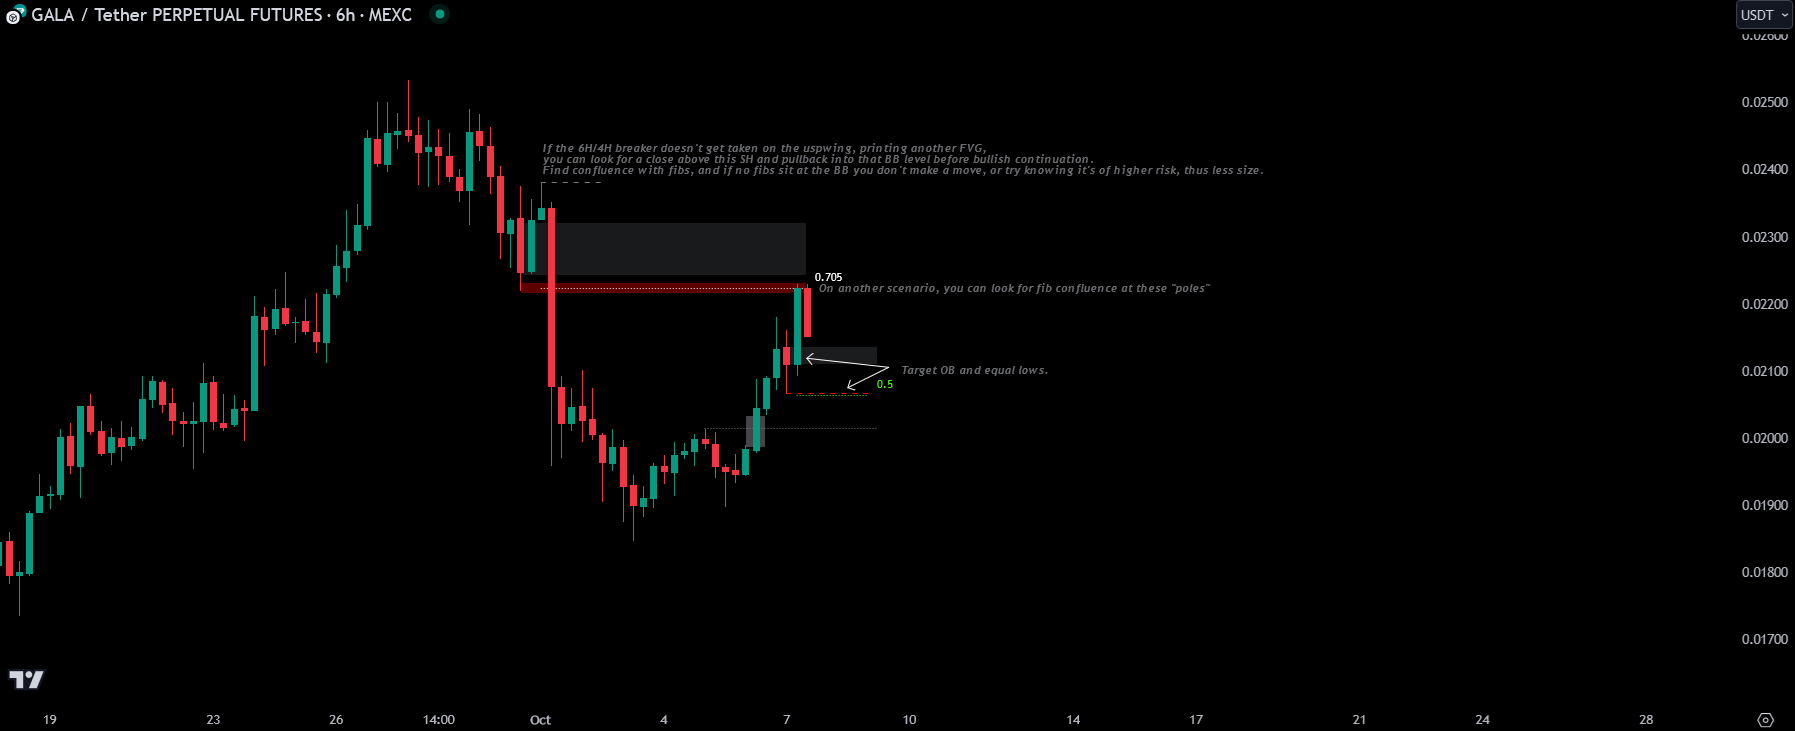
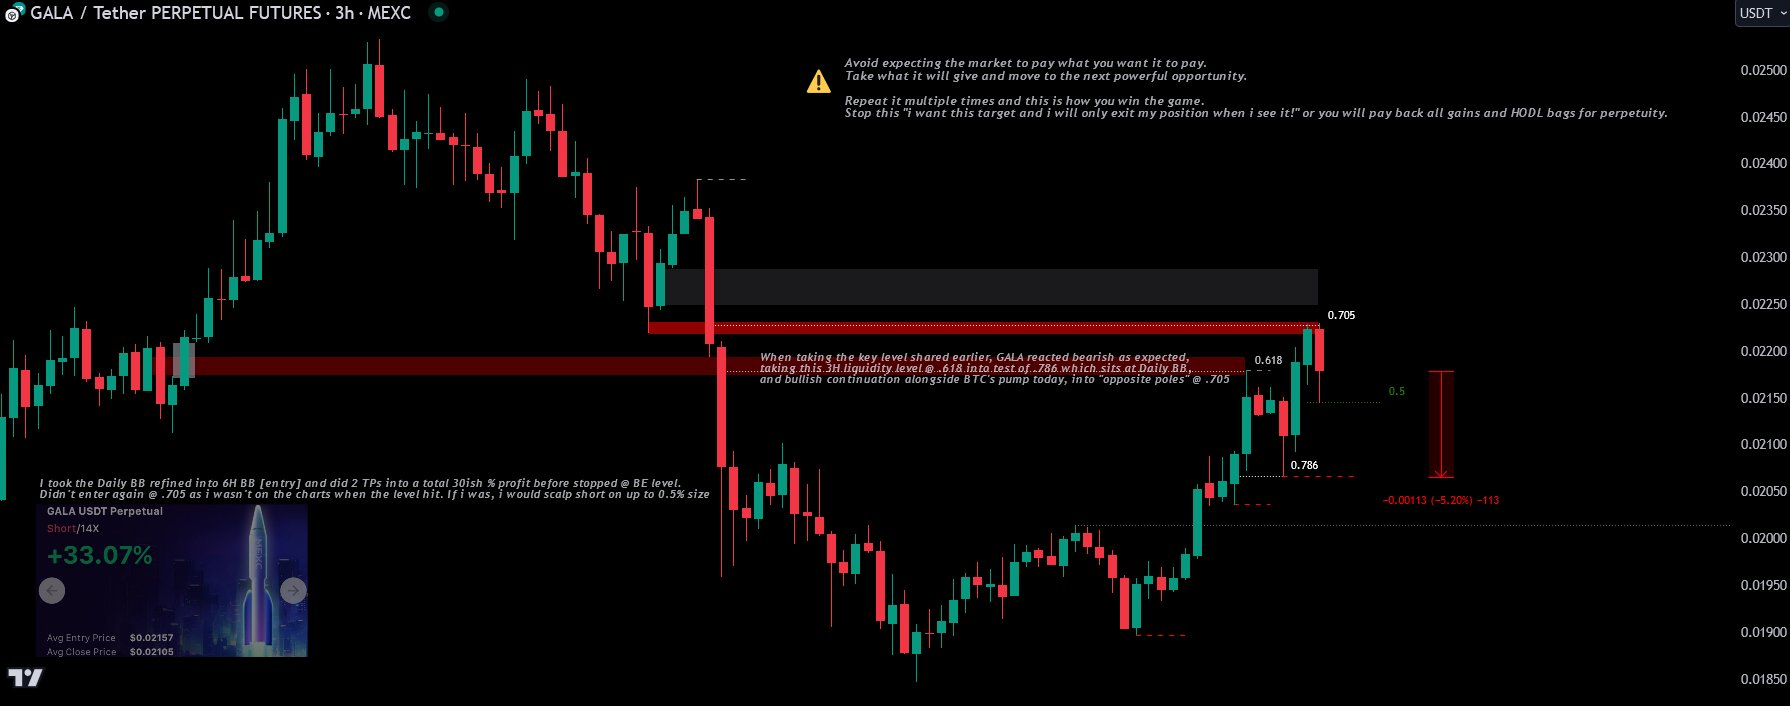
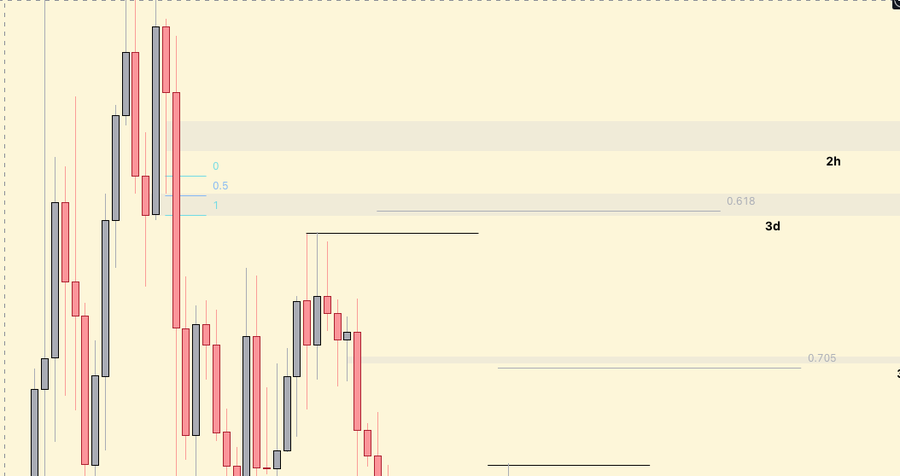
GALA 🎁 — 3D BB scenario with potential 3rd FVG before close above and drop into the 3D BB at $0.0227 for bullish continuation:
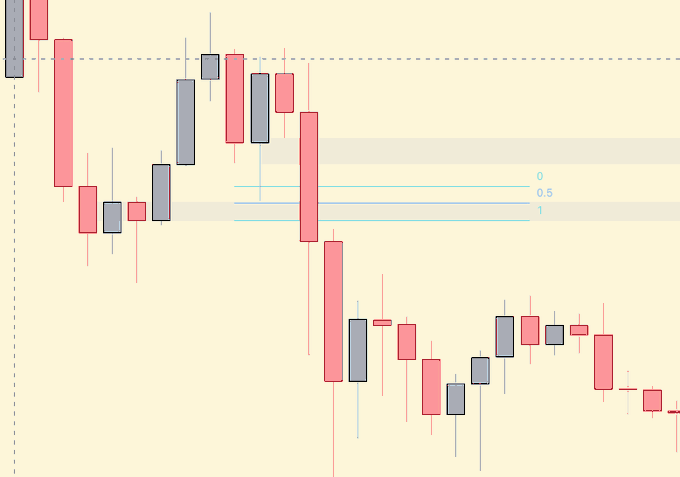
A daily wick at the highlighted level, but dig and find a 1H BB at GP:
XLM mooned straight into HTF BB:
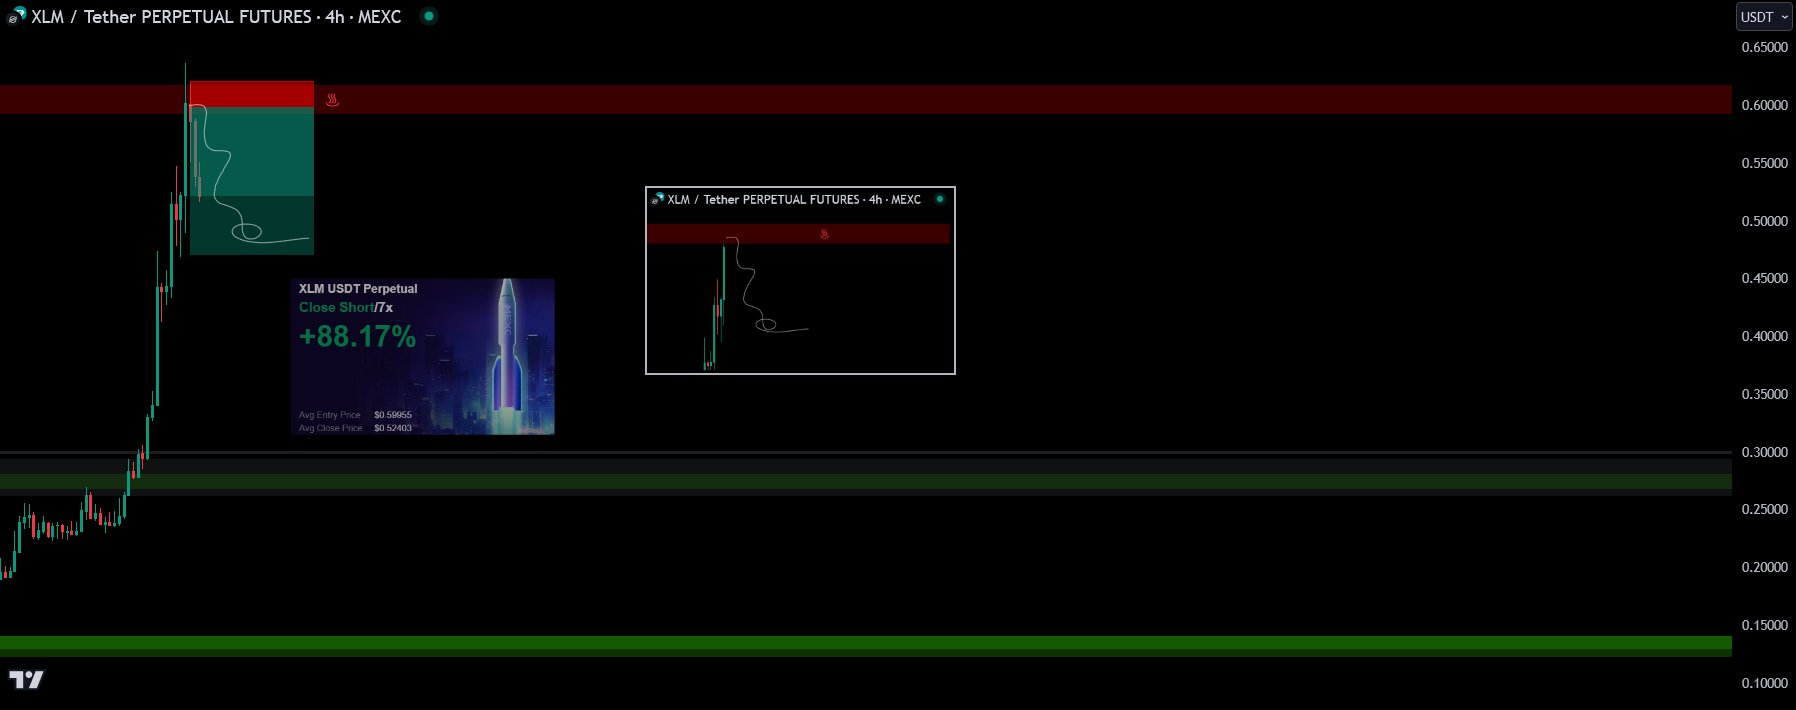
Shorting setup:
The start of December is likely the prime opportunity in this cycle to spot monthly and weekly BBs. Those FVGs printed on countless high trading volume coins are free money if you can spot where the fuel for another move is at.
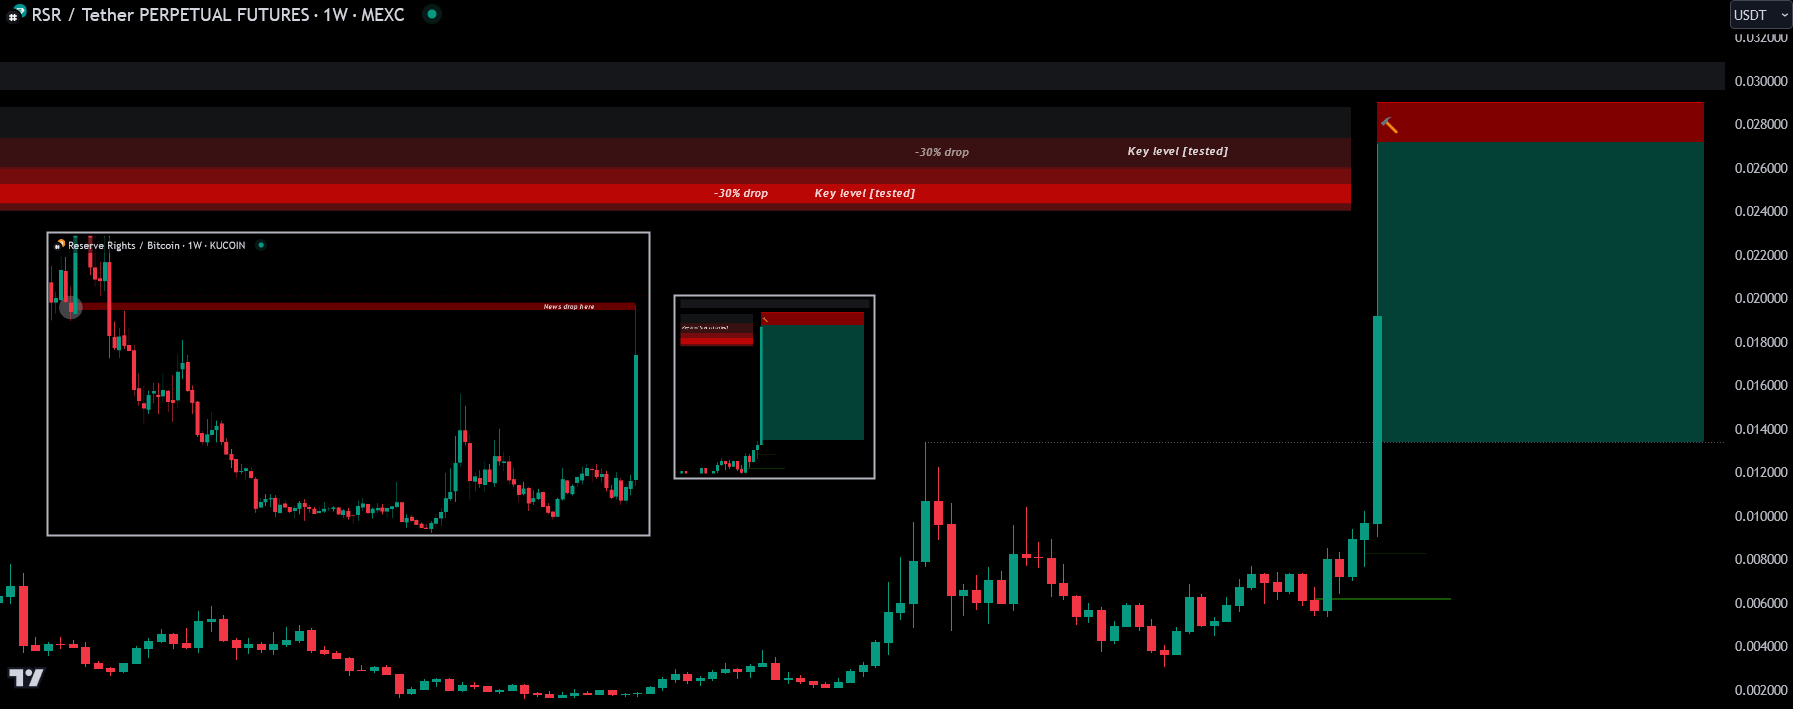
Special mention: bullish news conveniently hits CX right as RSR/BTC hits the Weekly BB. Timing like that is rarely a coincidence:
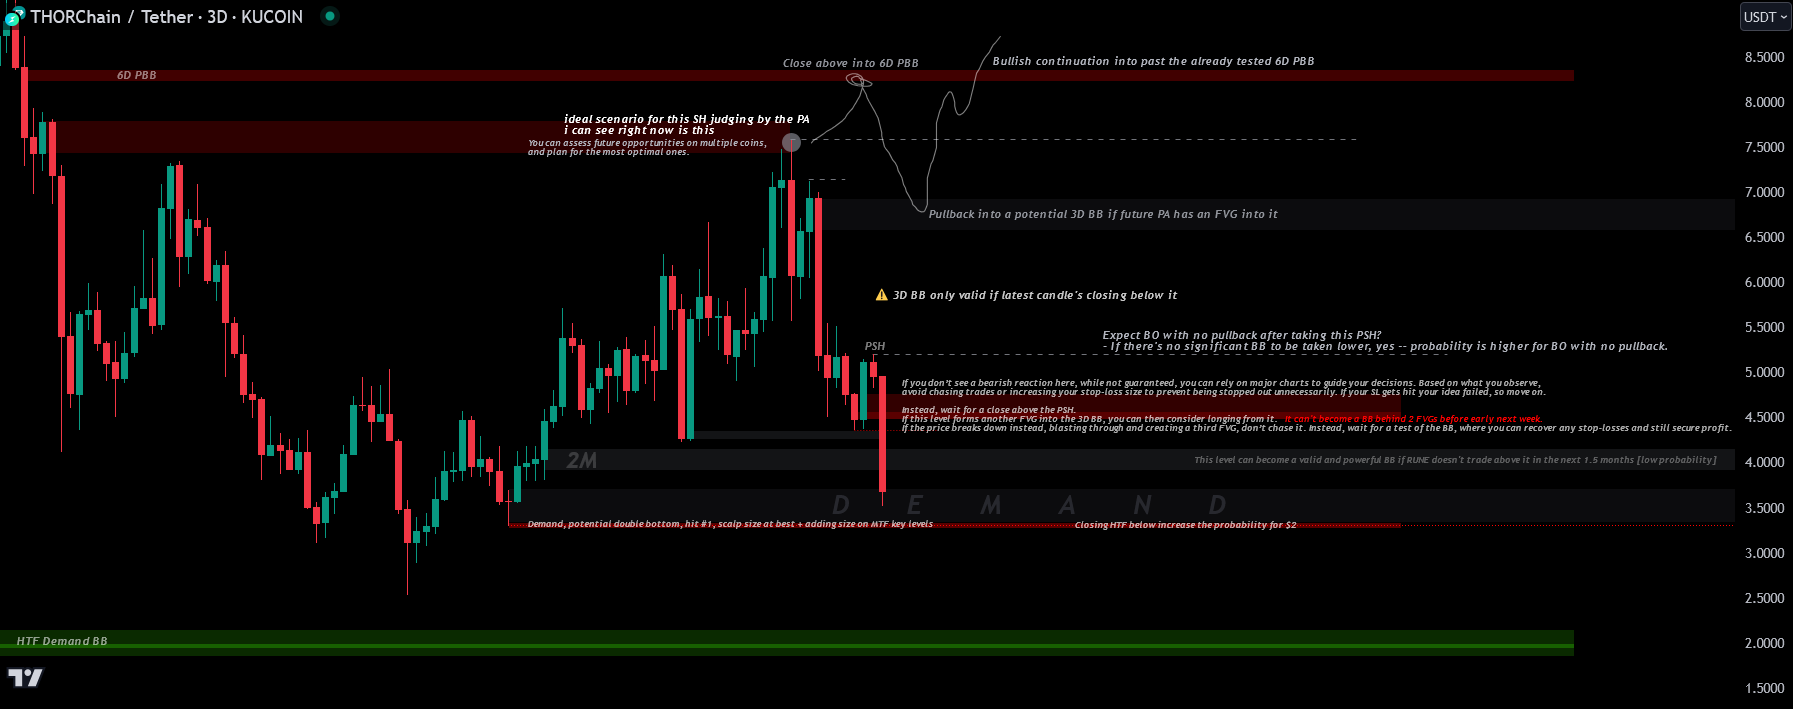
RUNE:
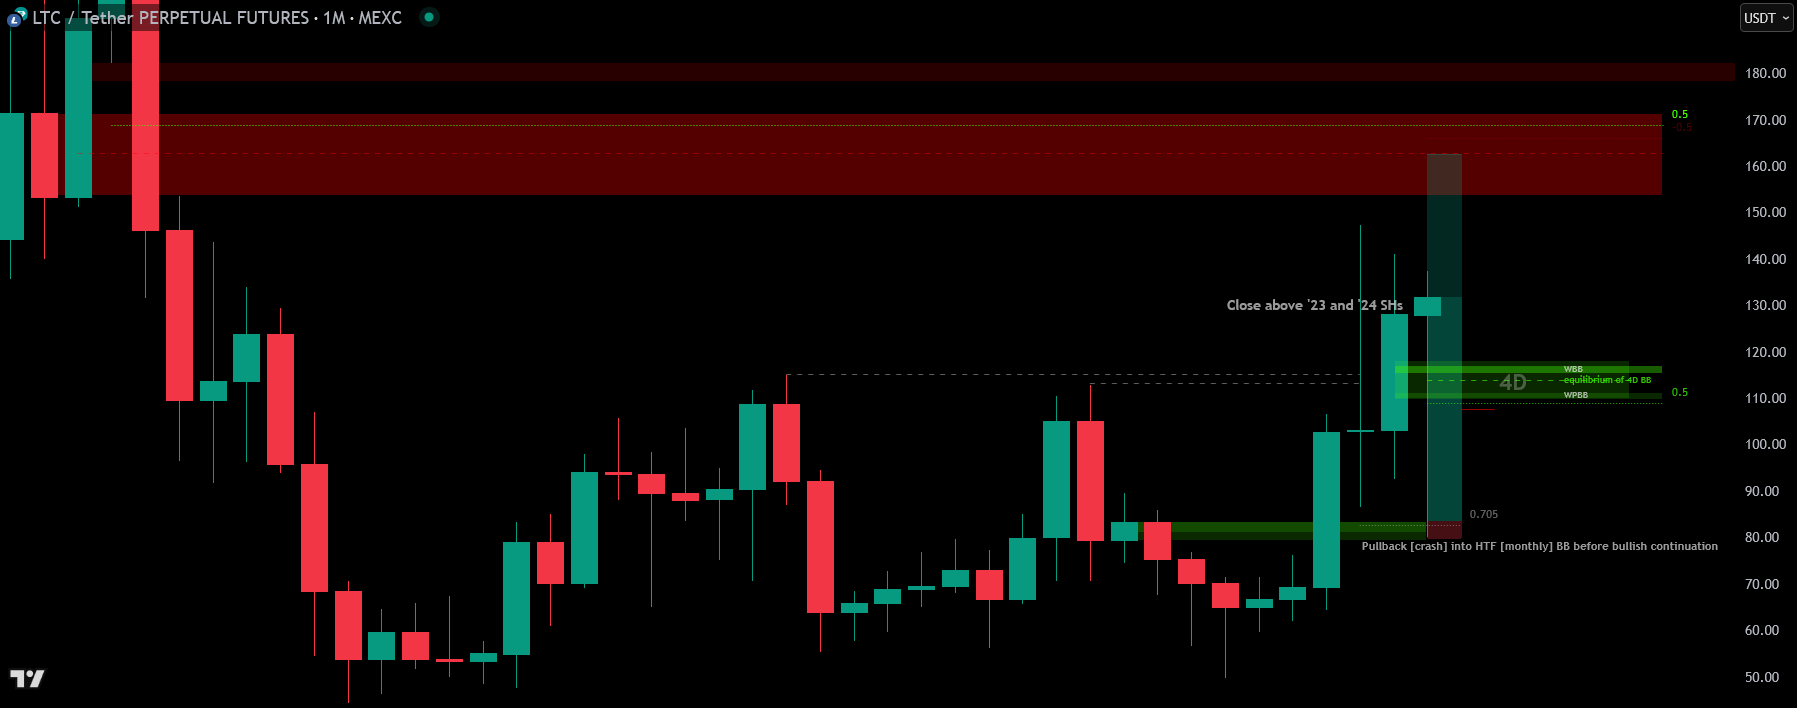
LTC monthly BB with pullback (crash) into HTF BB before bullish continuation:
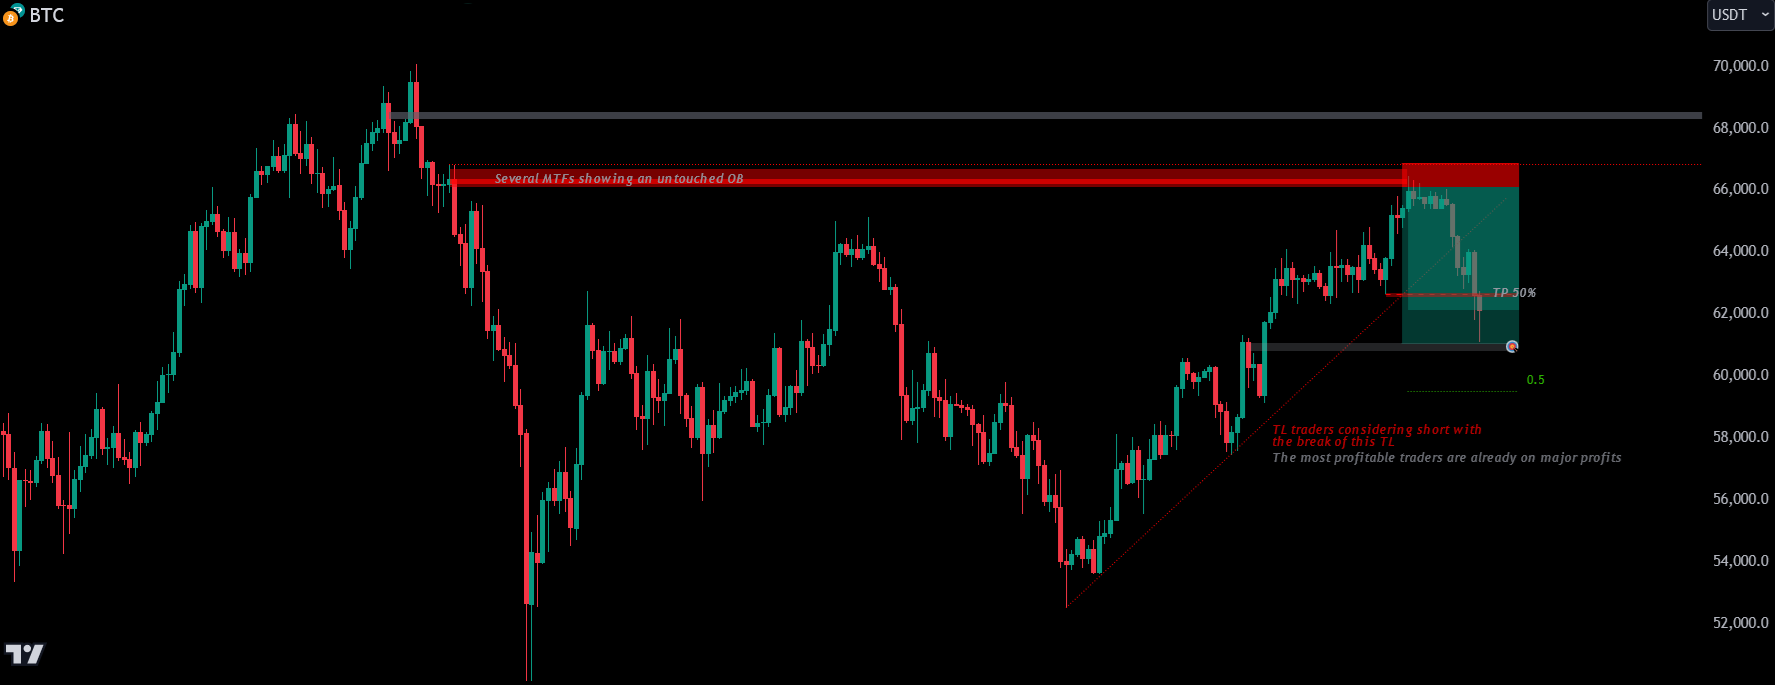
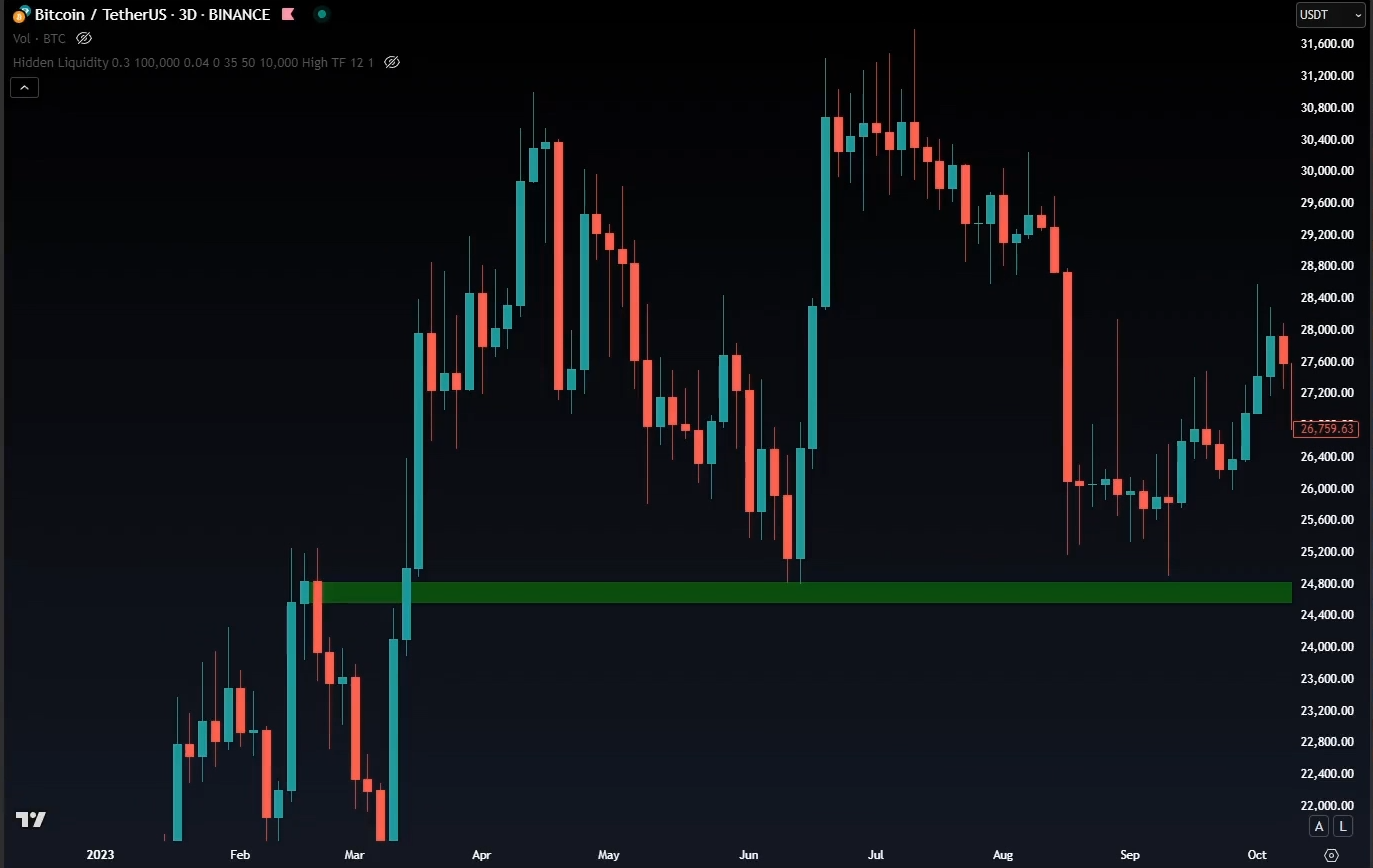
Bitcoin context:
The fact alone that 2x or 3x BBs exist shows they don't always work as reversal points initially. How do you avoid running SL? Study VSA (Volume Spread Analysis). If there's a significant difference between volume (high) and price (not volatile), it's showing institutional traders are placing orders.
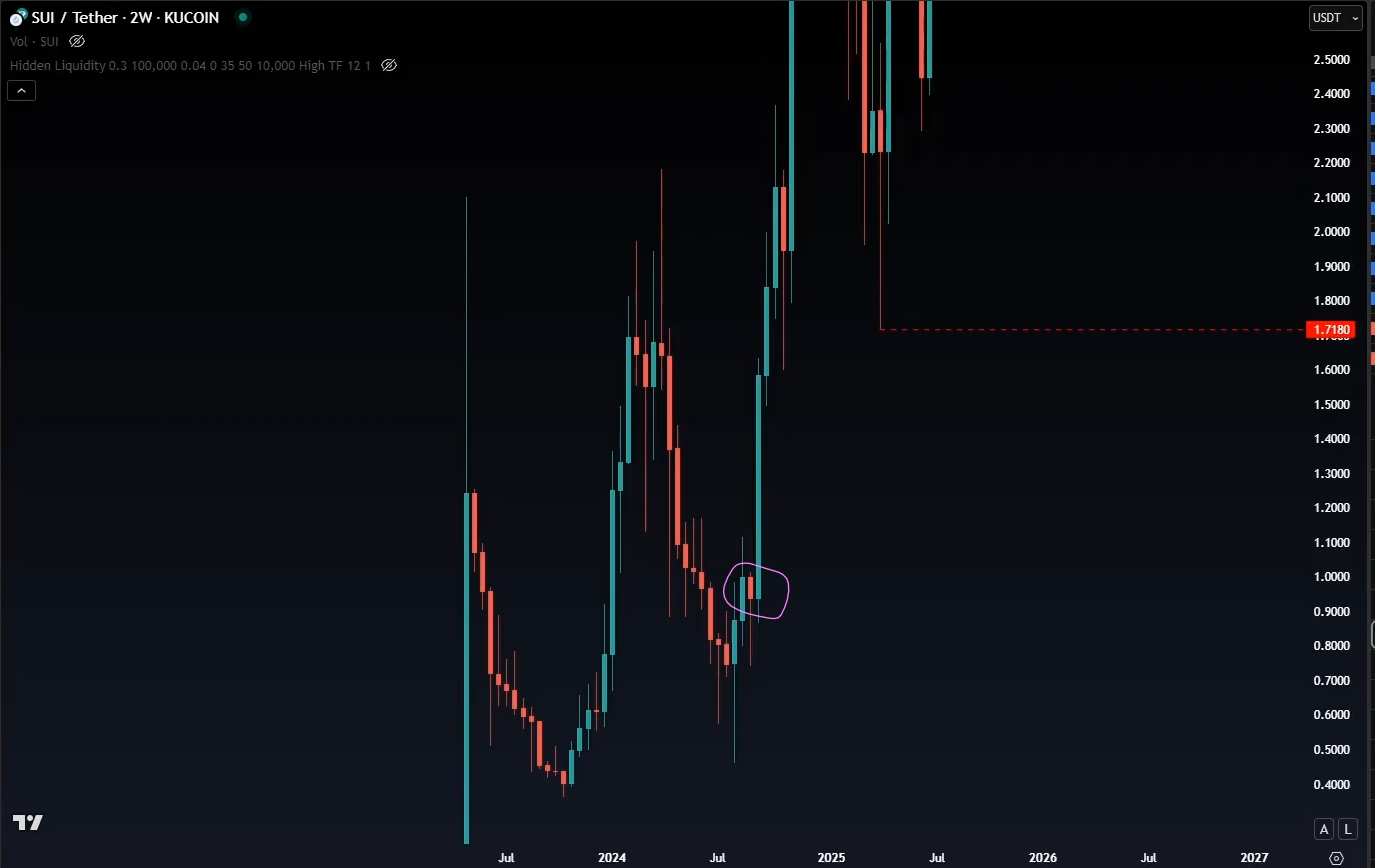
Clean BB on SUI:
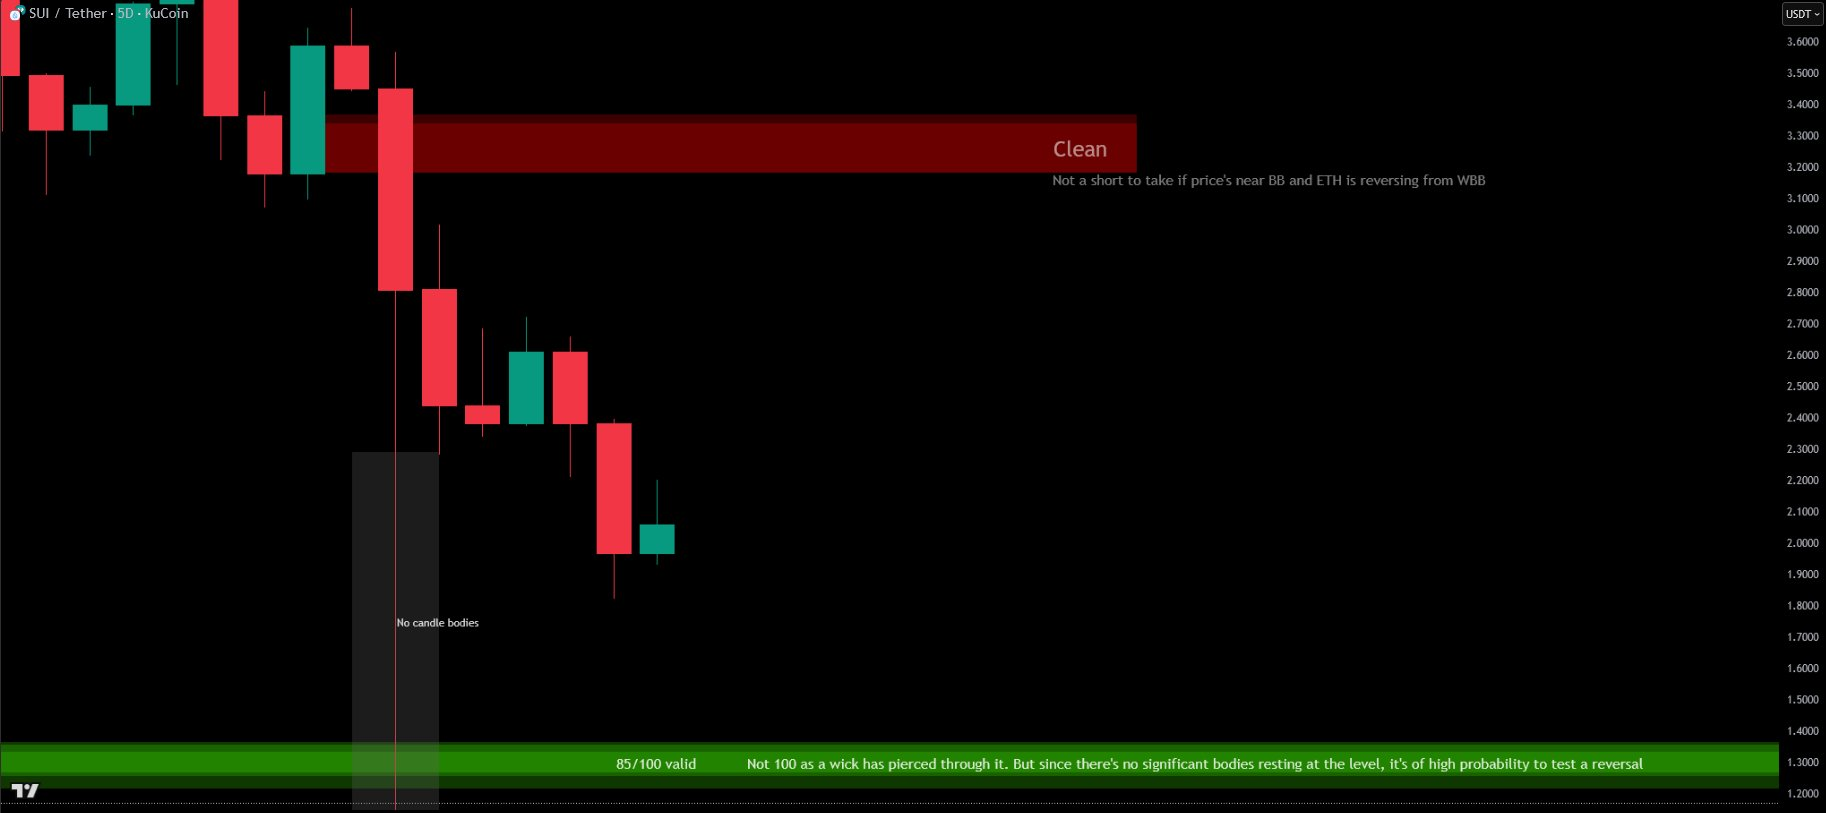
What if there's no SH broken yet? If that happens and price closes below that low, the test of BB is bearish and you expect bearish continuation:
Even high trading volume coins like SOL ran past FVGs with decent-sized breaker blocks — that's a buy program ignoring BBs to later pullback before continuation. See Buy & Sell Programs and Dino Coins:
There's far more value in a few solid X gains from "Dino Coins" with ample liquidity than chasing shitcoins boasting a 50X pump where cashing out anything meaningful is nearly impossible — unless you're the scammer owning 95% of the supply.
Hidden Liquidity vs Breaker Block — A Refined View
A useful sub-classification within hidden order blocks. Some traders separate "hidden liquidity" (fully behind an FVG body) from "breaker blocks" (majority behind, but with some wick contamination):
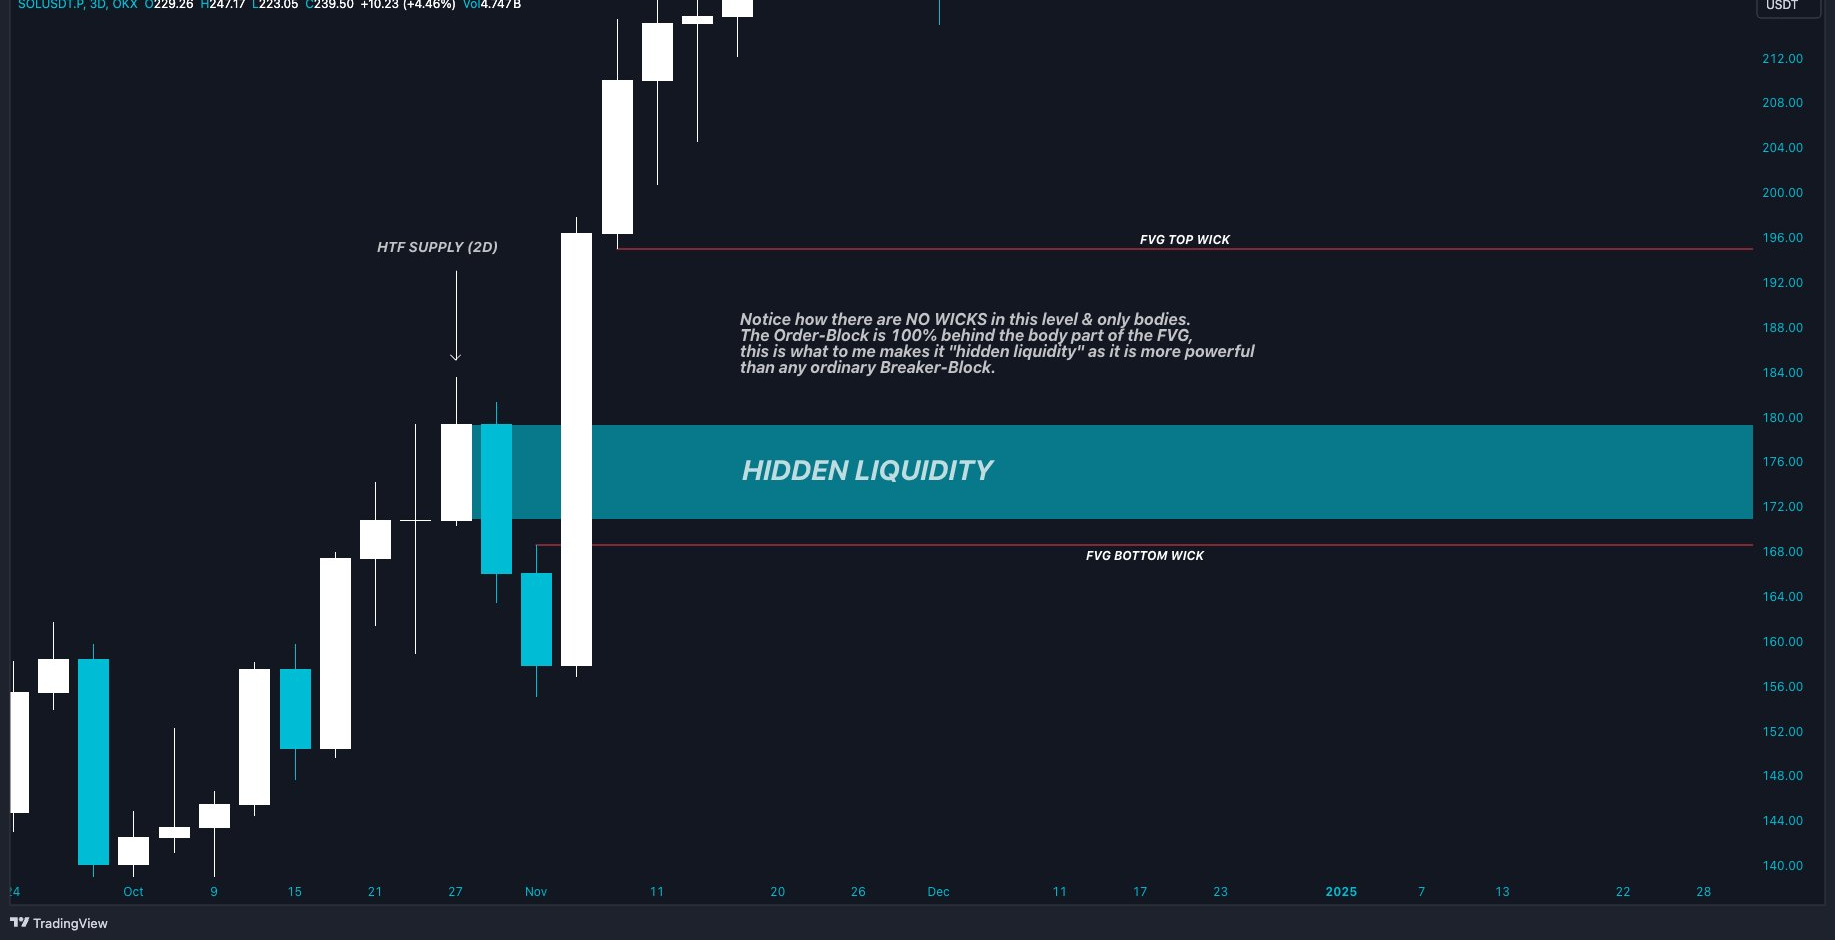
Hidden liquidity = an order block fully behind the body of an FVG. No wicks in that level. The most powerful form of order block. Specifically named "HOB" rather than "BB" for that reason.
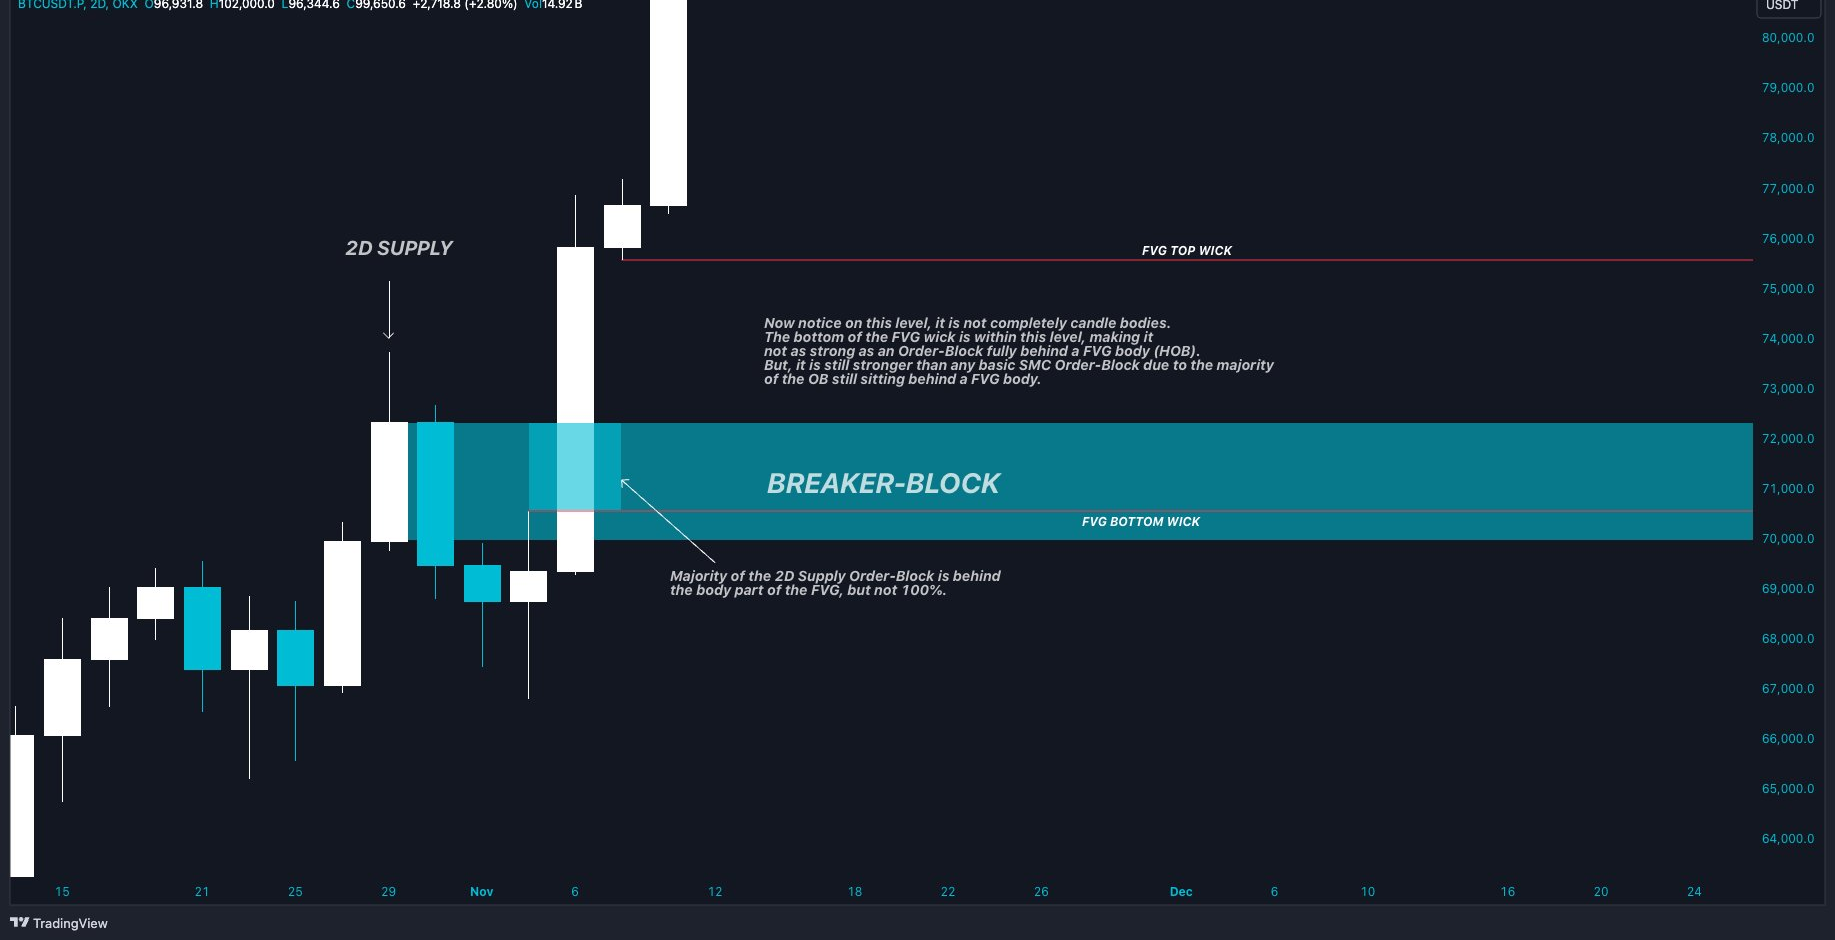
Breaker blocks = an order block behind an FVG but not 100% behind the body of the FVG (often what students call Partial Order Blocks). As long as it's behind the majority of the FVG body, it's still considered powerful — but not as powerful as fully hidden liquidity. The bottom part of the FVG wick sits within the level, so the OB doesn't sit behind 100% bodies, but also minority wick.
This also applies to wicks occurring prior to the FVG. If a basic supply or demand OB becomes partially taken, then later becomes ignored causing an FVG in front of it — that's also a breaker. As long as the level is majority behind an FVG body, it's a worthy breaker. But that means it's been tapped outside of the FVG candles, making it weaker than untapped breakers.
You don't have to adopt this sub-classification. If you're a student following multiple traders' charts, just be aware of the system — fully hidden vs majority hidden, separated by power.
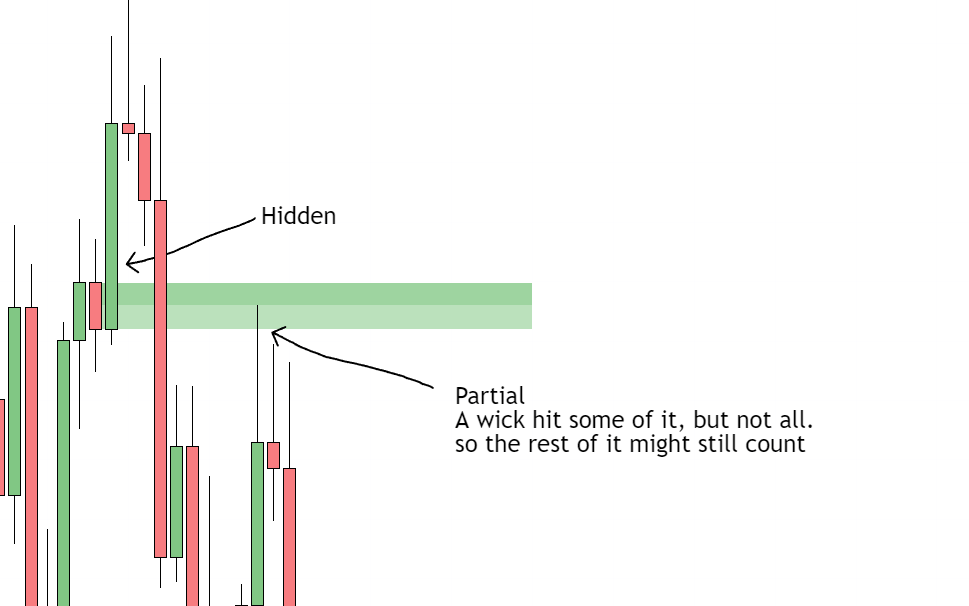
Partial Order Blocks (PHOBs)
Partial blocks are the messy middle. The OB has been touched, but not fully — so part of it is fresh, part is consumed. They have power, but less.
There's a difference between OBs and BBs.
If an FVG hides a bit of the OB, do I take the level as the entire OB or only the part of the OB not hidden by the FVG? Or just ignore the entire level?
Avoid partial blocks when there's plenty of fully untouched ones on other coins.
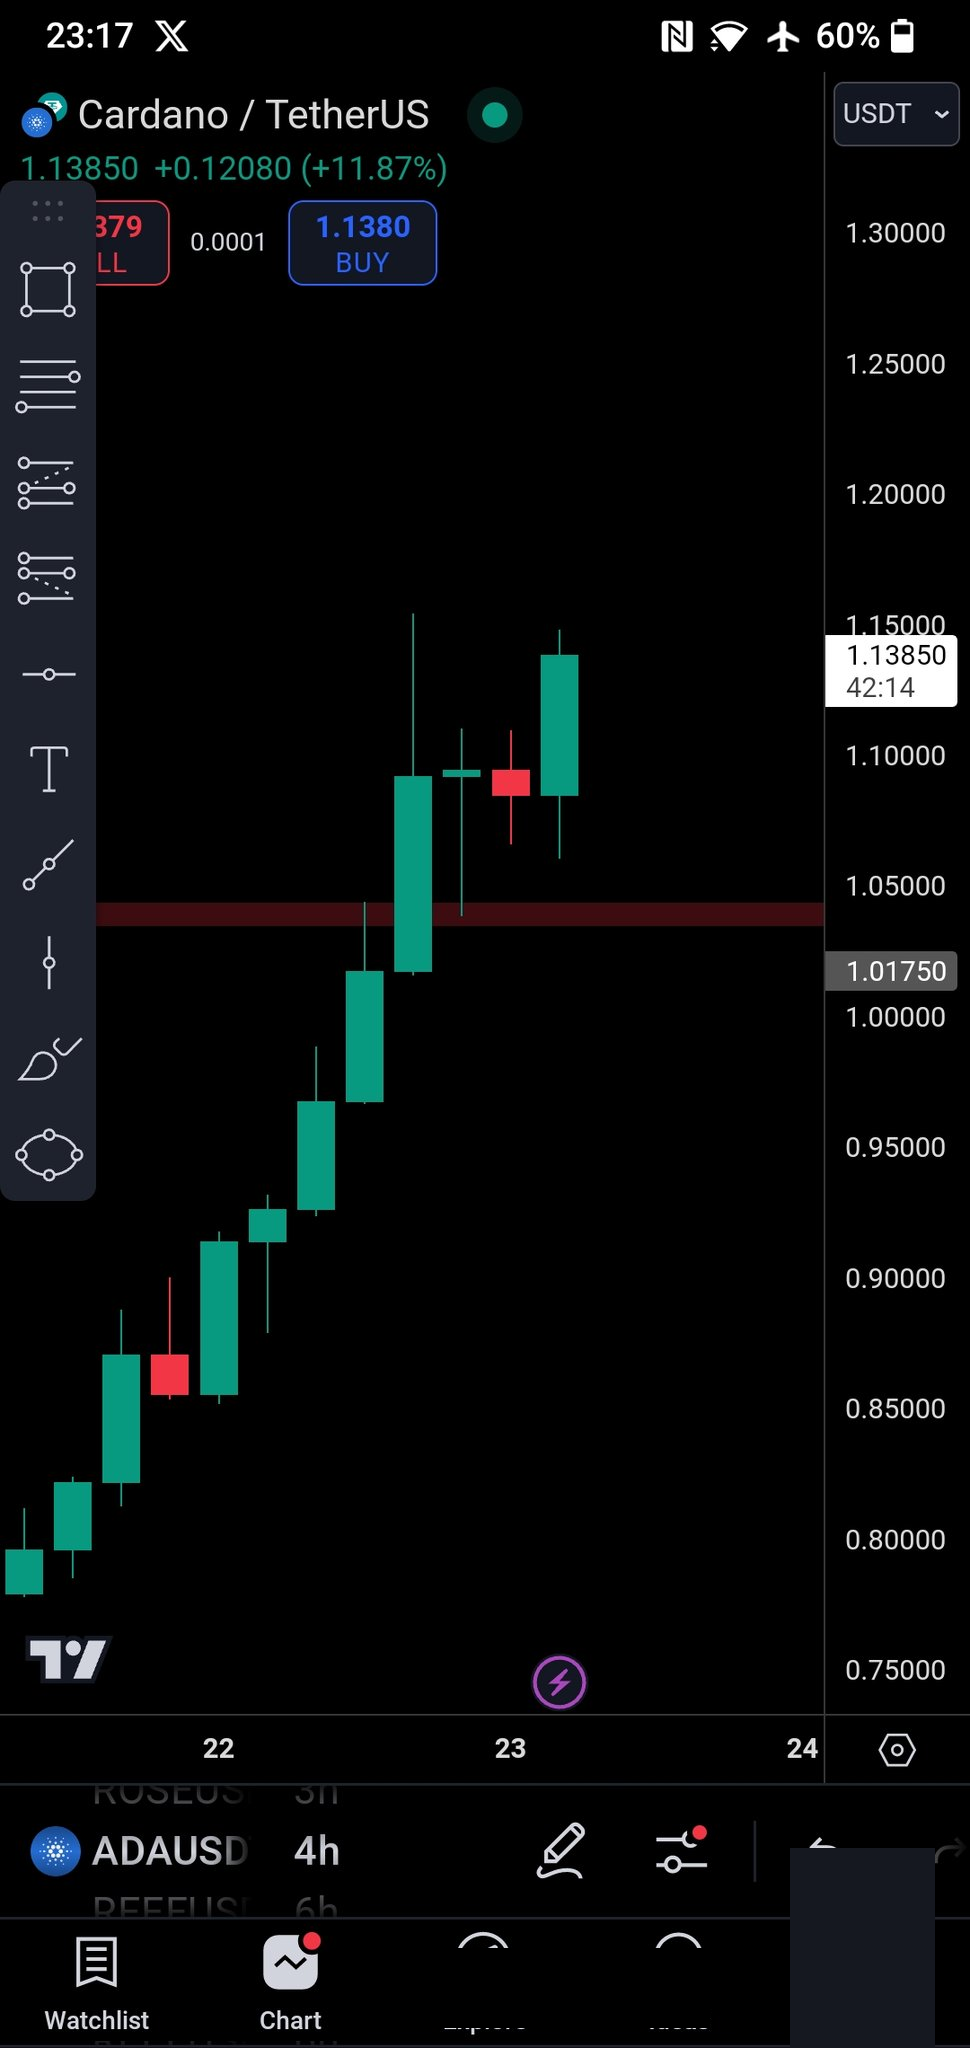
ADA partial:
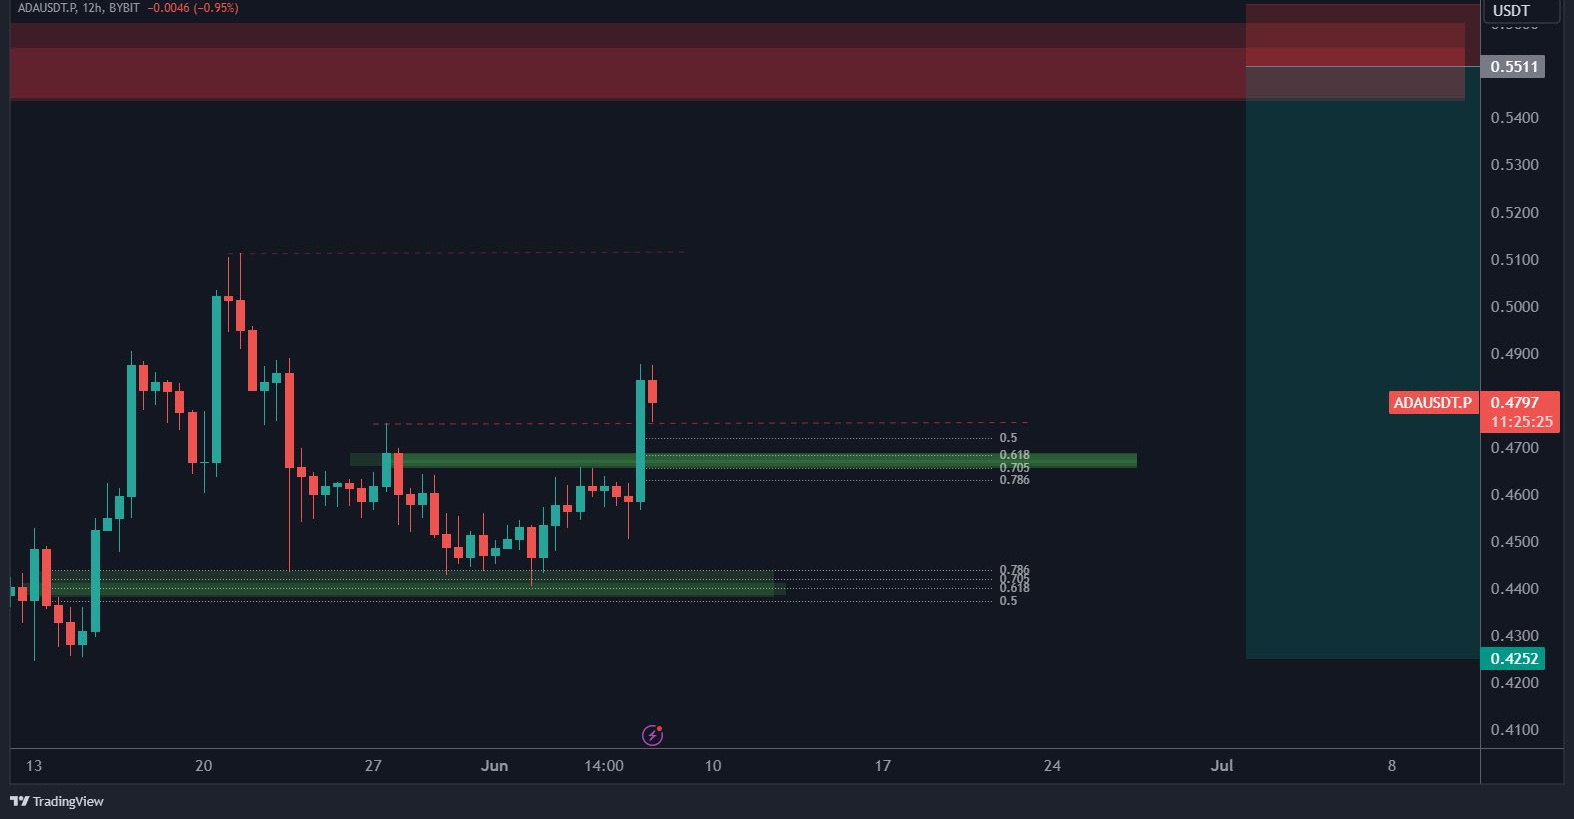
Avoid Partial Order Blocks when there are plenty of fully untouched ones on other coins.
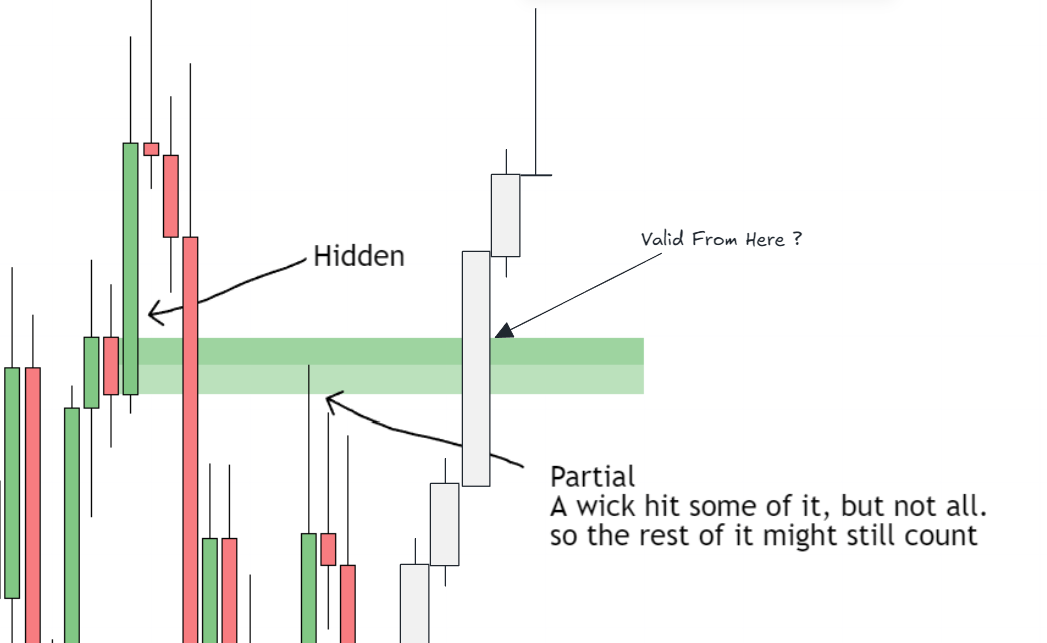
How Much Can Remain Fresh?
Is there a rule for how much of a partial should remain fresh, since it gets weaker the more it's tapped? Or is it just by experience?
0.5 fib, and experience. Sometimes all that's there is a 1/4 of a BB, so price will likely reverse there if there's nothing else to be found. The fib is placed on the BB itself — if more than half of it is tapped, it's invalid or very weak. See MINA 🎁.
I look for HOBs within pHOBs. If I can't find any, I risk less or ignore.
Why Partials Can Still Fail
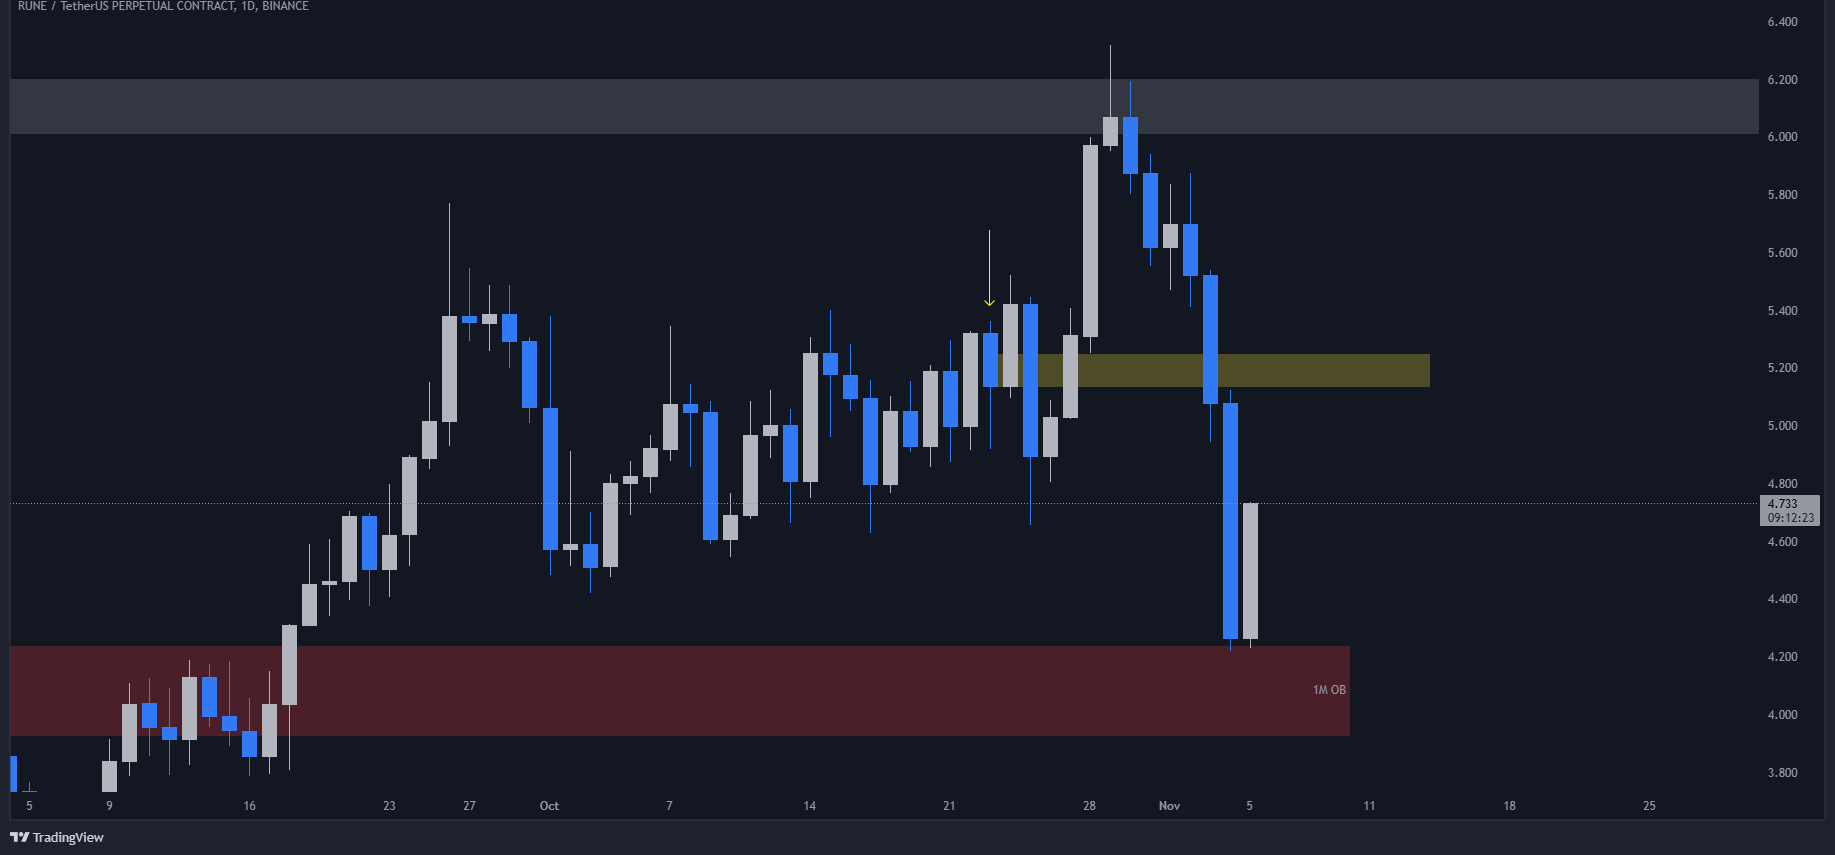
RUNE example — went straight through with no retracement:
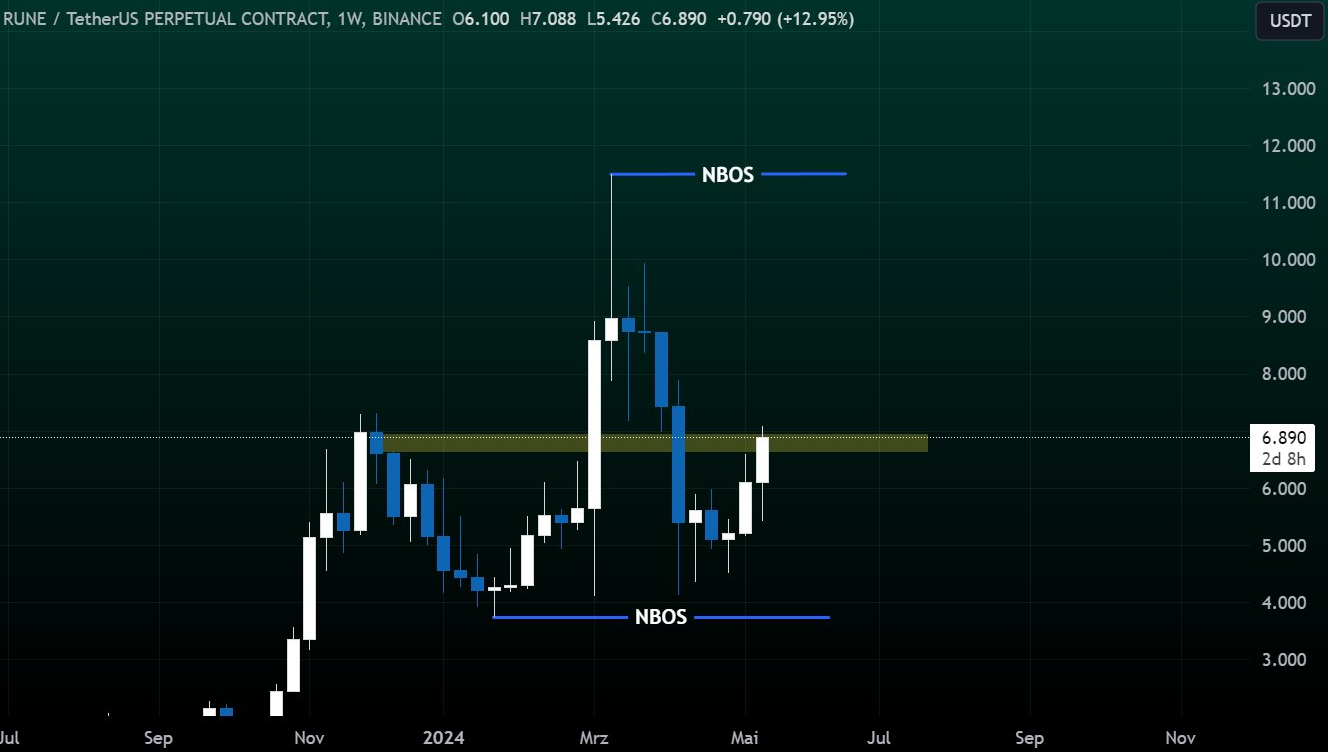
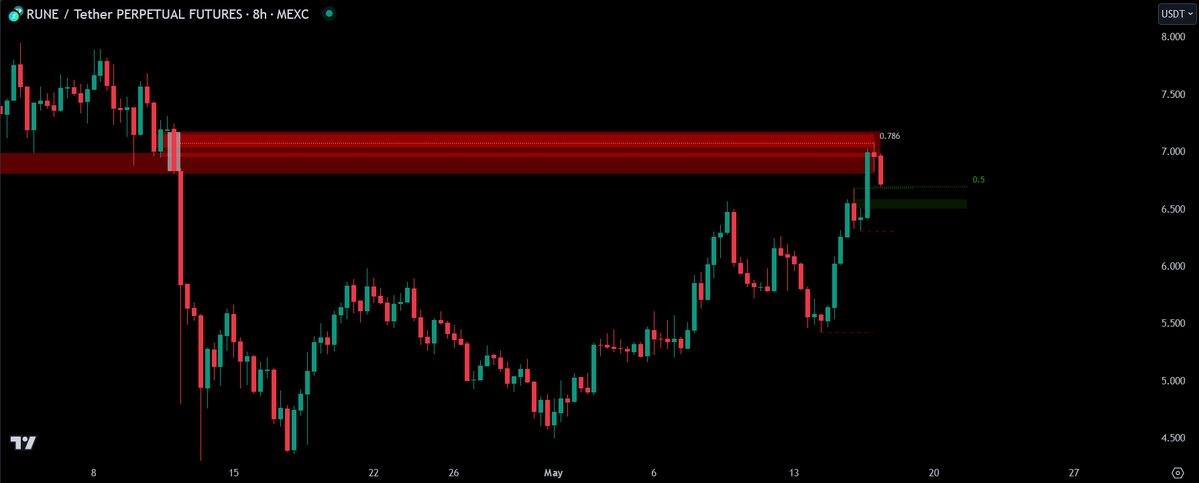
Nothing has 100% success rate. This wasn't a full clean block — it's partial (weaker), with Bitcoin giving momentum to altcoins by breaking bullish on MTF. What wasn't taken into consideration is looking at the 8 HTF on RUNE. Also didn't refine past Weekly. The level is valid on several MTFs.
A full clean block is something that hasn't been touched yet at all. A partial block has its power too, but less.
Partials Inside Other Blocks
Doge example — 3D OB partially taken, but not 50% of it:
That was the target for long and at least half of the spot bag.
Behind another valid block:
You can use them, but this is much weaker than several other opportunities. Look for more PA confluence + Fibs. If nothing else, play smaller size, or no play.
The more optimal, the more likely for you to be profitable. With so many great opportunities out there, find better than this.
For practice: chart 20 high trading volume coins, including BTC and ETH. Choose the best 10. Refine properly. Trade the best 5. Journal. Accumulate valuable data. Repeat. Optimize.
Partial Becoming a Bullish Partial Breaker
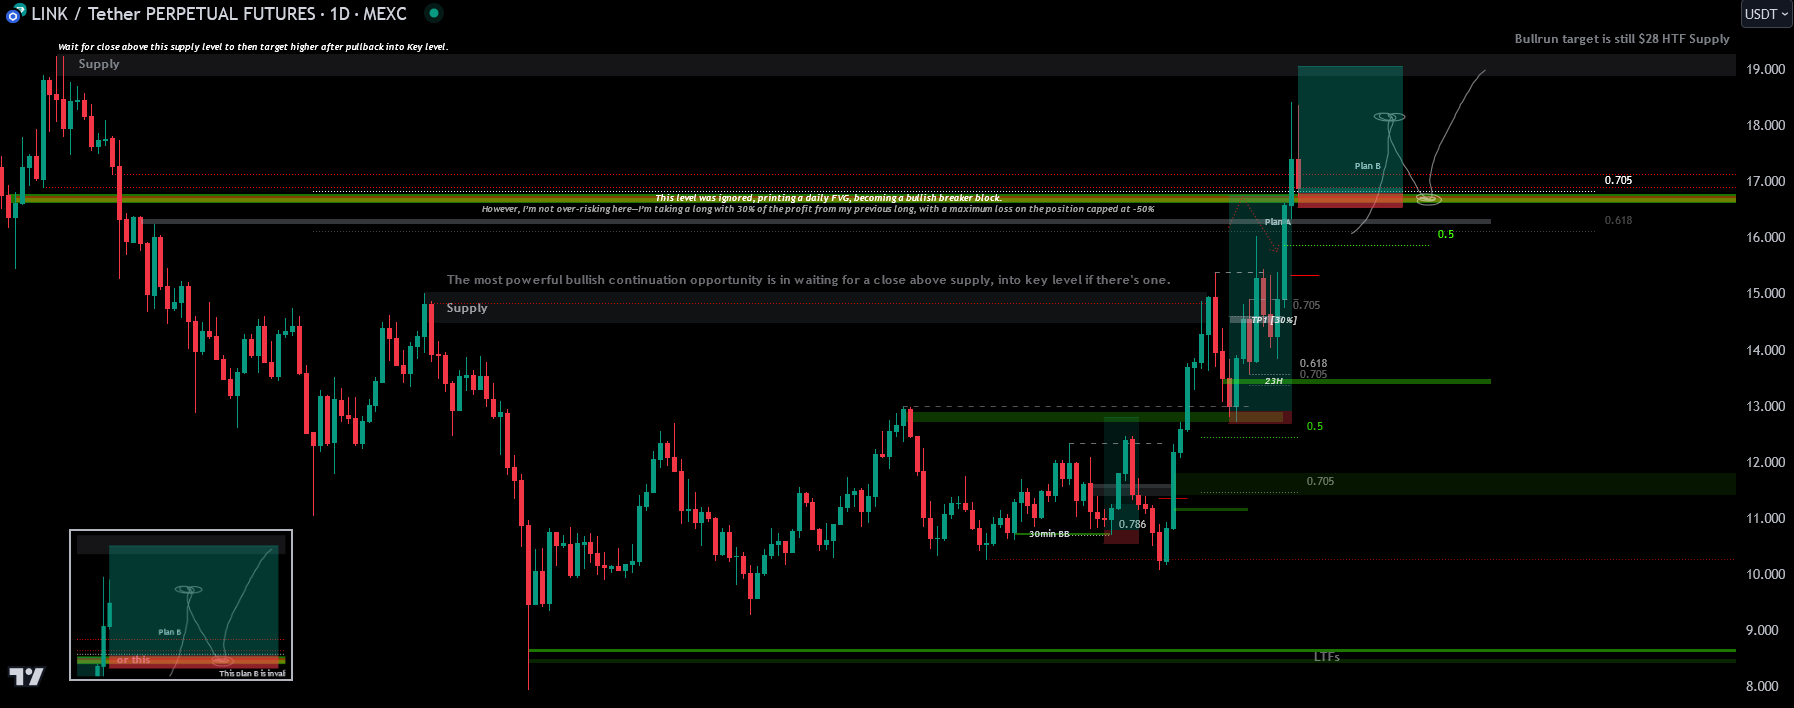
LINK [Nov 10, 2024] — tried both supply levels with 0.75% position size. One stopped at -35%, second entry placed at the top of the daily candle bodies. The previously ignored supply level near $13 has now shifted to a bullish partial breaker block.
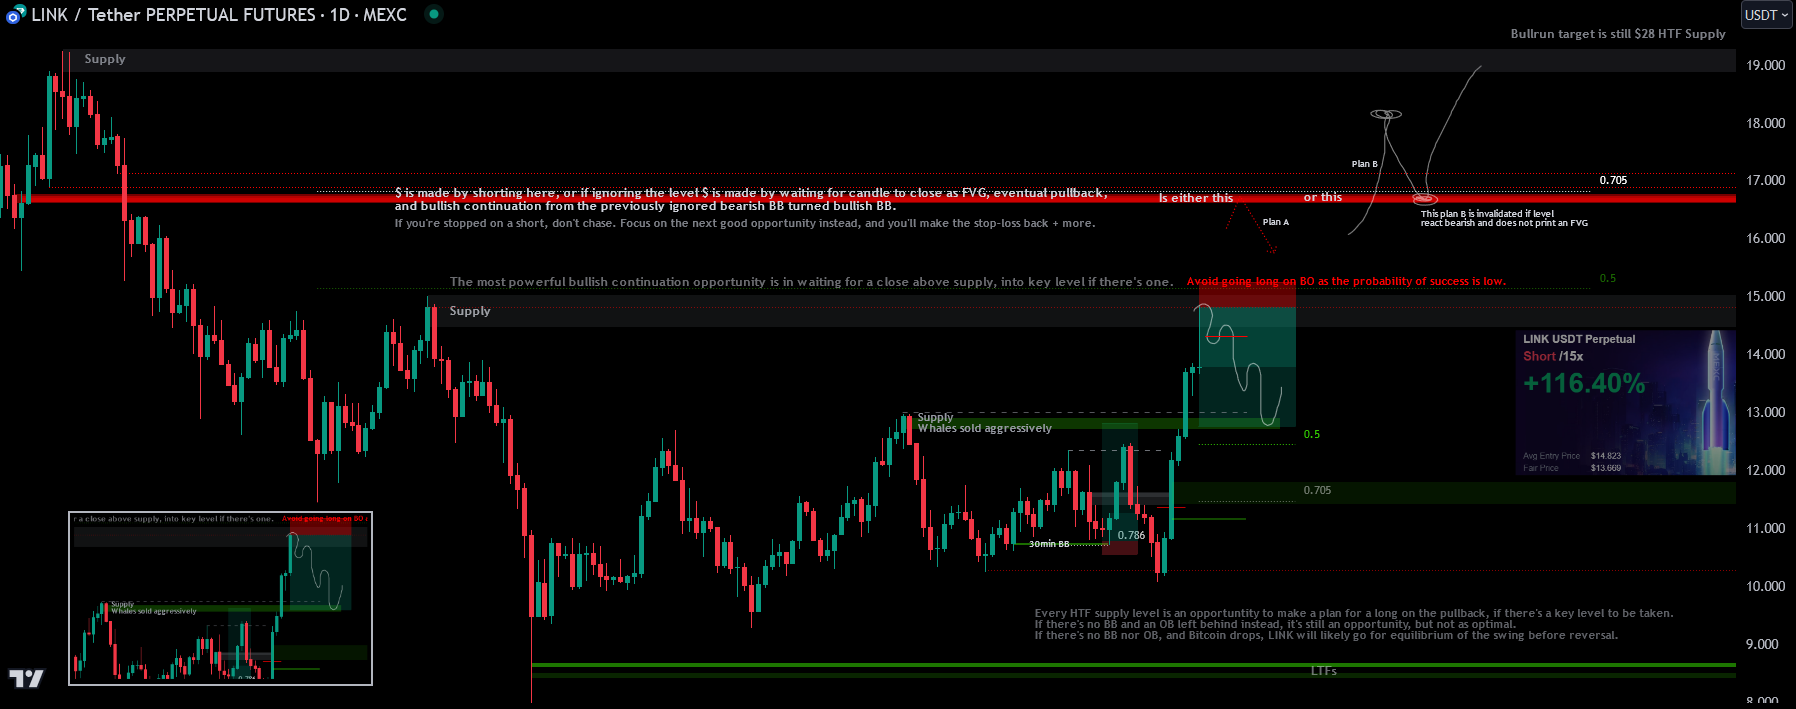
No TPs. Trailing above MTF FVGs.
Worst case: 1st SL recovered + some profit. Best case: pullback sending LINK to lower key levels, recovering 1st SL + good profit.
Update [Nov 15, 2024] — the previously ignored supply level near $13 has now shifted to a bullish partial breaker block. Played out:
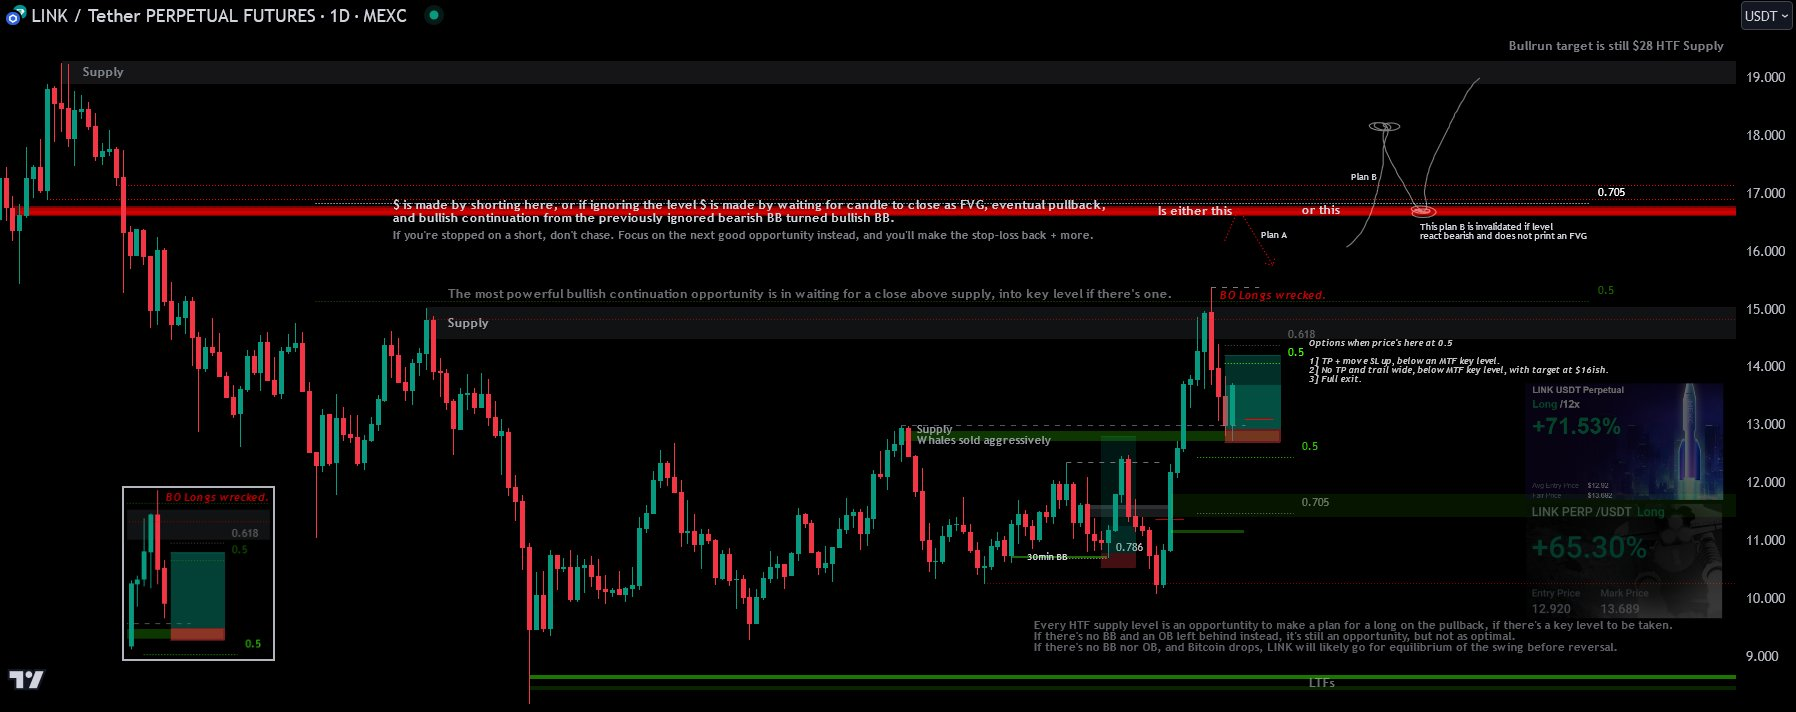
No TPs. Trail along, wide.
Quality of a Hidden Liquidity Level — The Full Checklist
Quality means the probability that price will reverse at a level, giving you optimal trade entry. The factors that determine quality:
1) Mitigation
The more wicks into the level, the weaker the HOB. If a HOB zone was mitigated by more than 50% (0.5 fib), don't consider it anymore.
2) Fully or Partial Hidden?
If just partial, that makes it a partial HOB (pHOB). If the BB is fully hidden behind the FVG, it's stronger. Full = BB body fully covered by FVG. Partial = BB body isn't fully covered.
3) Timeframe Matters
The biggest money is found on HTF. >1D or even >1W tend to be quite powerful.
4) Multiple TF HOBs at Same Level
Are there multiple HOBs stacking above each other on different TFs? Can you refine a HTF hidden liquidity level into a lower timeframe one? If yes, this increases their strength.
5) Understanding the HTF Trend
In a HTF downtrend, HOBs acting as resistance work better than those as support. In bullish trends, vice versa. In bearish trends, bullish HOBs are often ignored — you can short a 2x HOB later. In a HTF downtrend, the most reliable HOBs are close to HTF demand zones.
6) Close to HTF Demand or Supply?
Liquidity zones "in the middle" are frequently ignored as long as they don't have powerful confluence from fib levels. The closer to HTF demand/supply, the more powerful.
7) Fib Confluences
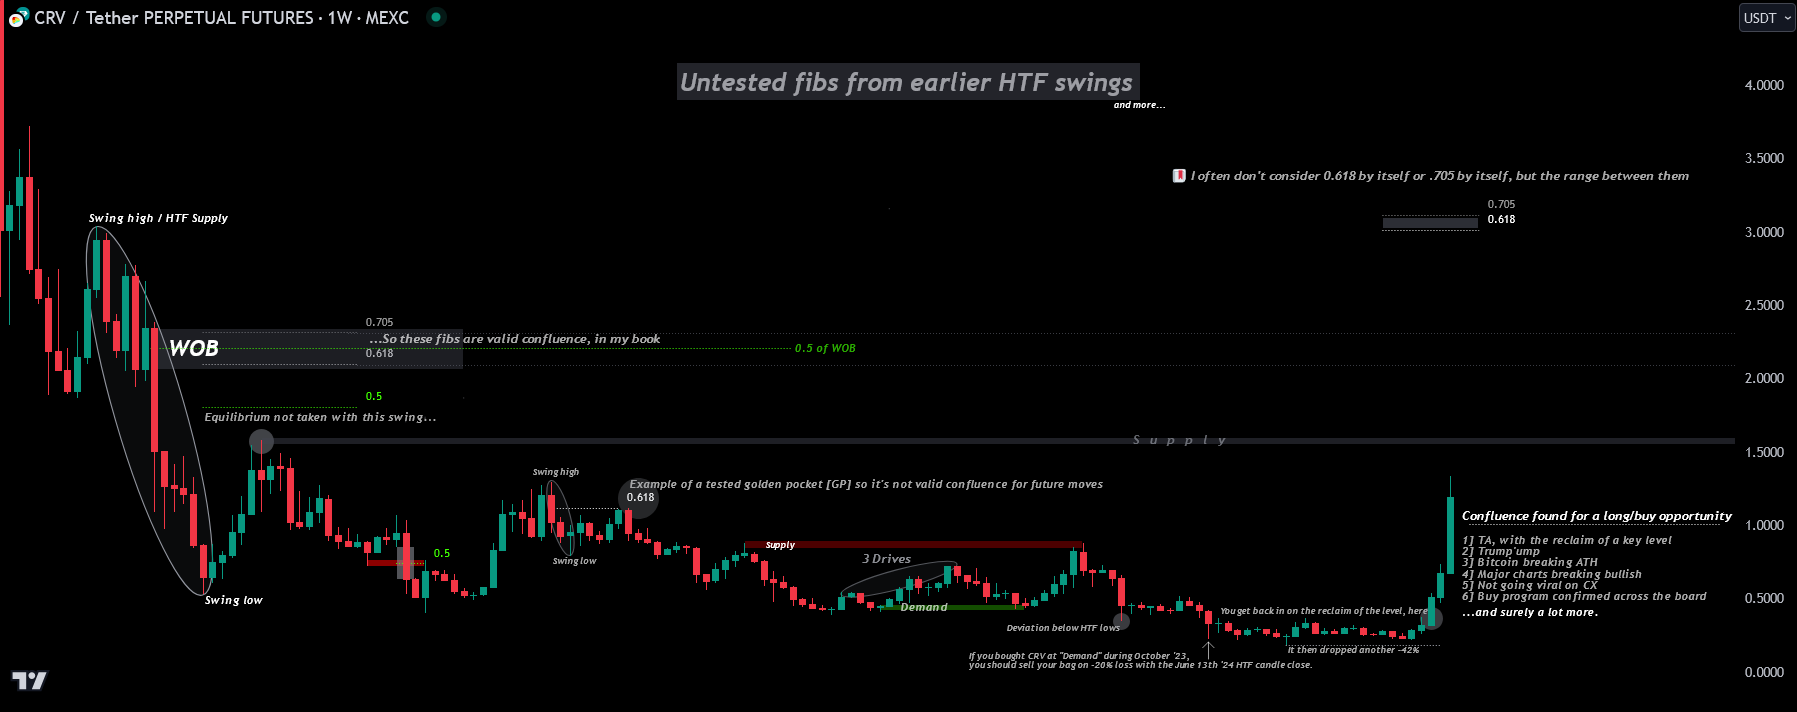
If the hidden liquidity level has confluence with relevant fib levels (.5, .618, .705, .786, .886) it's stronger — ideally with fib levels found on HTF swings.
8) Multiple FVGs
Multiple FVGs behind the BB? Becomes a 2-n x HOB, likely stronger. Note: the existence of those levels means HOBs don't always lead to a reaction — they can be ignored initially.
9) Coin Volume
Liquidity concepts work better on high volume coins like $BTC and $ETH. Be careful about liquidity levels on alts that don't align with majors.
10) Confluences
Don't trade altcoins in isolation. When they reach key levels, look for confluence from:
- USDT.D
- BTC
- ETH
- TOTAL
- TOTAL2
If they reached key levels too, this increases reversal chances. See 👑Market Context.
Bonus — Volume Spread
As an additional metric, check Volume Spread Analysis (VSA). High volume + high spread events give confluence for upcoming reversal.
Concrete Example
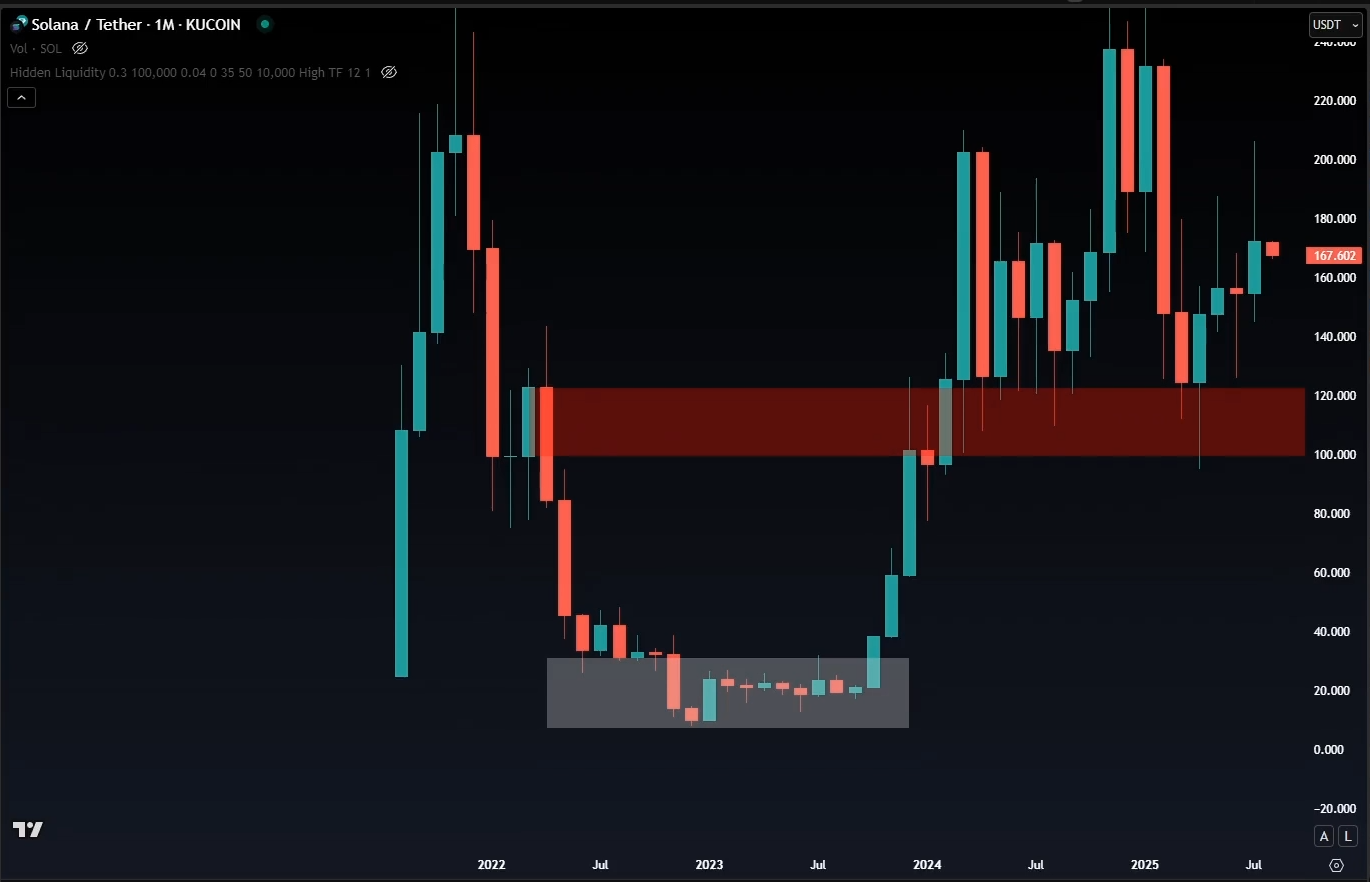
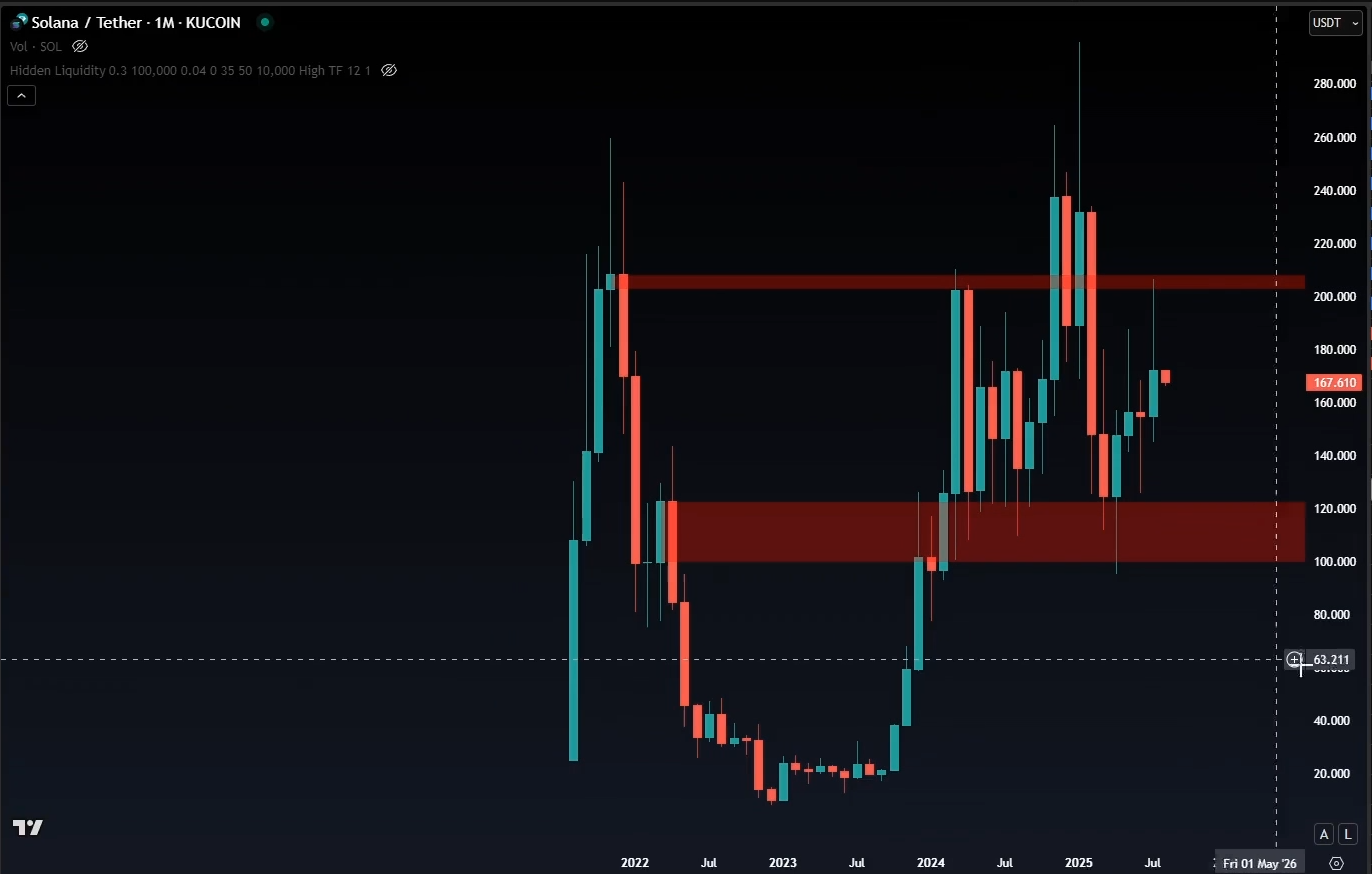
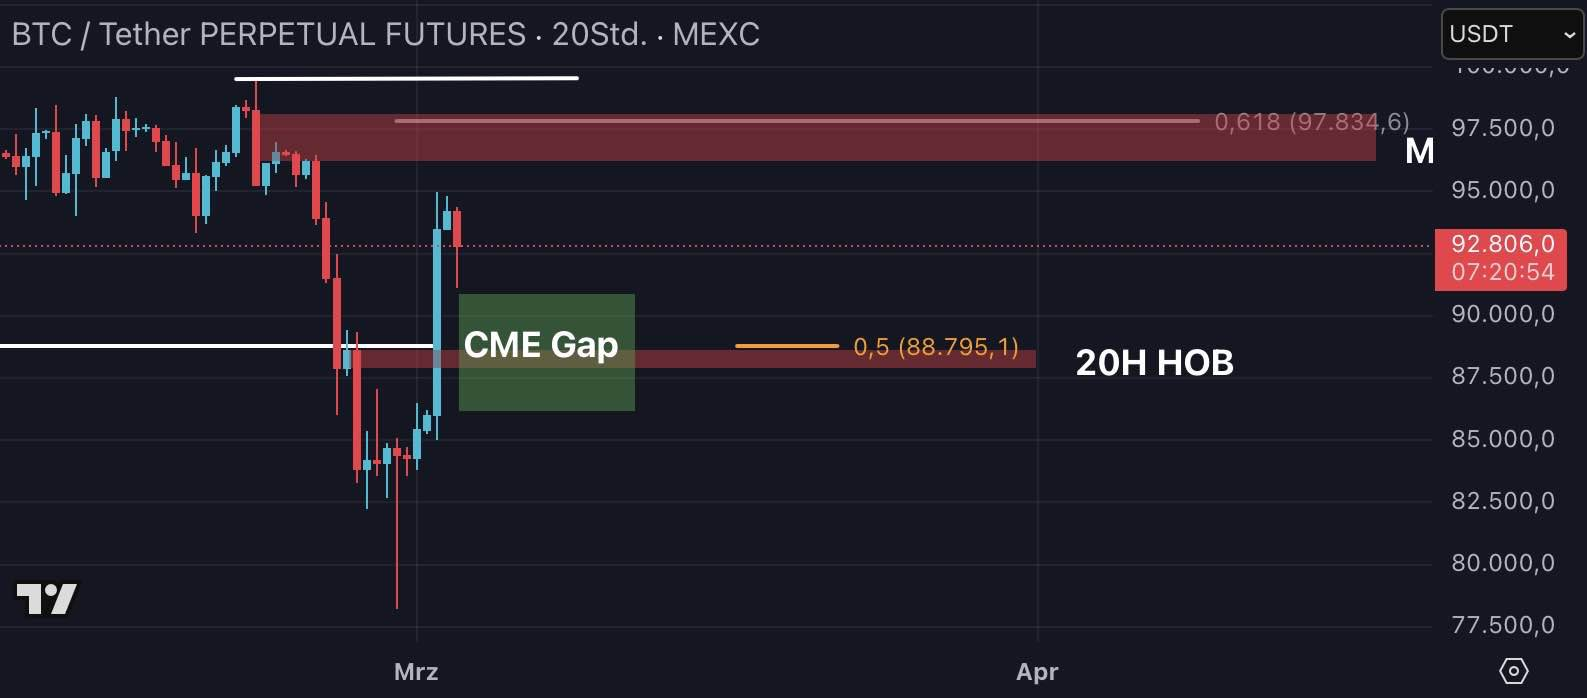
20h HOB on $SOL at $195:
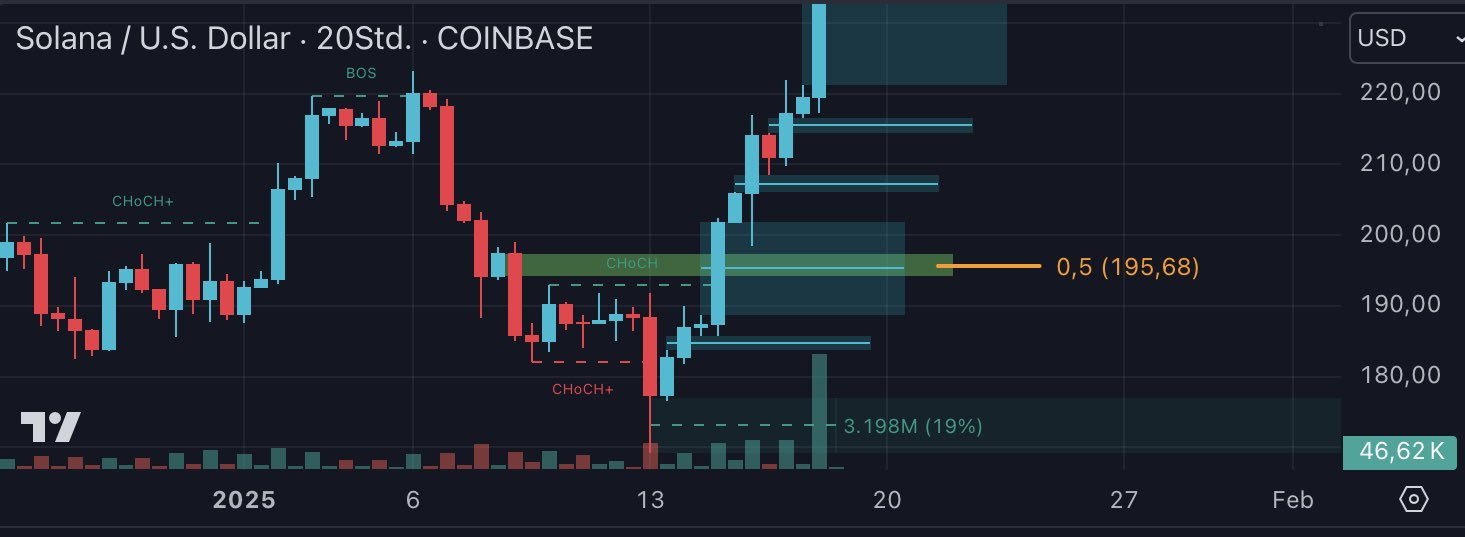
- 0.5 fib confluence
- Unmitigated
- Fully hidden
- → Strong
This DOES NOT mean price needs to go to these levels — it means that IF it goes there, you have a favorable risk/reward long, especially in confluence with resistance on USDT.D or support on TOTAL charts.
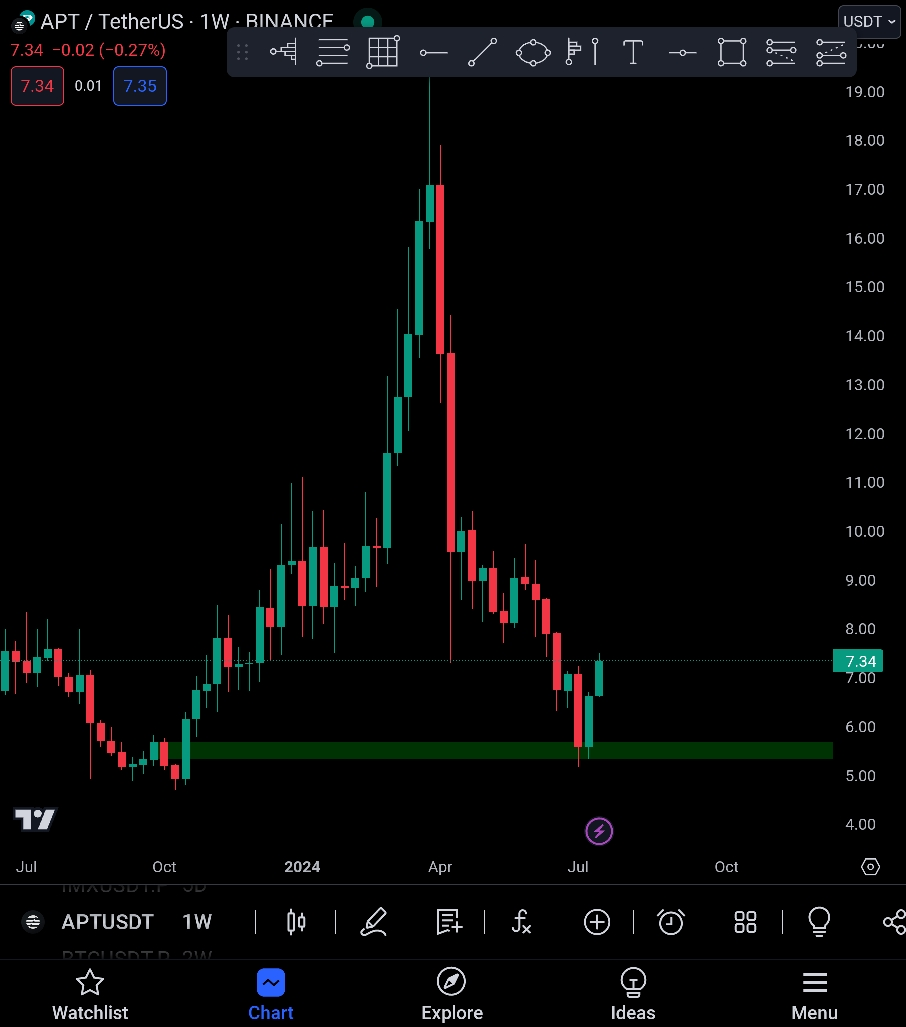
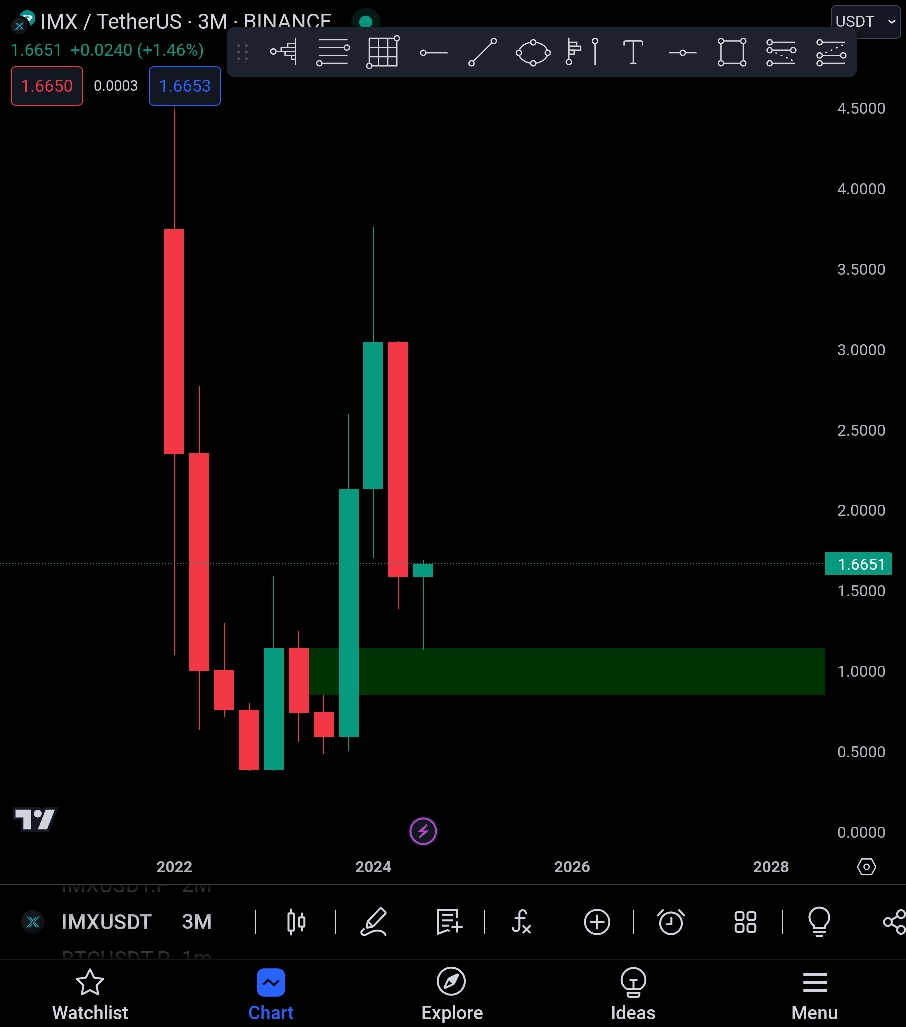
CHZ, BCH, ALICE — Examples of Untapped HTF OBs
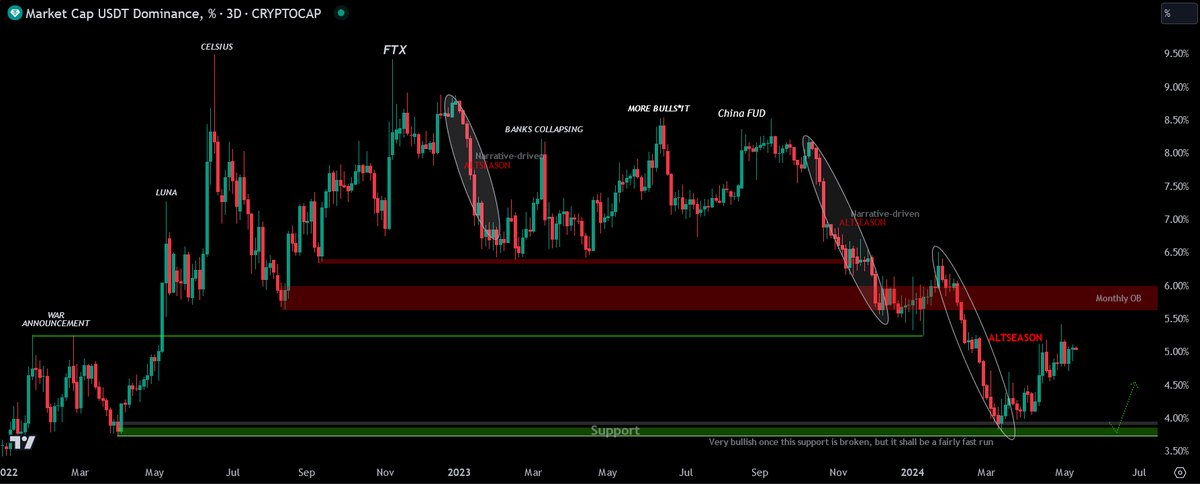
USDT Dominance monthly OB looks like a potential reversal level:
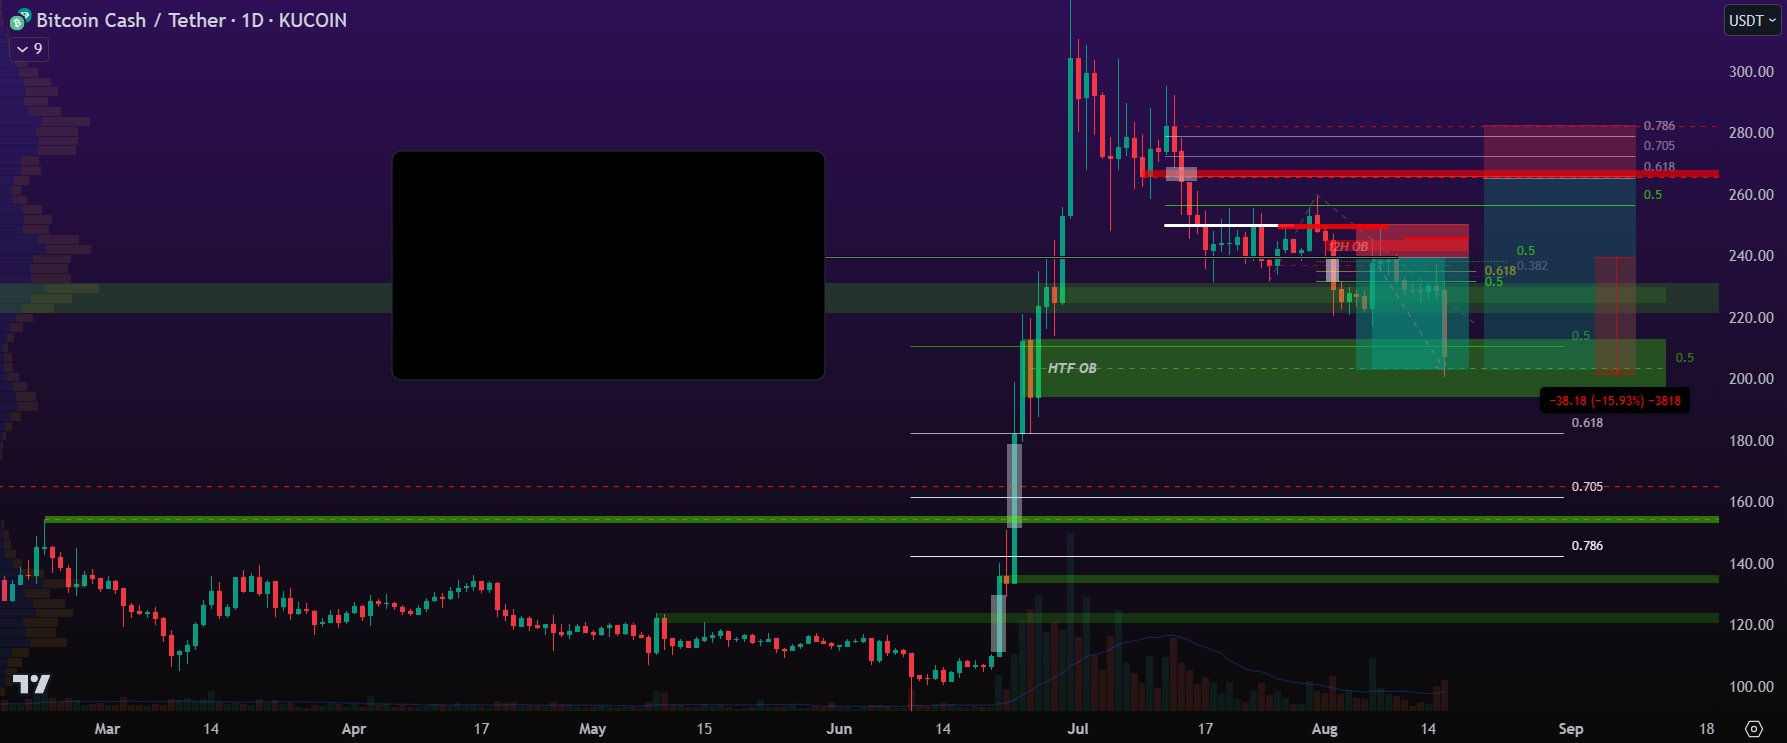
BCH — straight into HTF Order Block, -16%, -39% from local high:
ETH bearish OB — full exit from long position, sold more spot bag, retail starting to FOMO:
$CHZ — that HTF OB was a gift in front of everyone's eyes (not hidden):
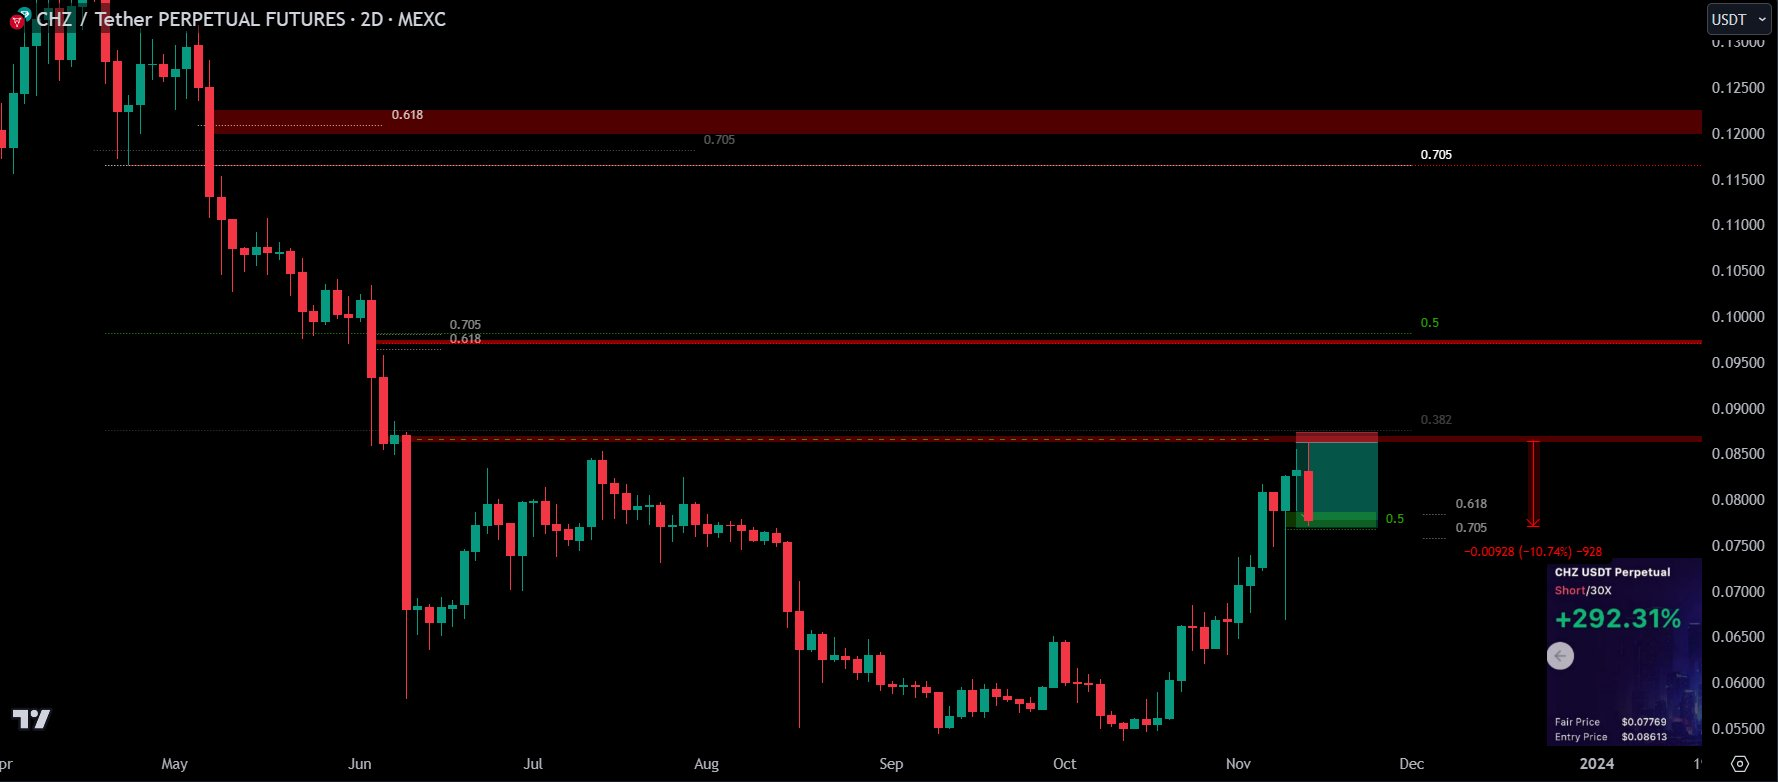
The criteria for it to be a valid OB? Untested.
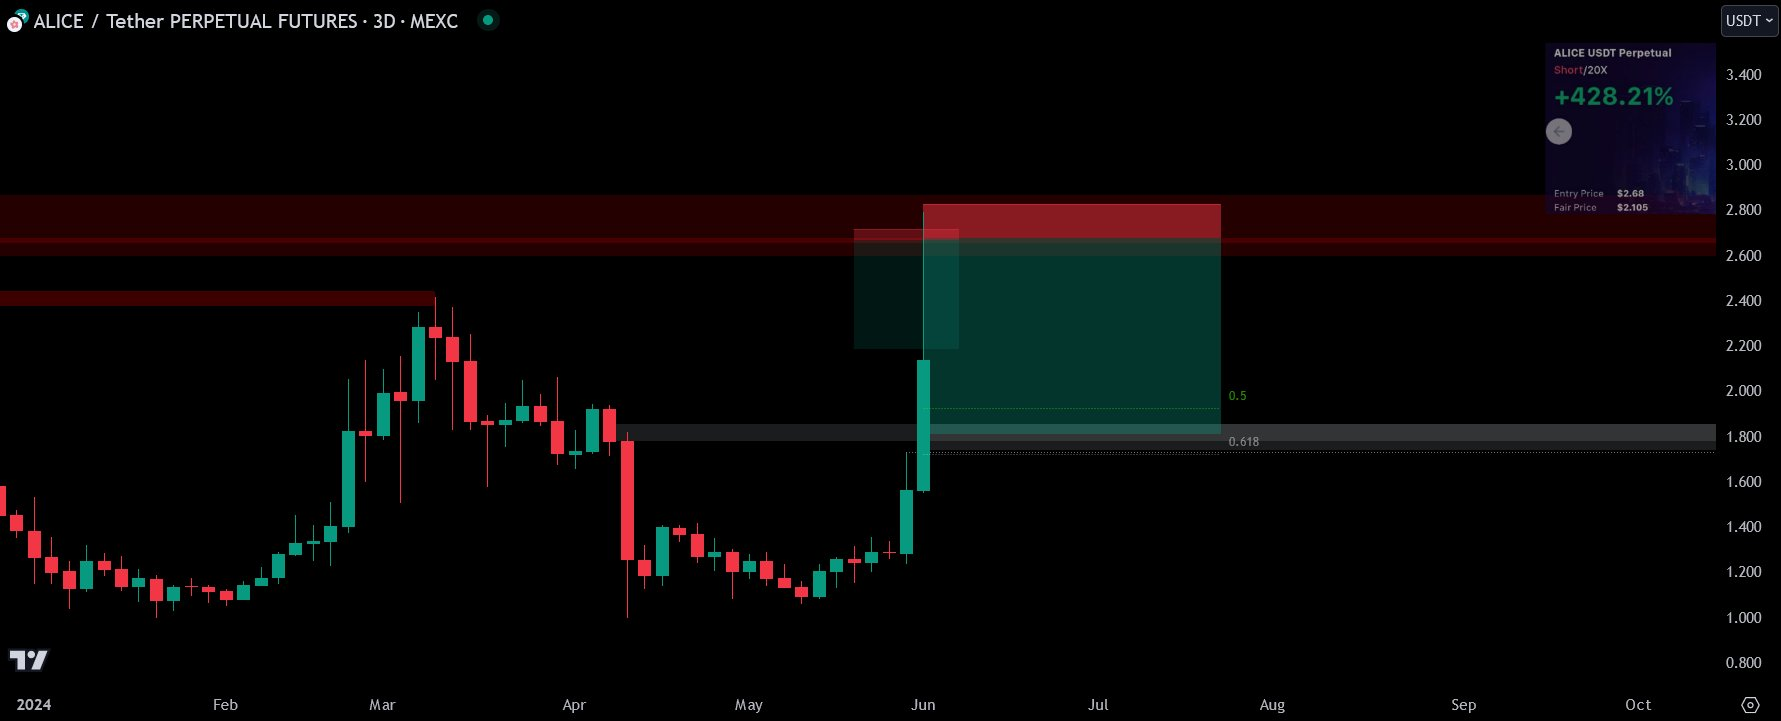
ALICE — never seen an altcoin ignoring an untapped monthly OB, and the reversal is always powerful:
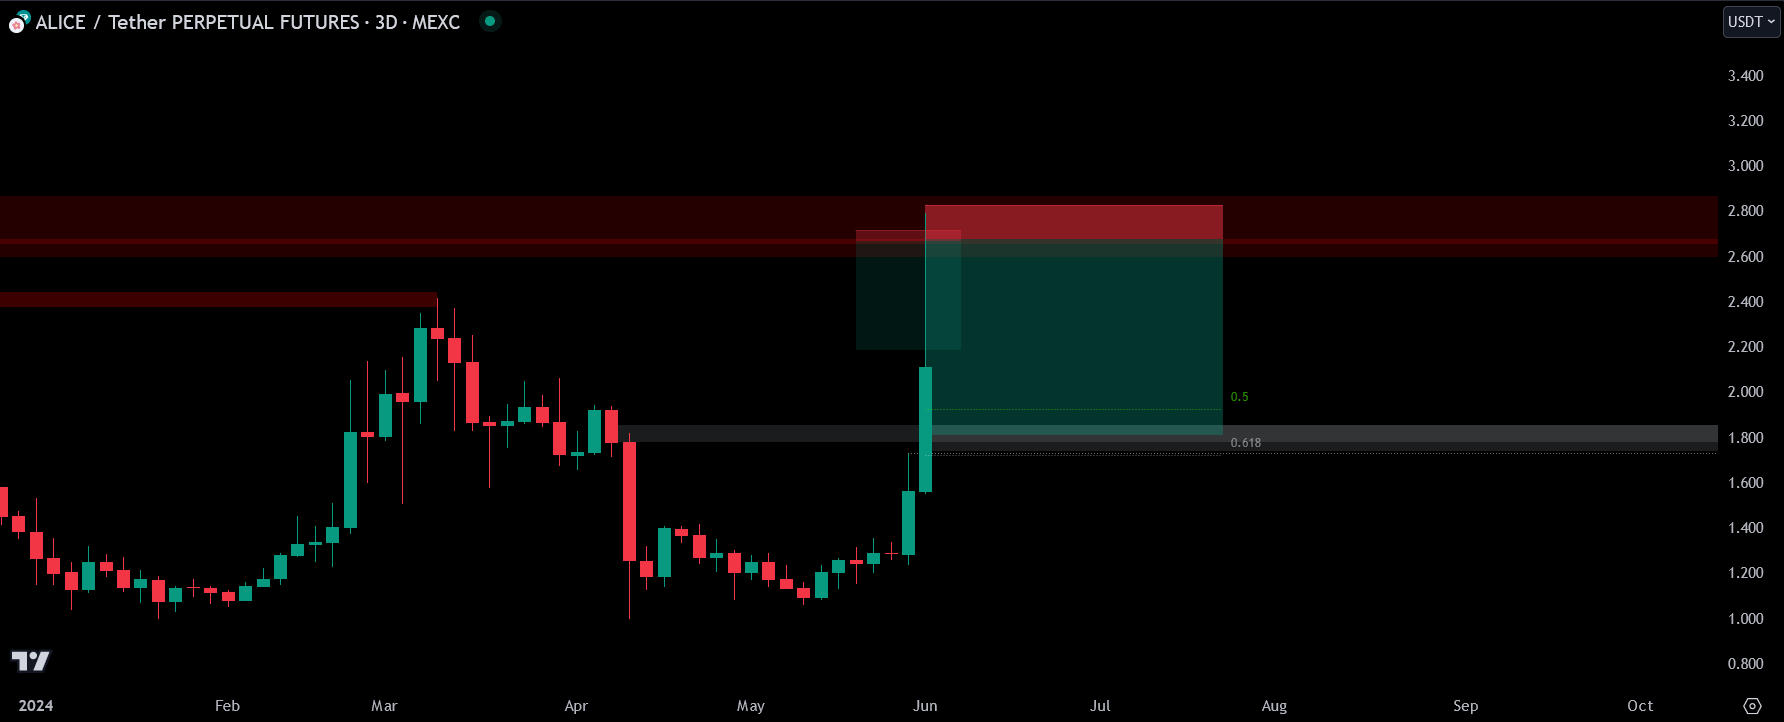
A tight SL initially got stopped out. On the second attempt inside the same monthly OB, successful. PA told us it wasn't willing to go past the refined level at $2.66 — there's nothing more than wicks going past it (stop loss hunting), so the most likely outcome is reversal. See 📈Price Action Rules.
A tight SL allows leverage to the highest possible extent, maximizing potential profits. It's a sacrifice for a bigger reward. The second entry became more valuable in terms of potential profit. You could widen the SL to cover the entire level, but that prevents leveraging a 20X position. The tight SL is a calculated risk for a potentially greater reward. See 🔷Stop Loss and 🔷Risk Reward.
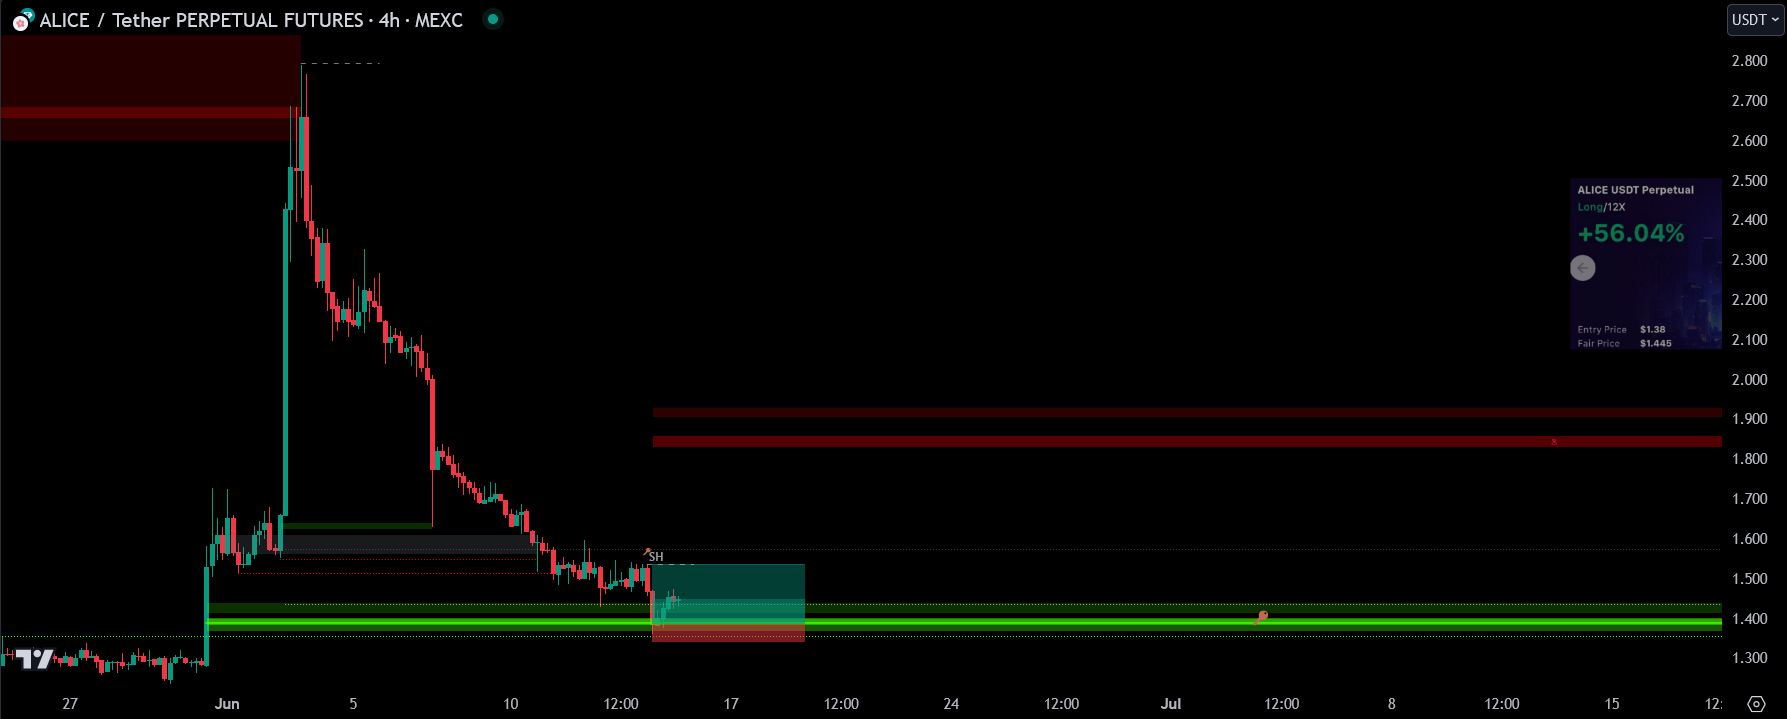
ALICE update [Jun 15, 2024] — SL based on the refined level:
When a student's SL was hit and they should have made it wider:
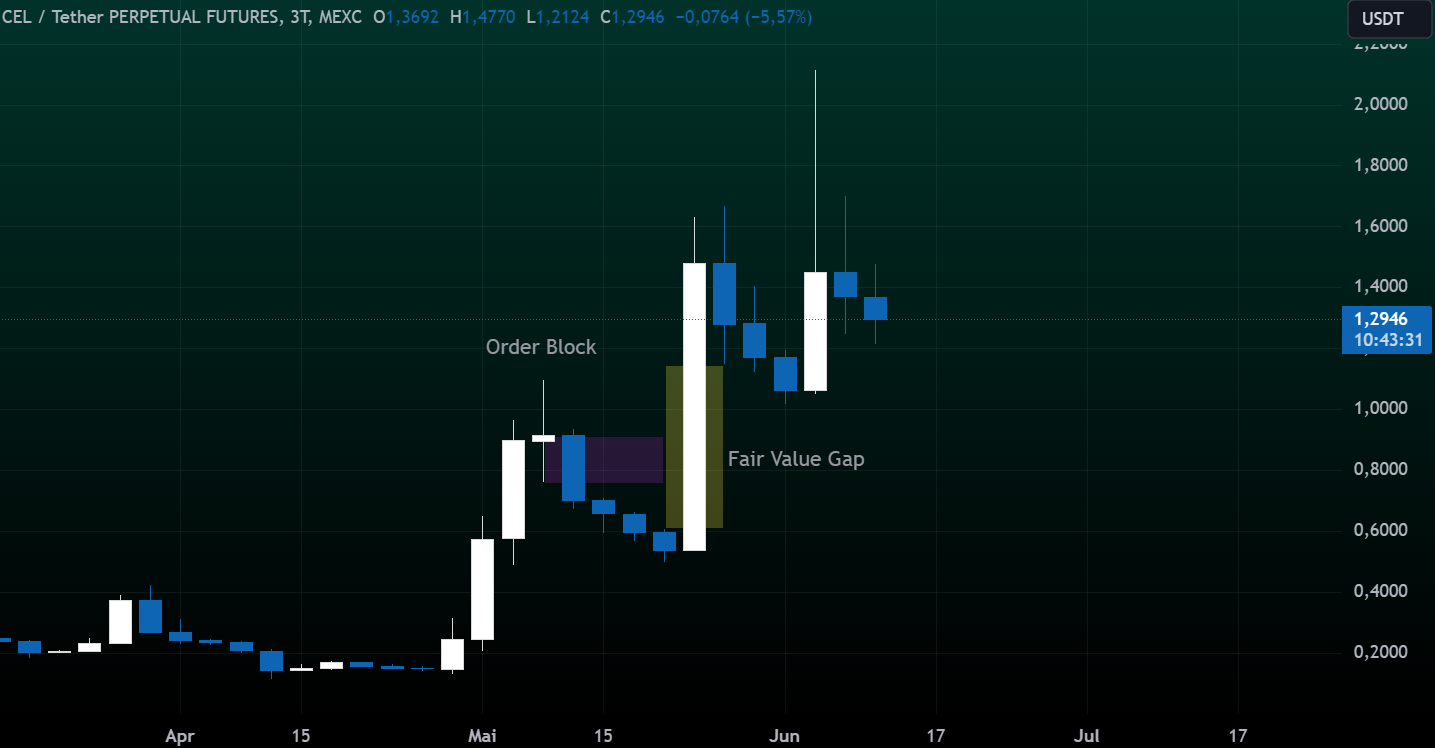
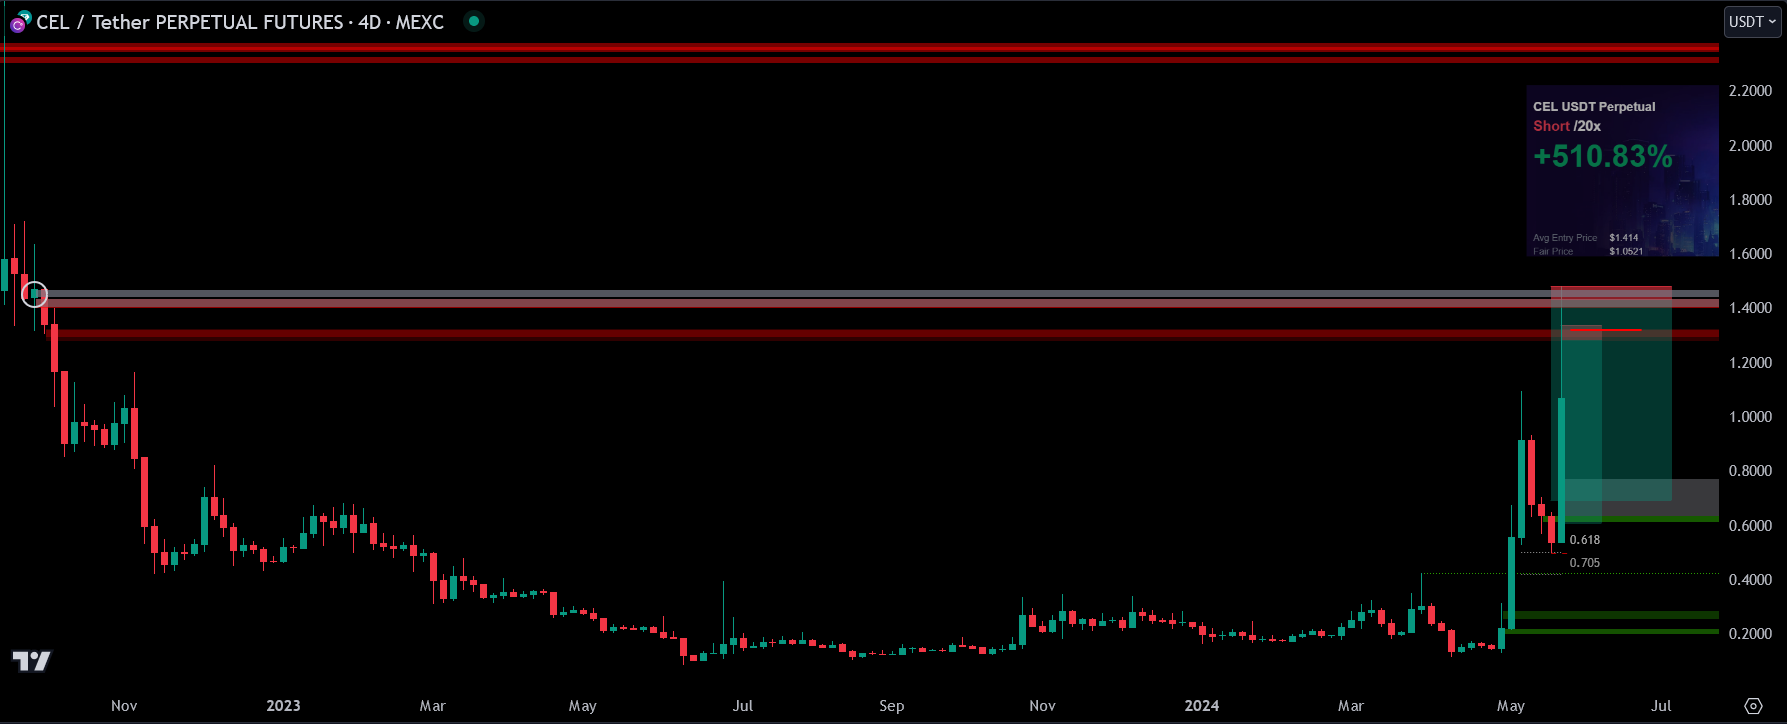
CEL couldn't handle that 4D OB. The R:R is insane — already with a key level printed on LTF, so SL can go above it. If you're not greedy, never be afraid of these plays. Note the possible hidden BB with a whole higher TF OB above it — you short the OB supply:
ETH 1W OBs example with 2 OBs in the premium zone lining up with fib levels:
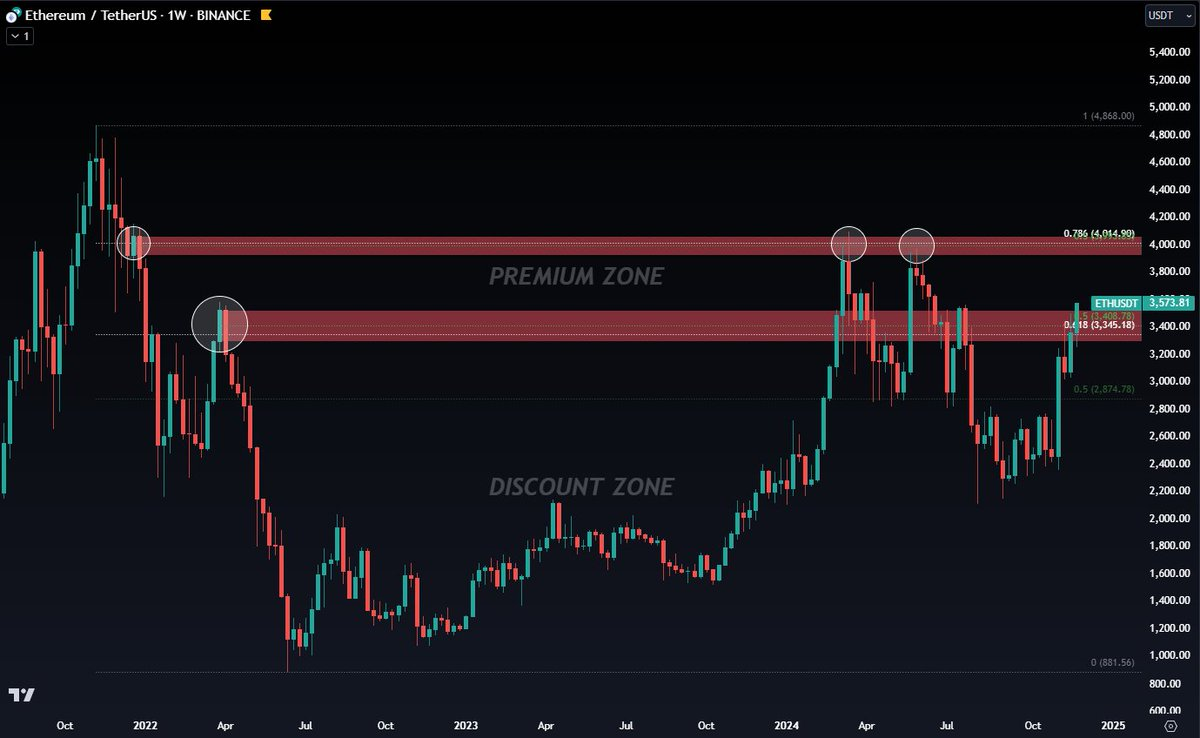
The 1st 1W OB had a terrible reaction — weekly PA closed above the equilibrium of the OB. Most likely a short was taken at this level and got stopped or manually exited at partial loss. You will lose sometimes — but you can still be massively profitable with a terrible win rate.
The 2nd 1W OB held strongly. PA didn't close above the highlighted area. This setup is being respected better than the first.
ALGO supply and demand example:
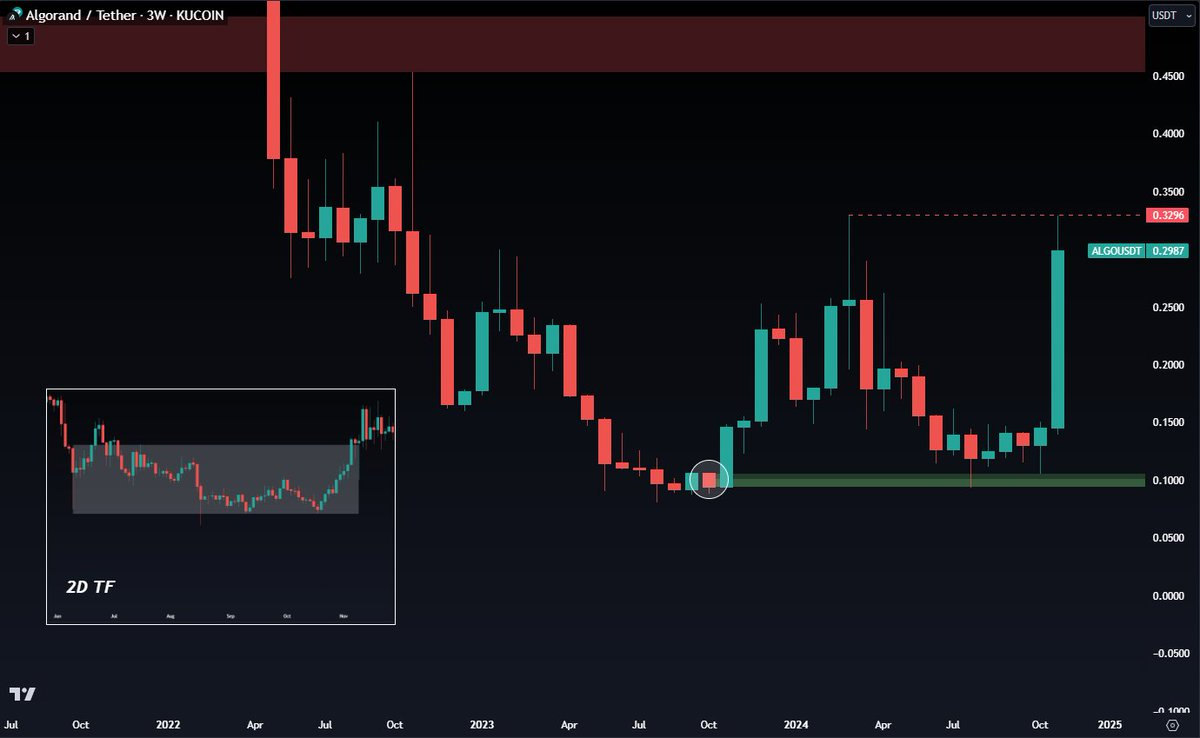
3W OB refined down to 2W or 7D. On 2D, this is a supply and demand area — whales bought 4 times at the bottom of the channel showing high interest at this price (discount zone). Whales left huge buy orders inside that OB to be filled in the future. PA hit the 3W OB twice before moving up. Recommendation: fill spot bags here rather than try to find a long with SL >5%. If you can do both, even better.
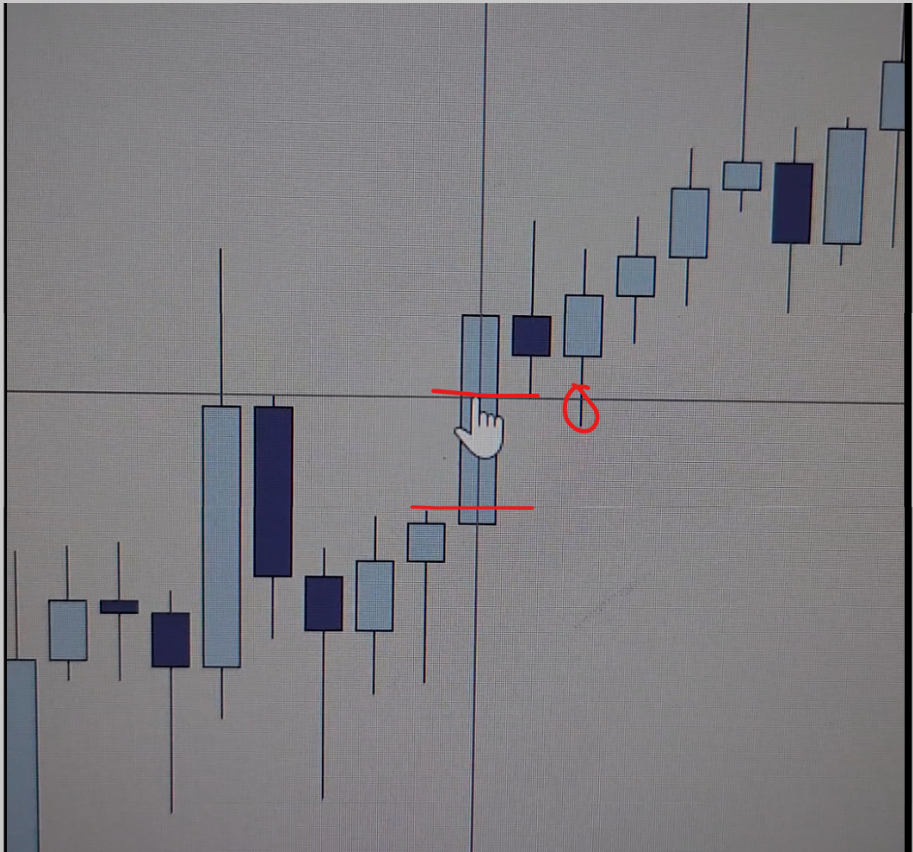
Drawing OBs — When the Level Starts Above the Body
A common student question: when I highlight an OB across the chart, why does the green box not go close-to-close on the candle?
Because the wick partially hit the OB before, so the box was drawn from the wick to the bottom of the OB — showing the last bit of liquidity.
Different students approach OB plotting differently. Some look for liquidity grabs + imbalances, some just plot it on the opposite candle before an up or down trend. Some believe it should be the closest candle to SH/SL of the move. The weekly TF and an untouched OB matters more than which candle technically defines it — the higher the TF, the more liquidity the OB holds.
OB vs Demand/Supply zone? An OB represents liquidity/volume. Demand/supply zones represent where whales like to buy and sell.
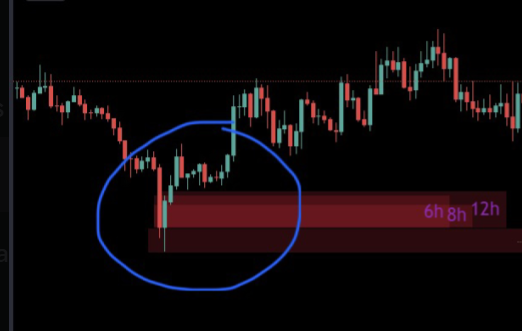
Handling FVGs Around OBs
So for this fvg example it is still valid even when there is this circled wick? Or would it shrink now?
The circled wick is irrelevant. The FVG has already been officially printed — doesn't matter what the candles do from there on. FVG is defined by the 3 candles — the long middle one and the 2 on either side with short wicks.
OBs are a level. FVG is a candle pattern. Two different things.
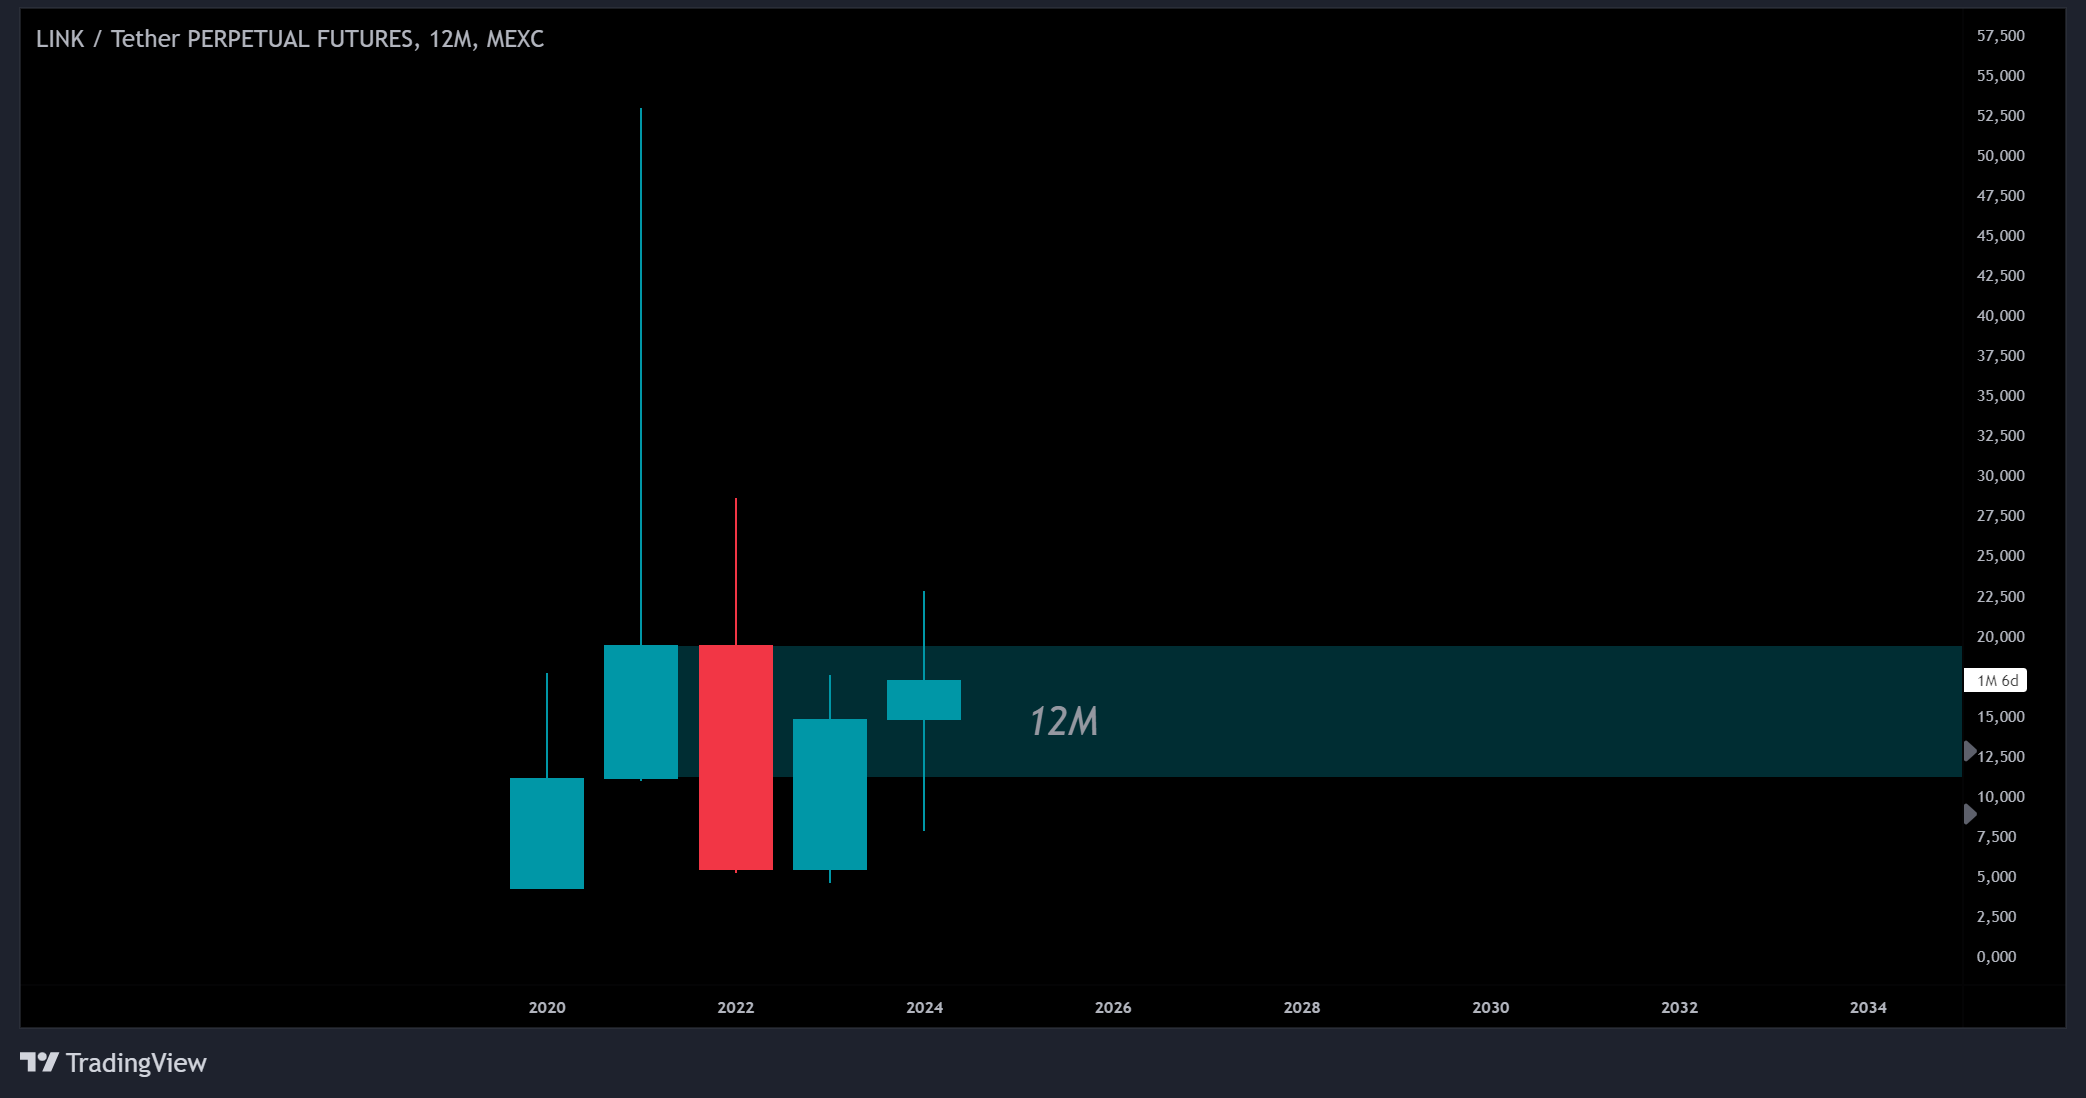
Walking the Timeframes — Full Refinement Example
A masterclass exercise for understanding OBs across many timeframes. The financial markets are not just candle bodies with wicks — they are a pure masterpiece. Some won't understand the usefulness of all these charts on different timeframes; others will see how all the pieces fit together.
12M — Not valid (unless something's missing):
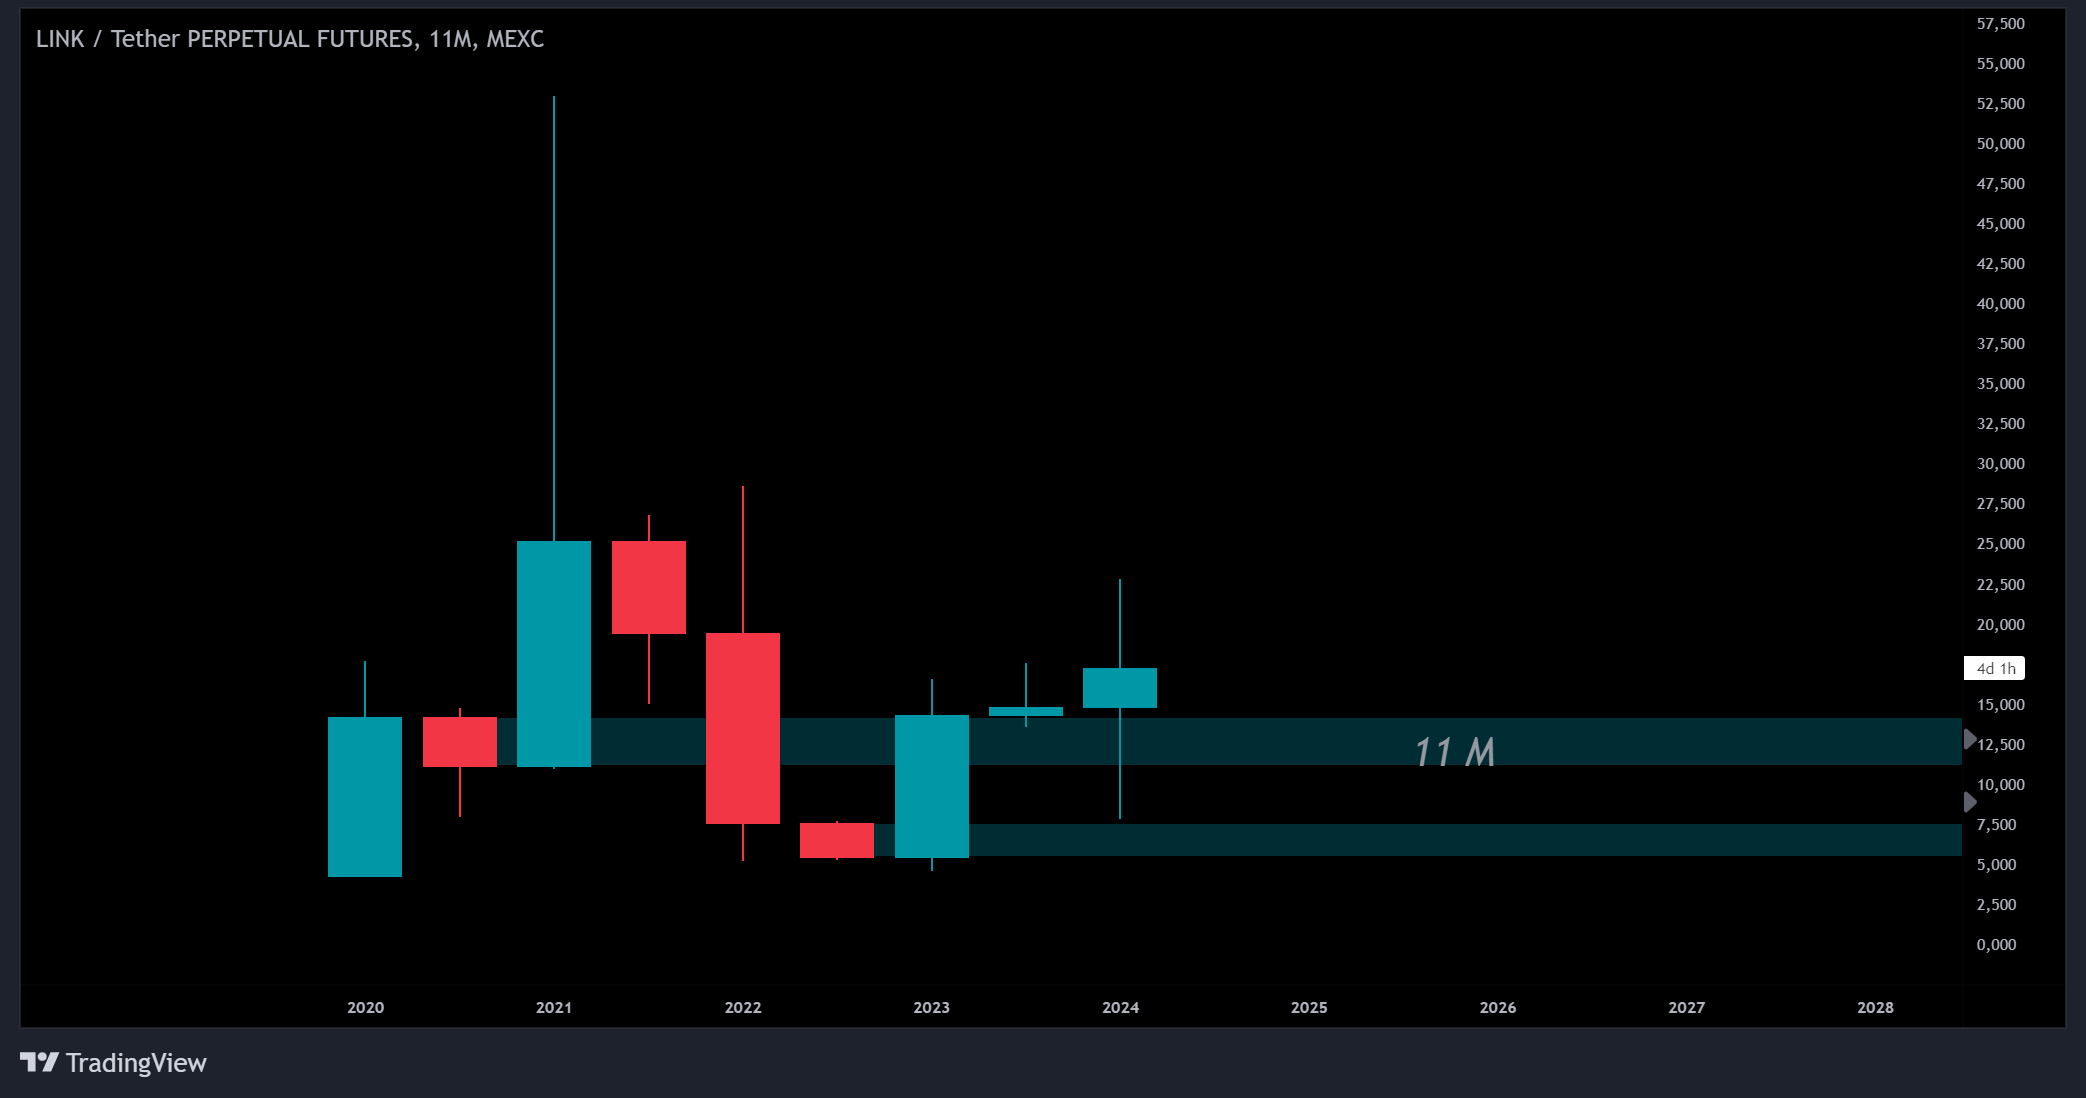
11M — Top: HOB until the wick from the most recent candle wiped it out. Bottom: regular OB (or NOB):
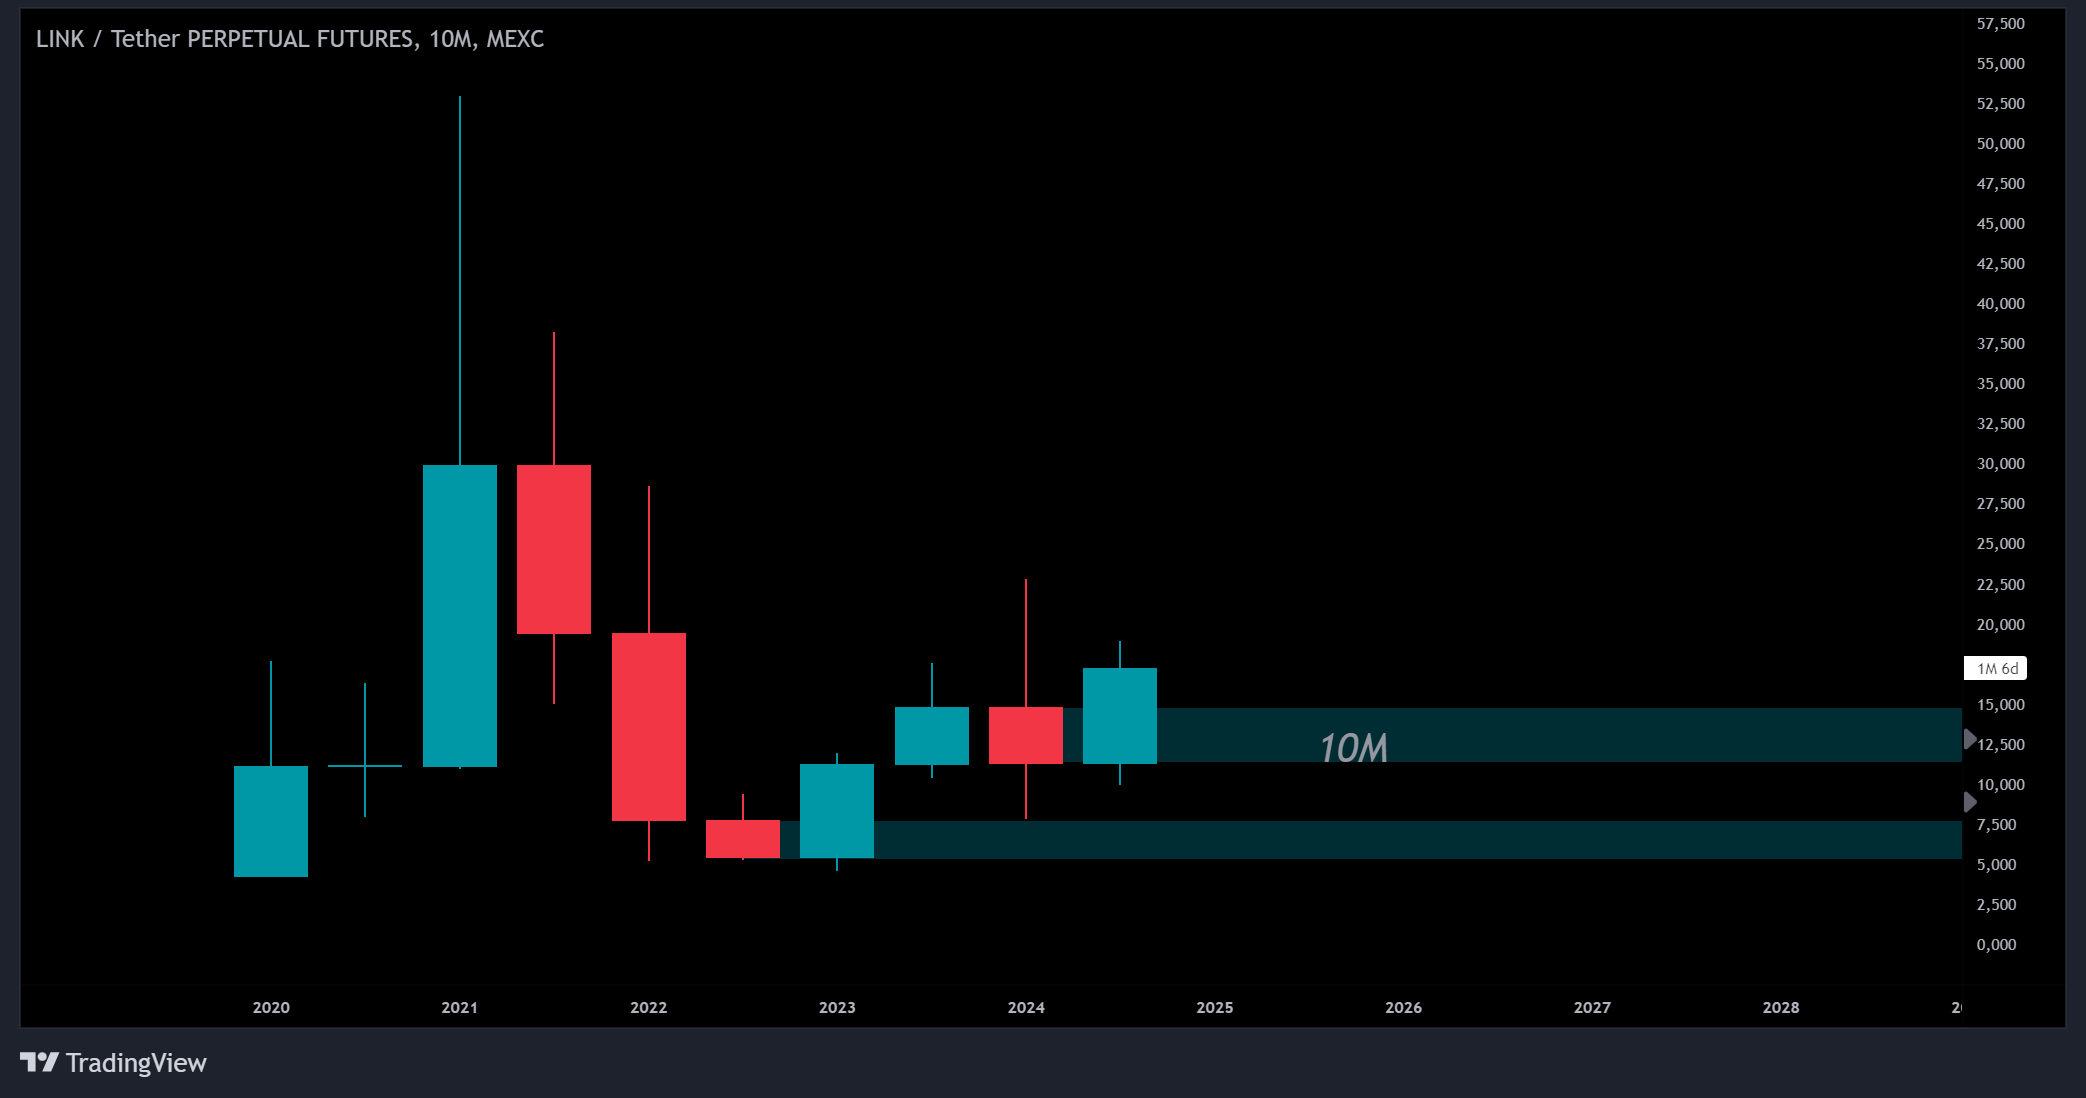
10M — Both regular OBs:
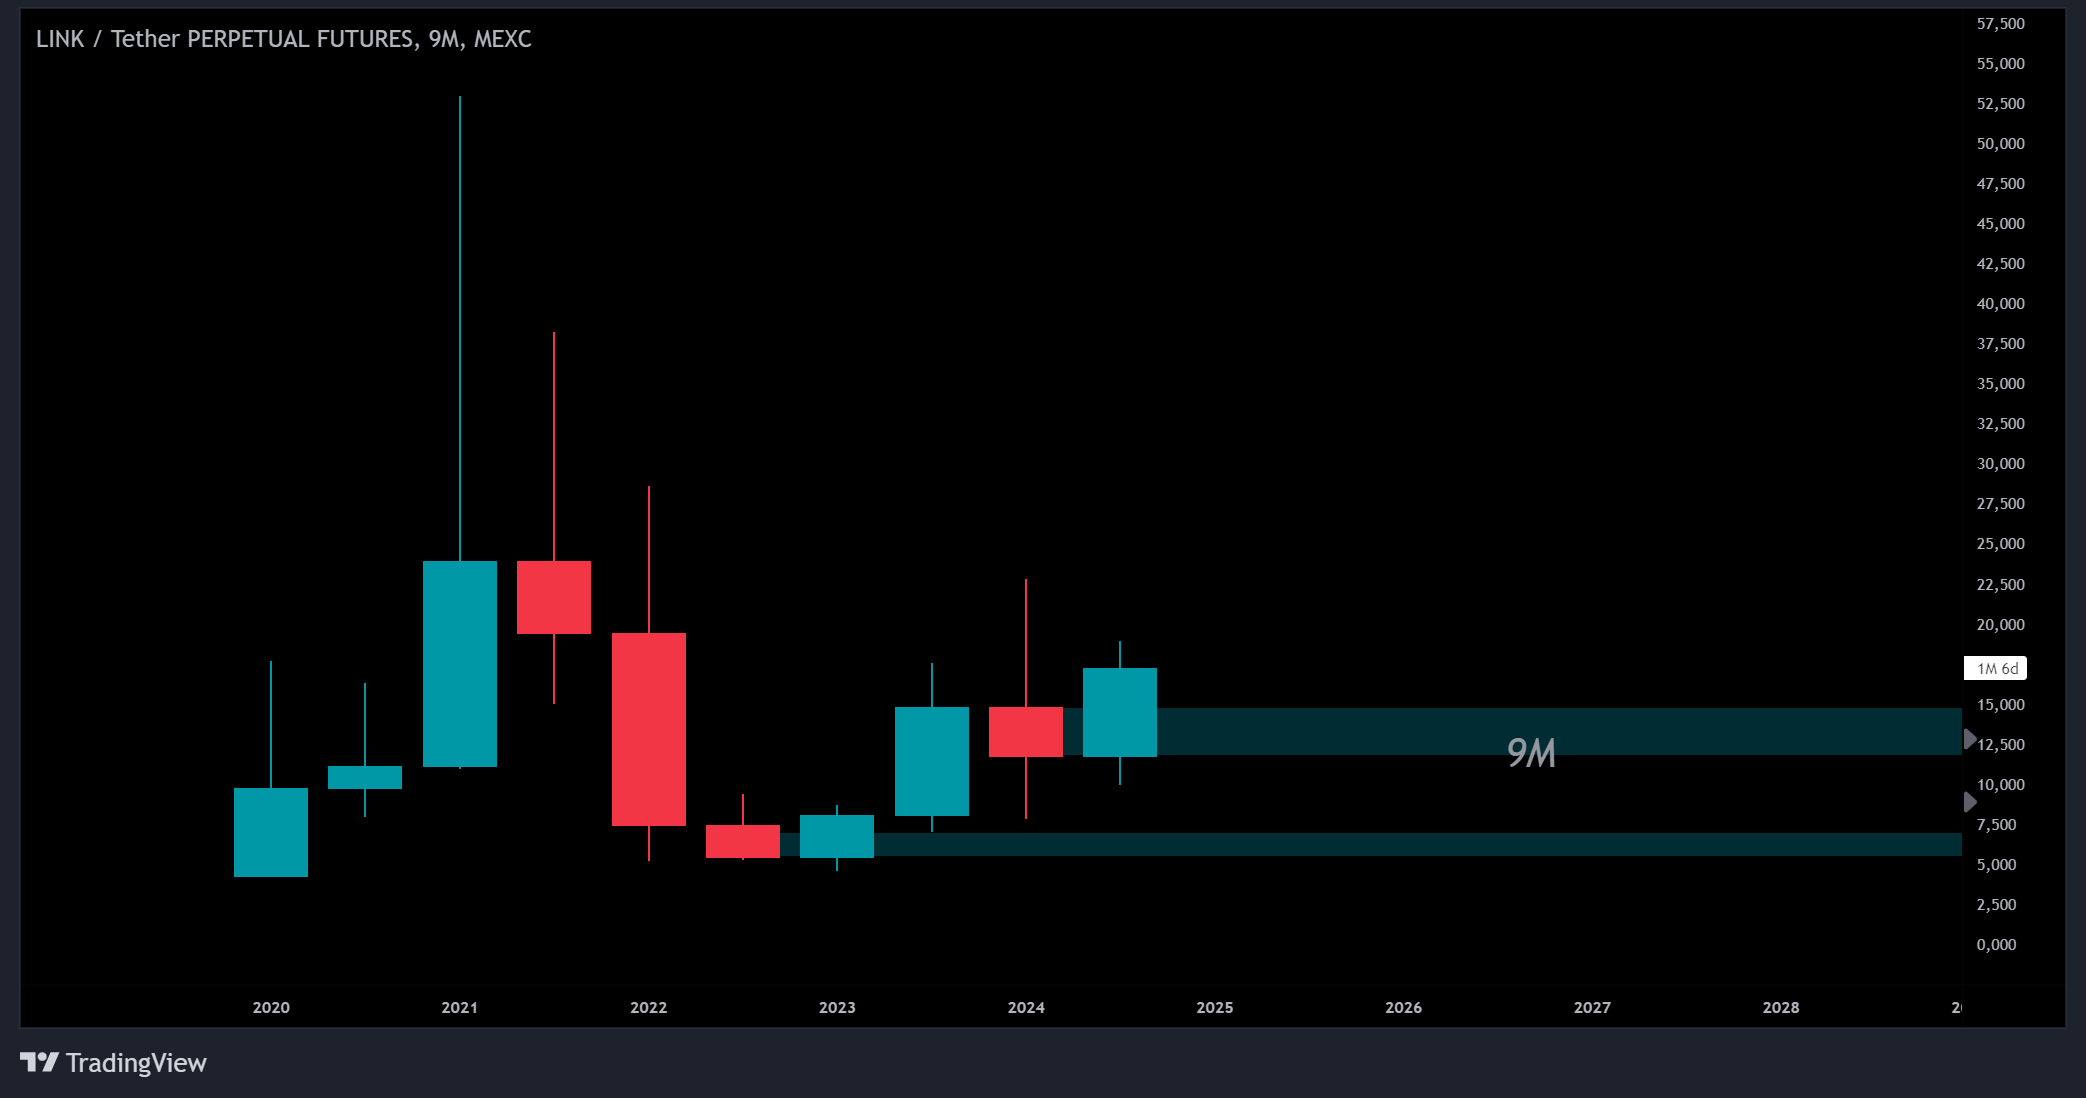
9M — Both regular OBs:
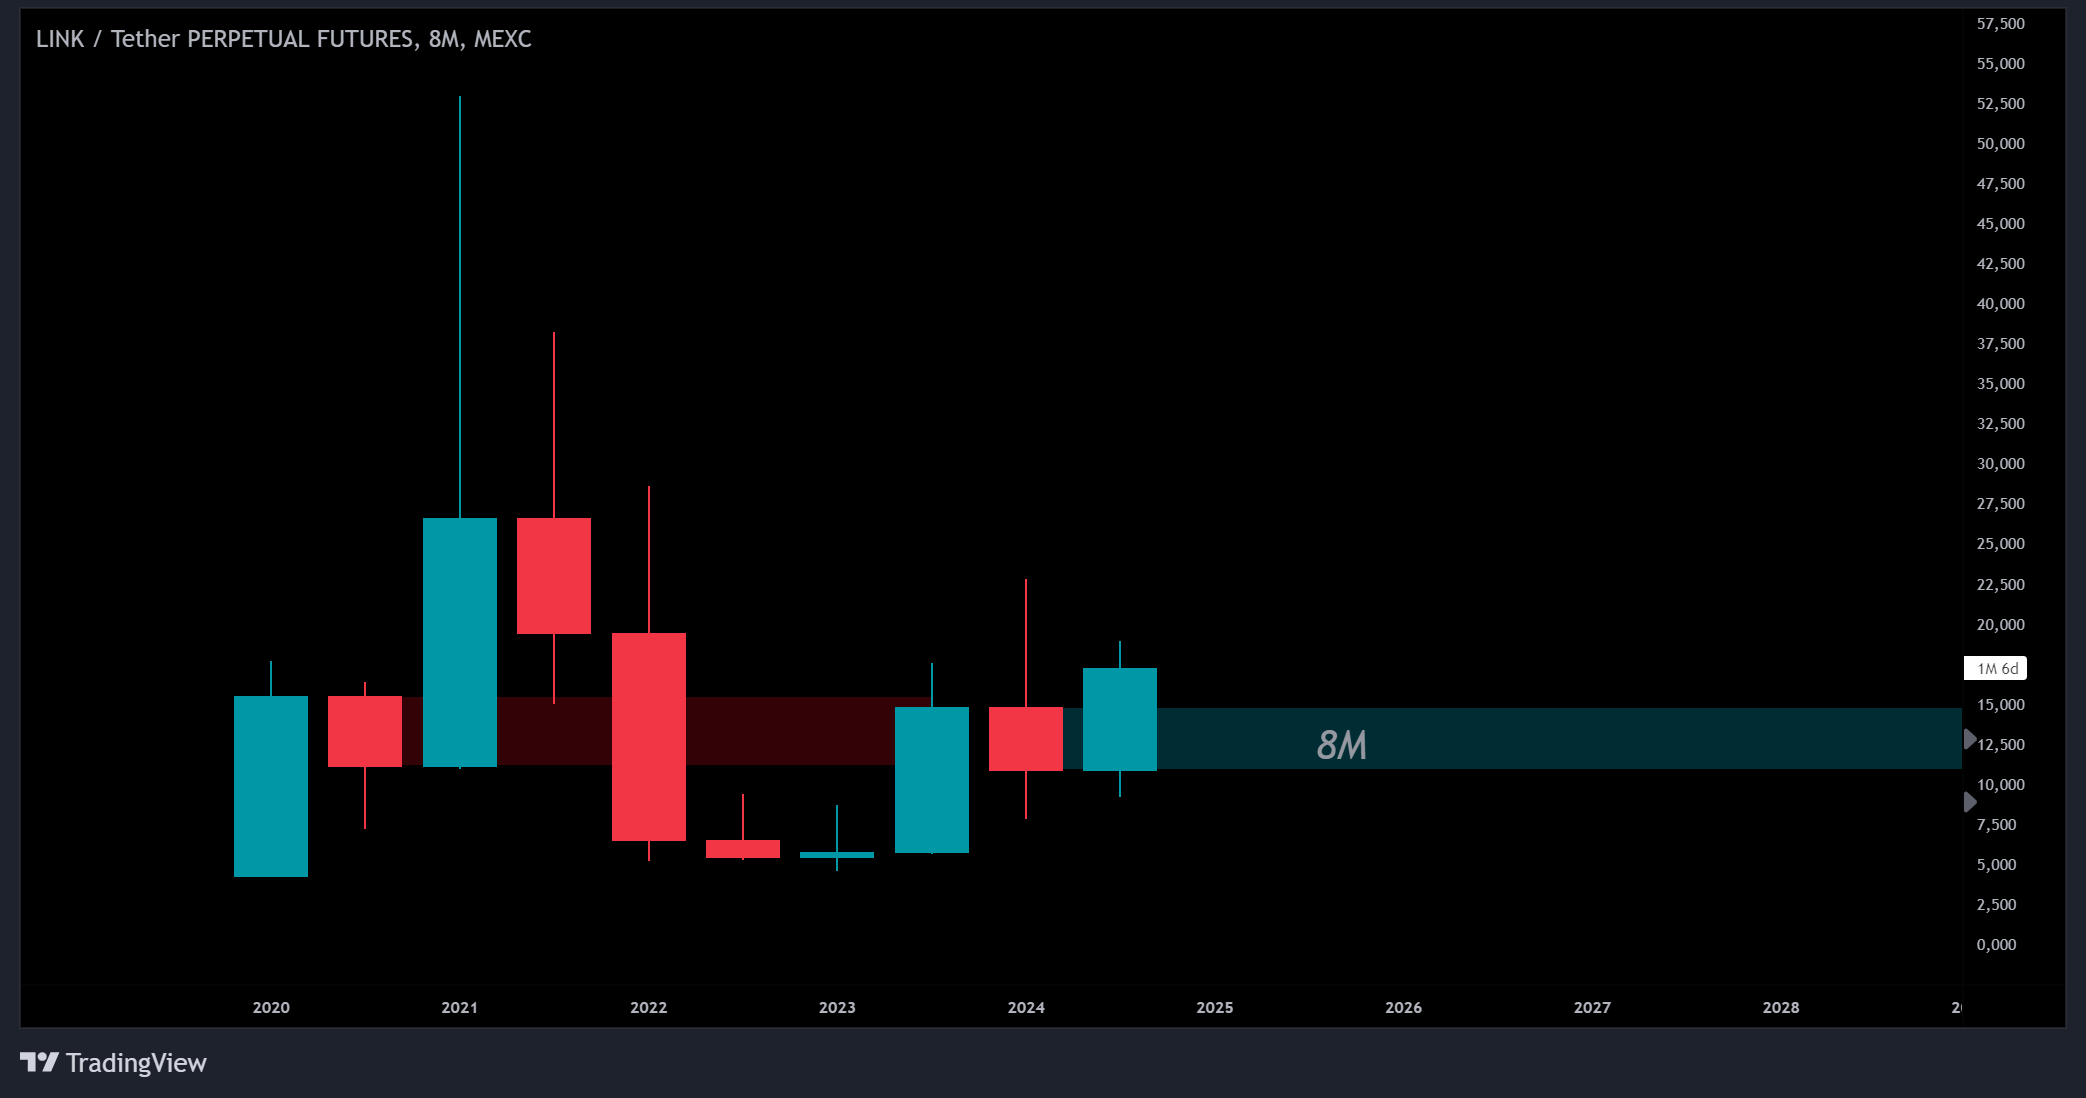
8M — Red: valid HOB until mitigated. You could call it PHOB — there's a red wick slightly inside the zone. Move the box down a bit so the wick isn't touching. Green: regular OB:
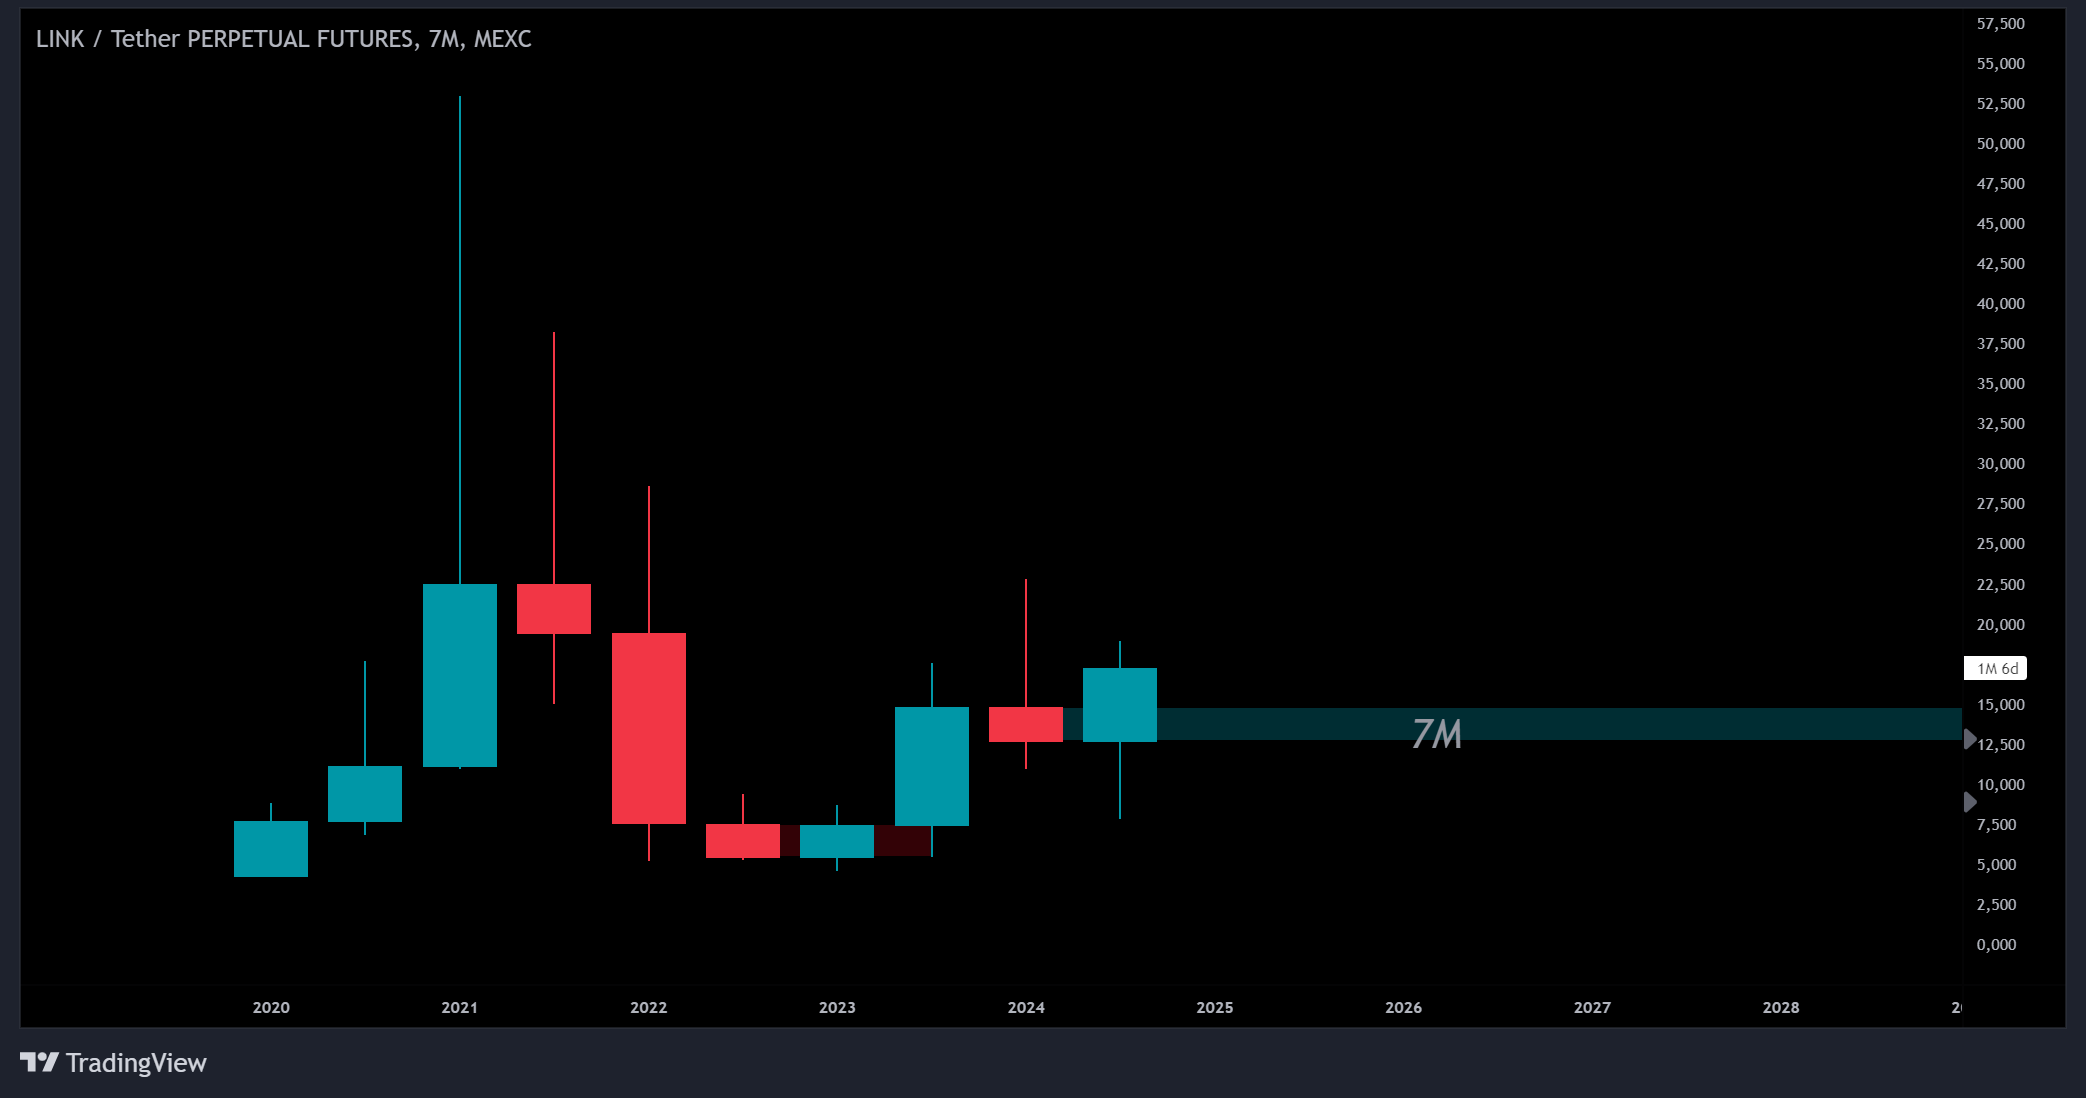
7M — Regular:
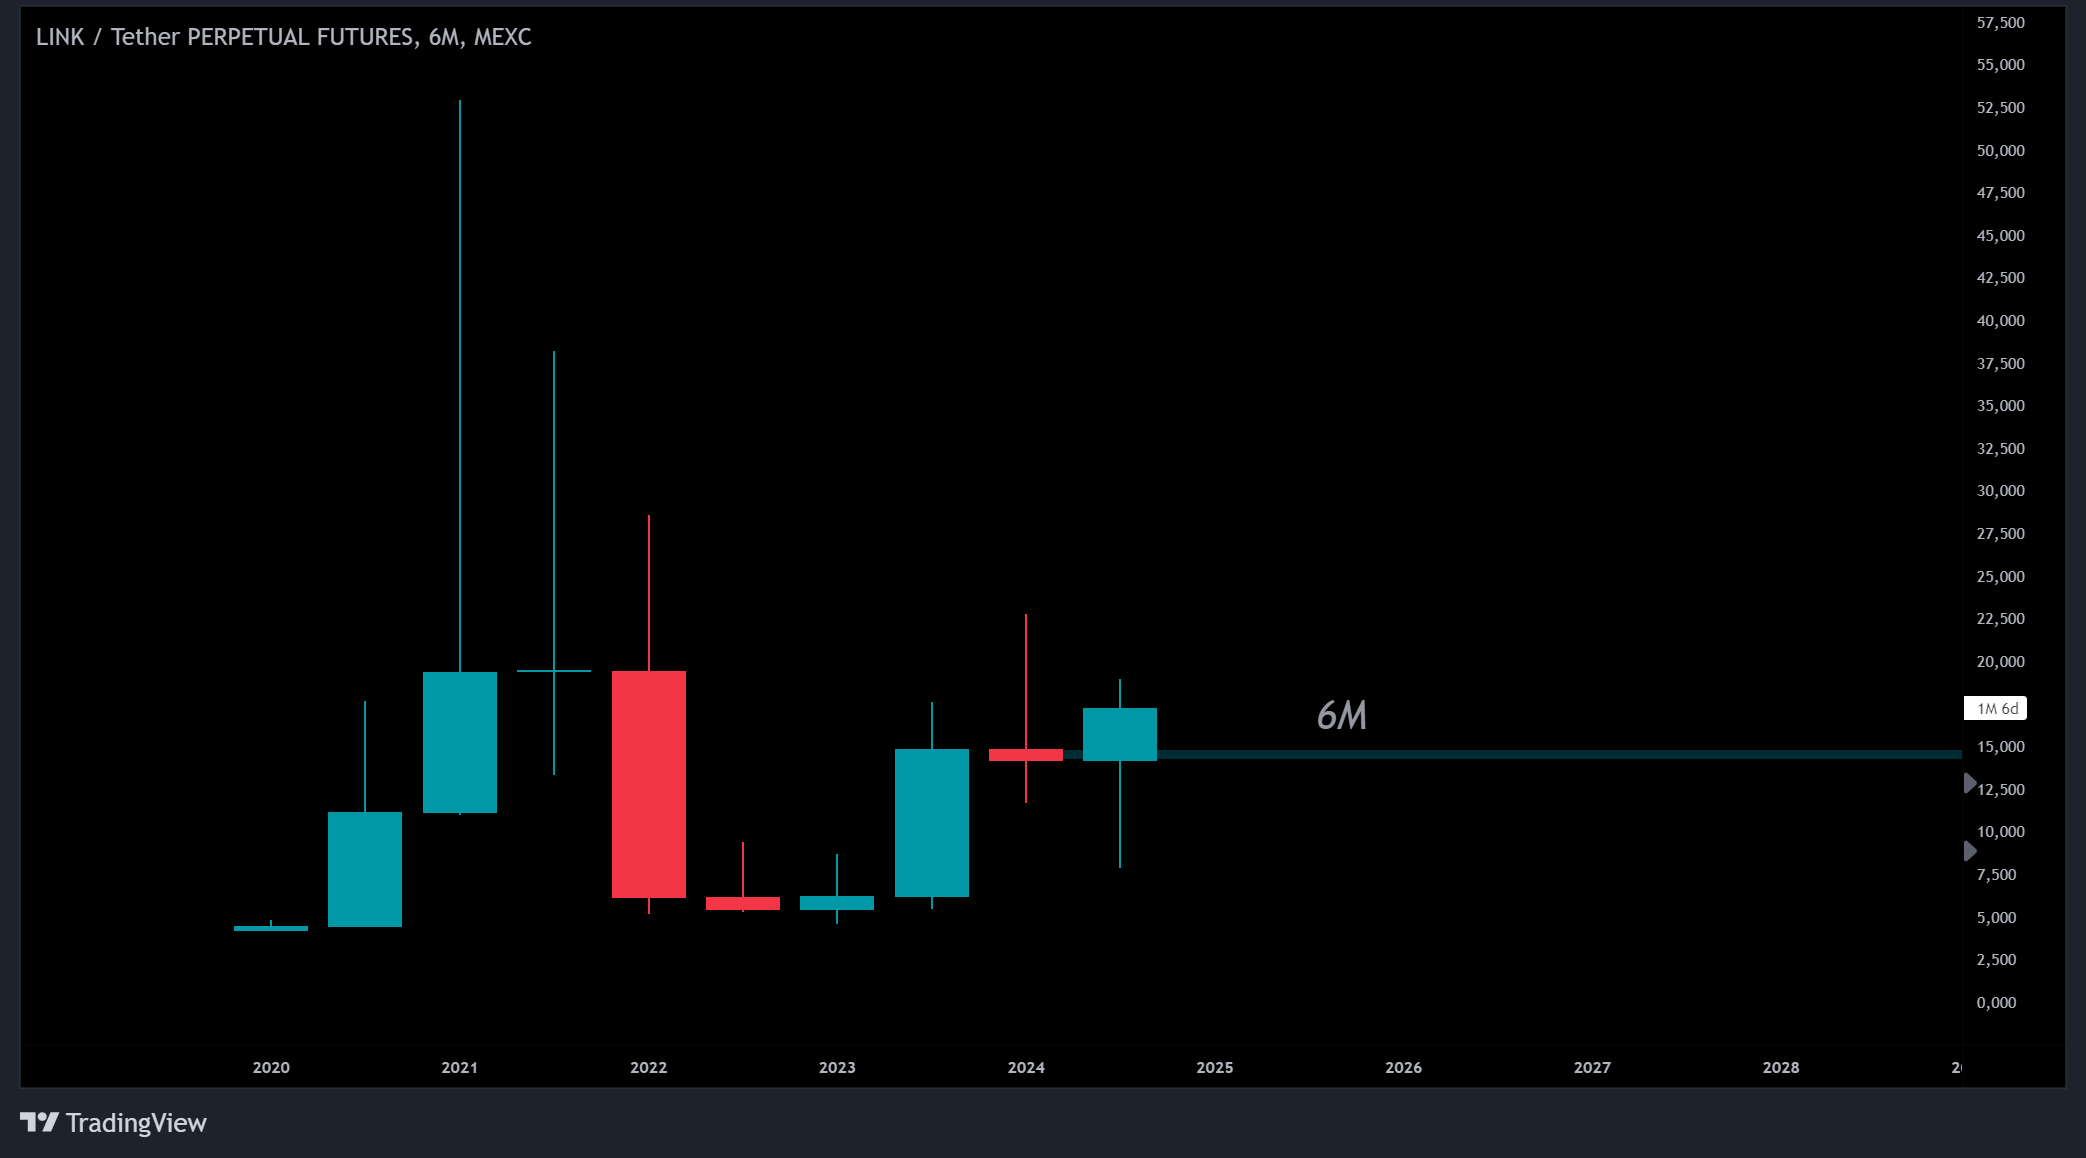
6M — Regular. On lower TF you'd consider ignoring a body that small, but since this is very HTF you pay attention:
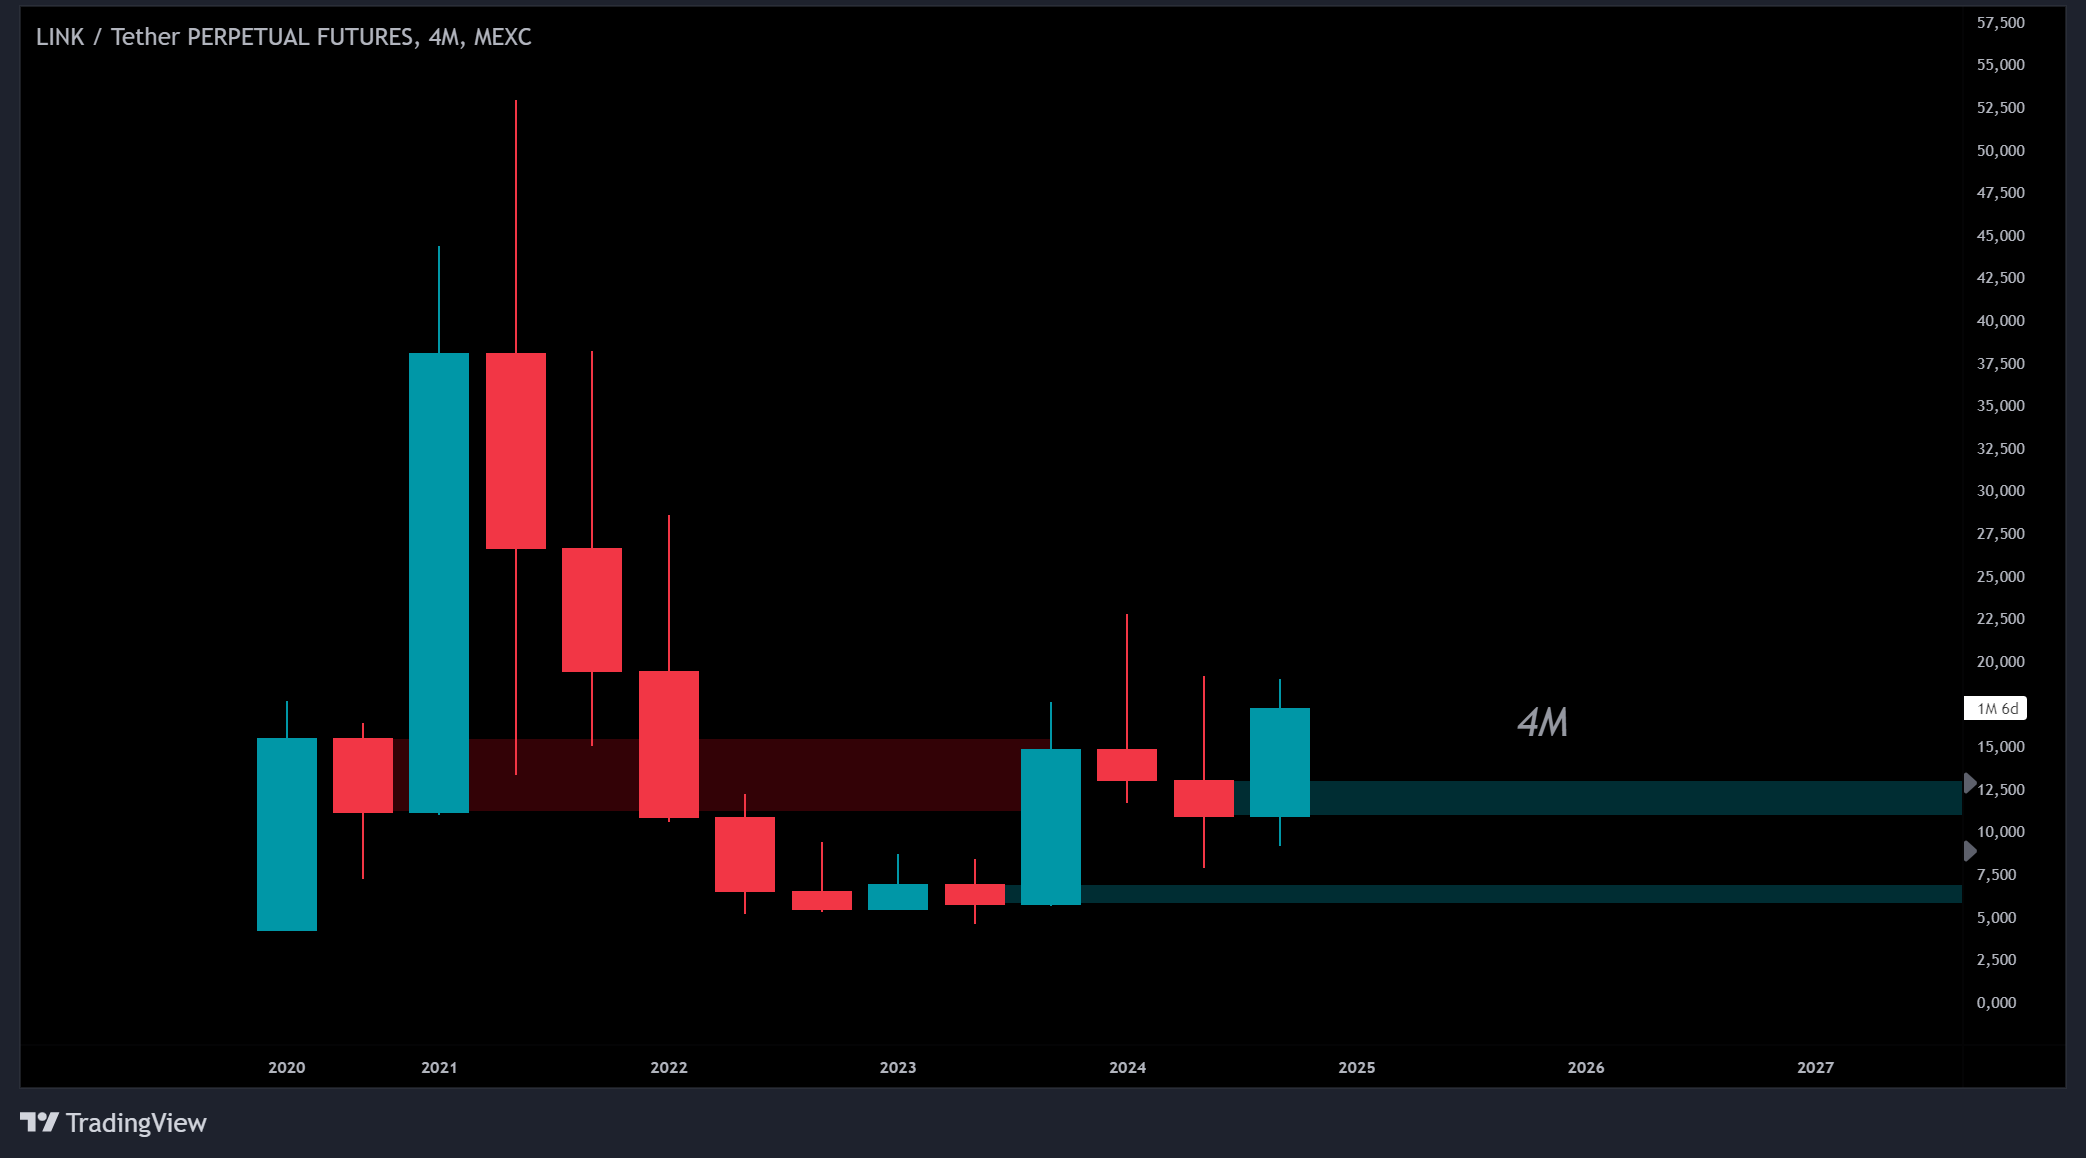
4M — Red: probably too mitigated. Has a wick into it, looks over the 0.50 mark — an OB with a wick over 0.50 is typically ignored. However, on 5M chart (very HTF), price will sometimes dip into an HTF OB 2 or 3 times before reversing. Test the hitrate. Top green: regular OB. Bottom green: more typical OB pattern with decent distance pump:
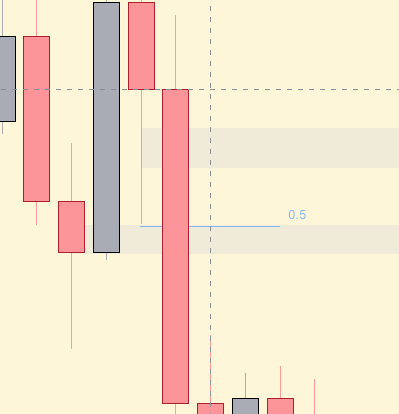
3M — Red: valid regular OB until mitigated by recent green candle. Top green: regular. Bottom green: Partial OB (POB) — drawn to only include the part of the OB not touched by the green wick:
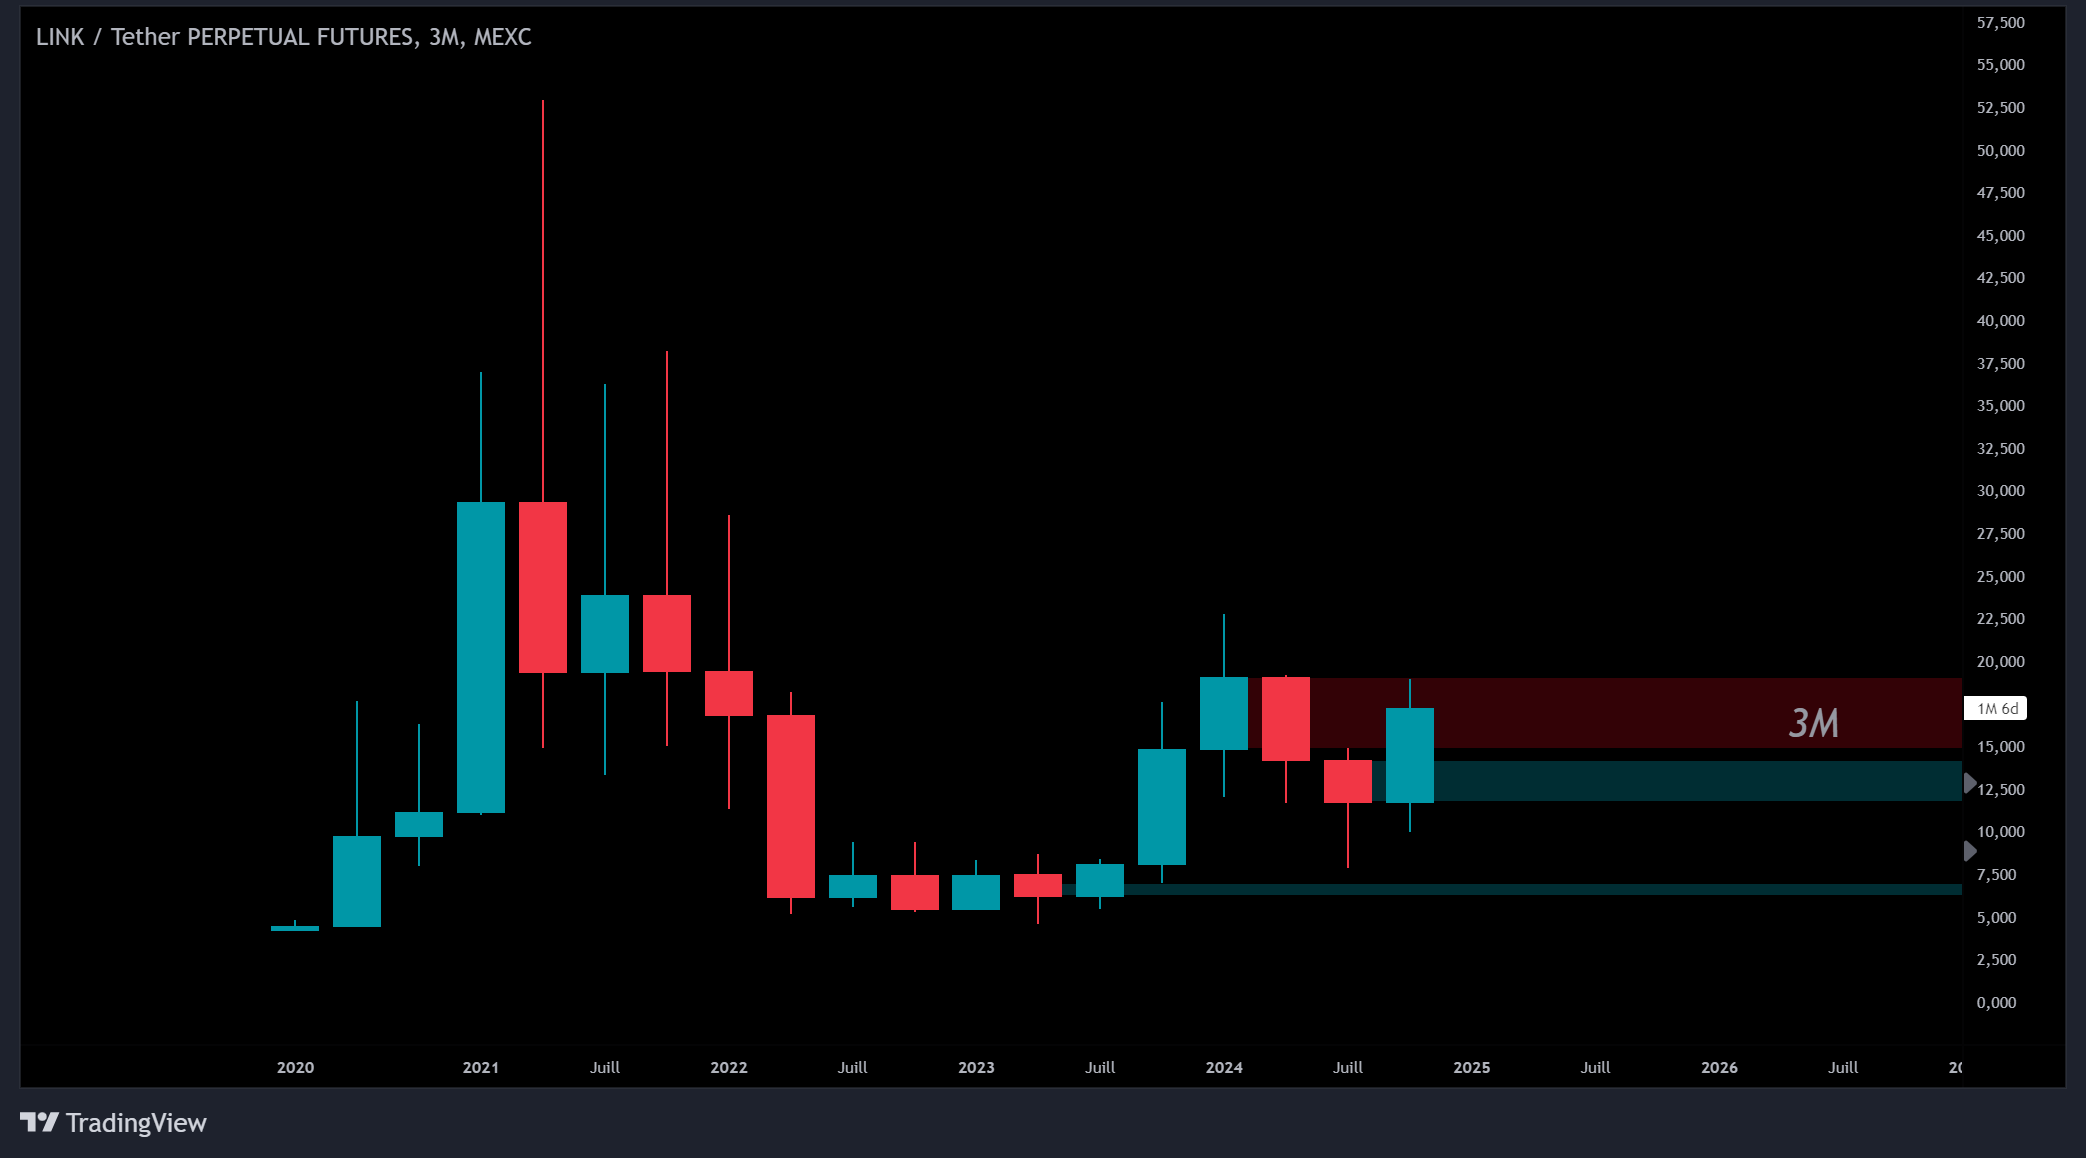
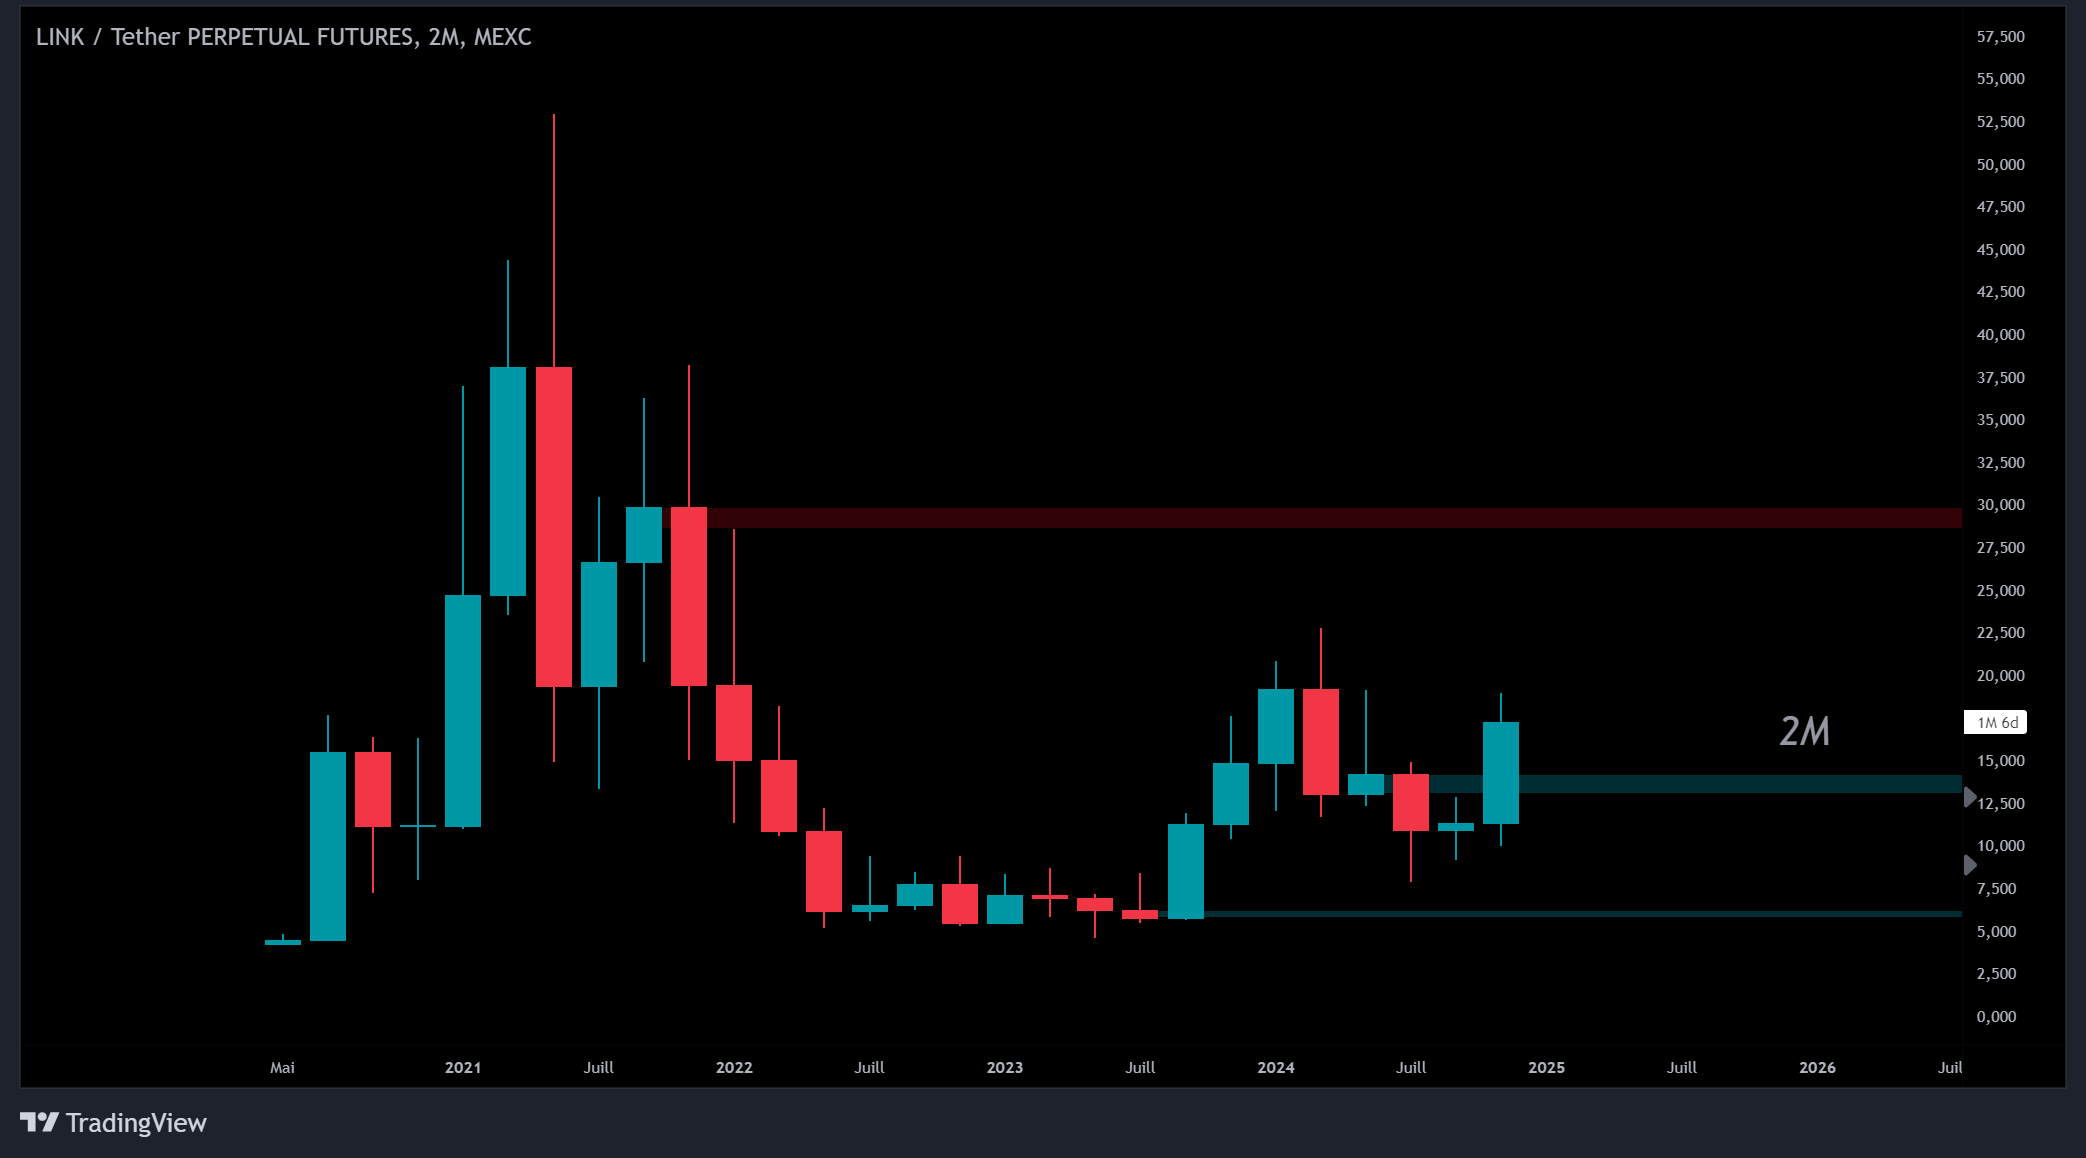
2M — Red: POB (same as previous but upside down). Top green: HOB. An HOB on this HTF is a big deal. Powerful — and with fib confluence, jackpot. Bottom green: regular OB:
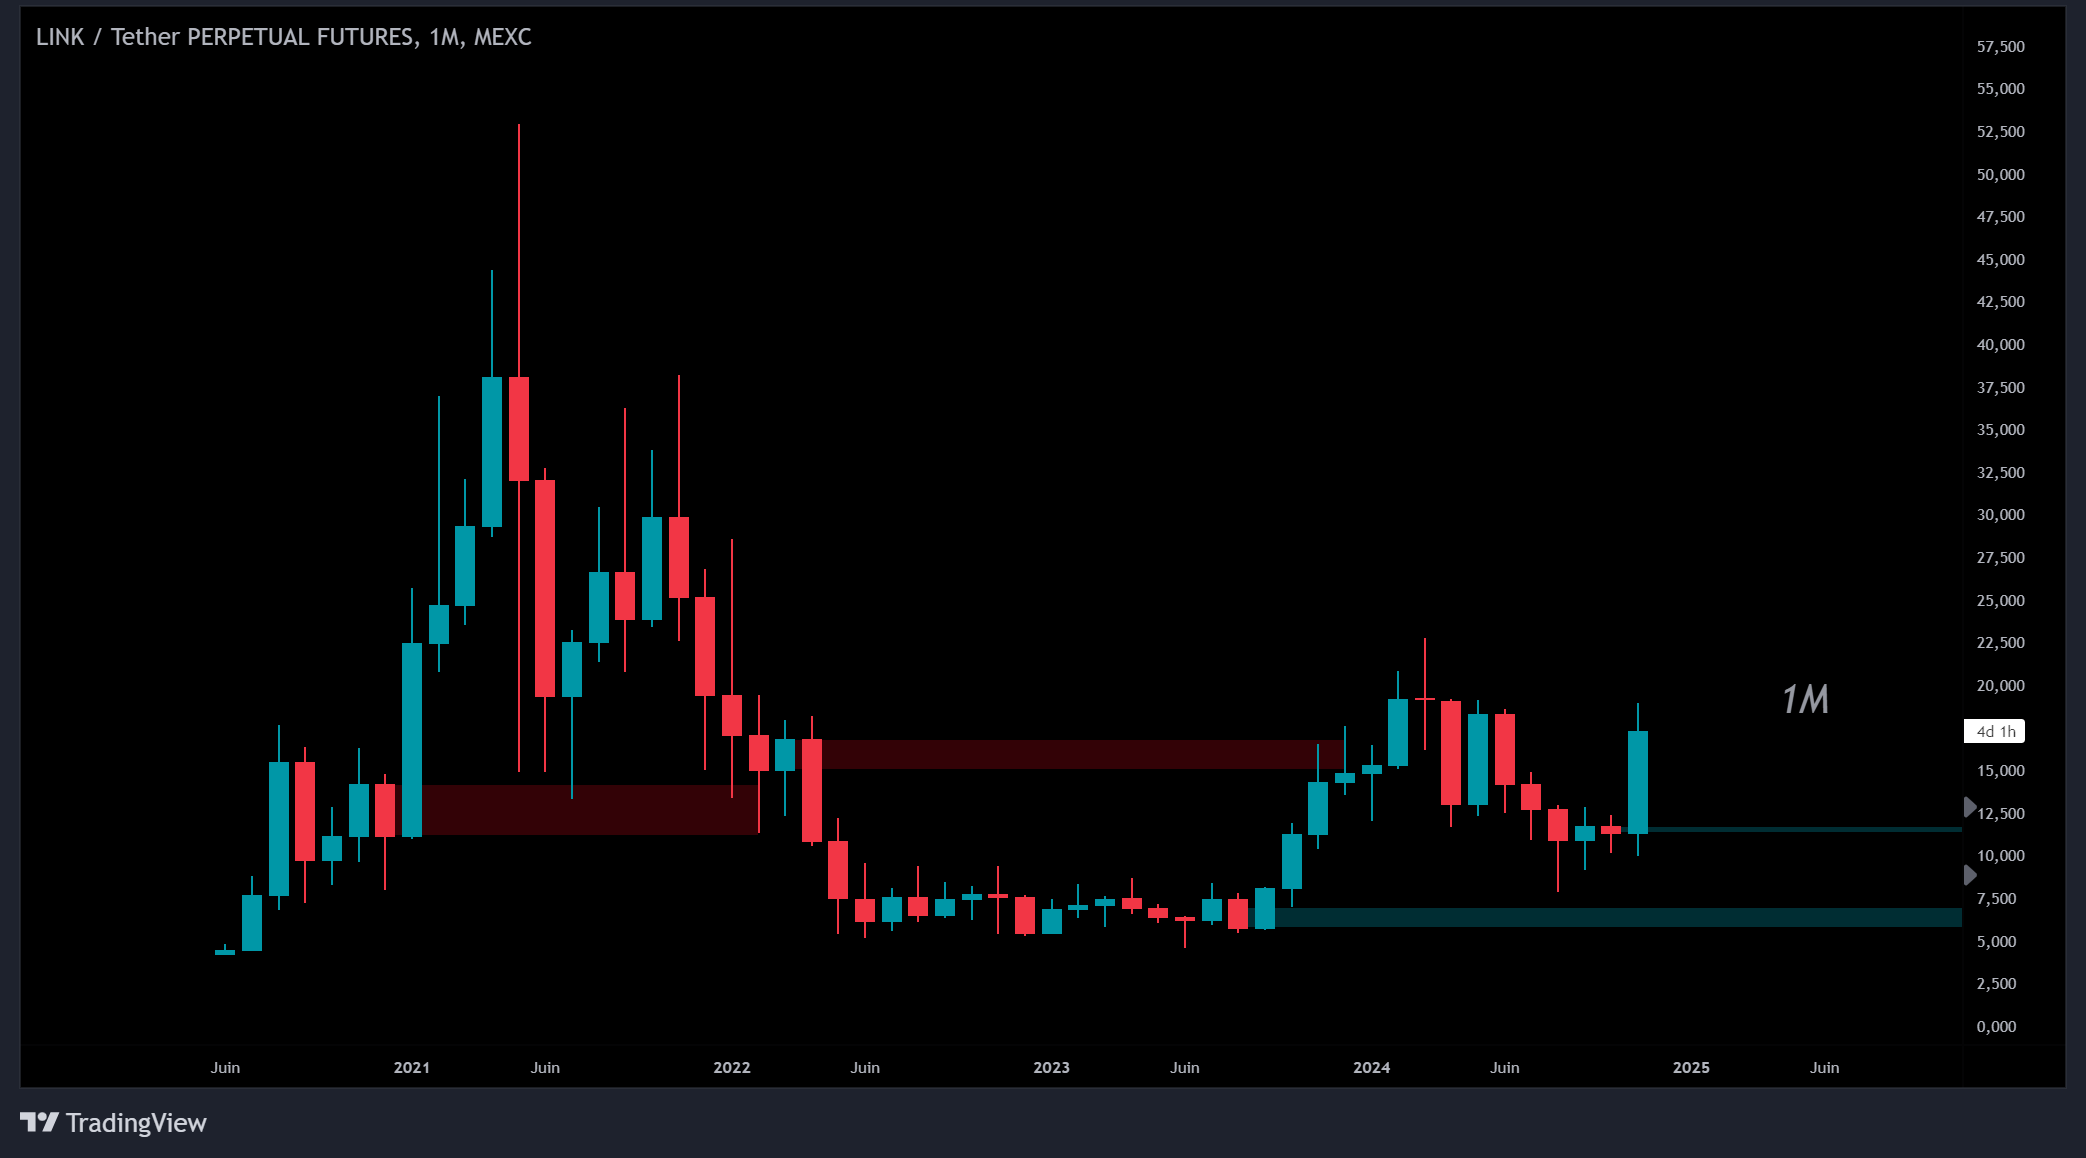
1M:
Red on left: regular OB partially mitigated by green wick (likely the long entry level). Red on right: regular. Both greens regular:
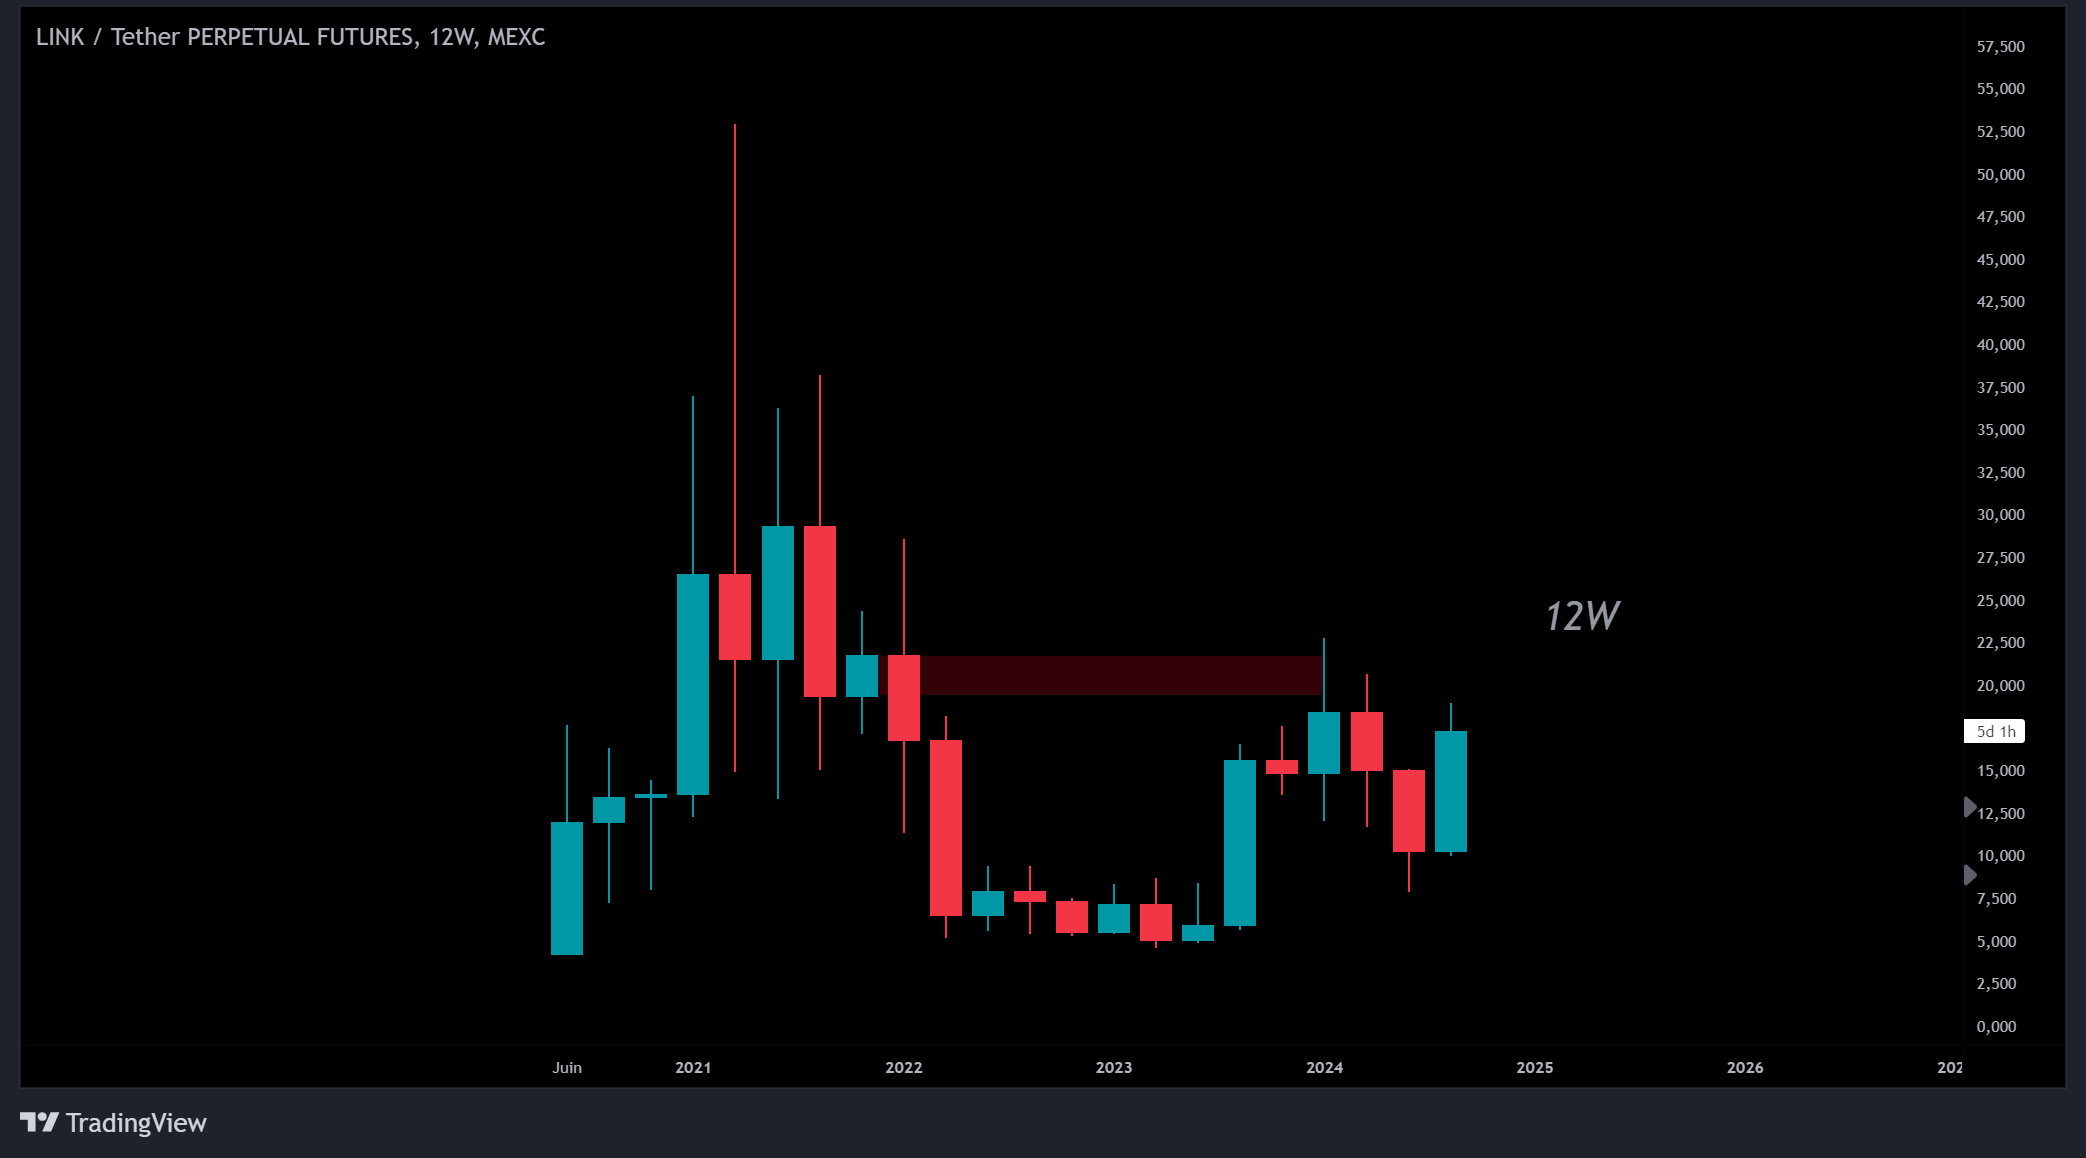
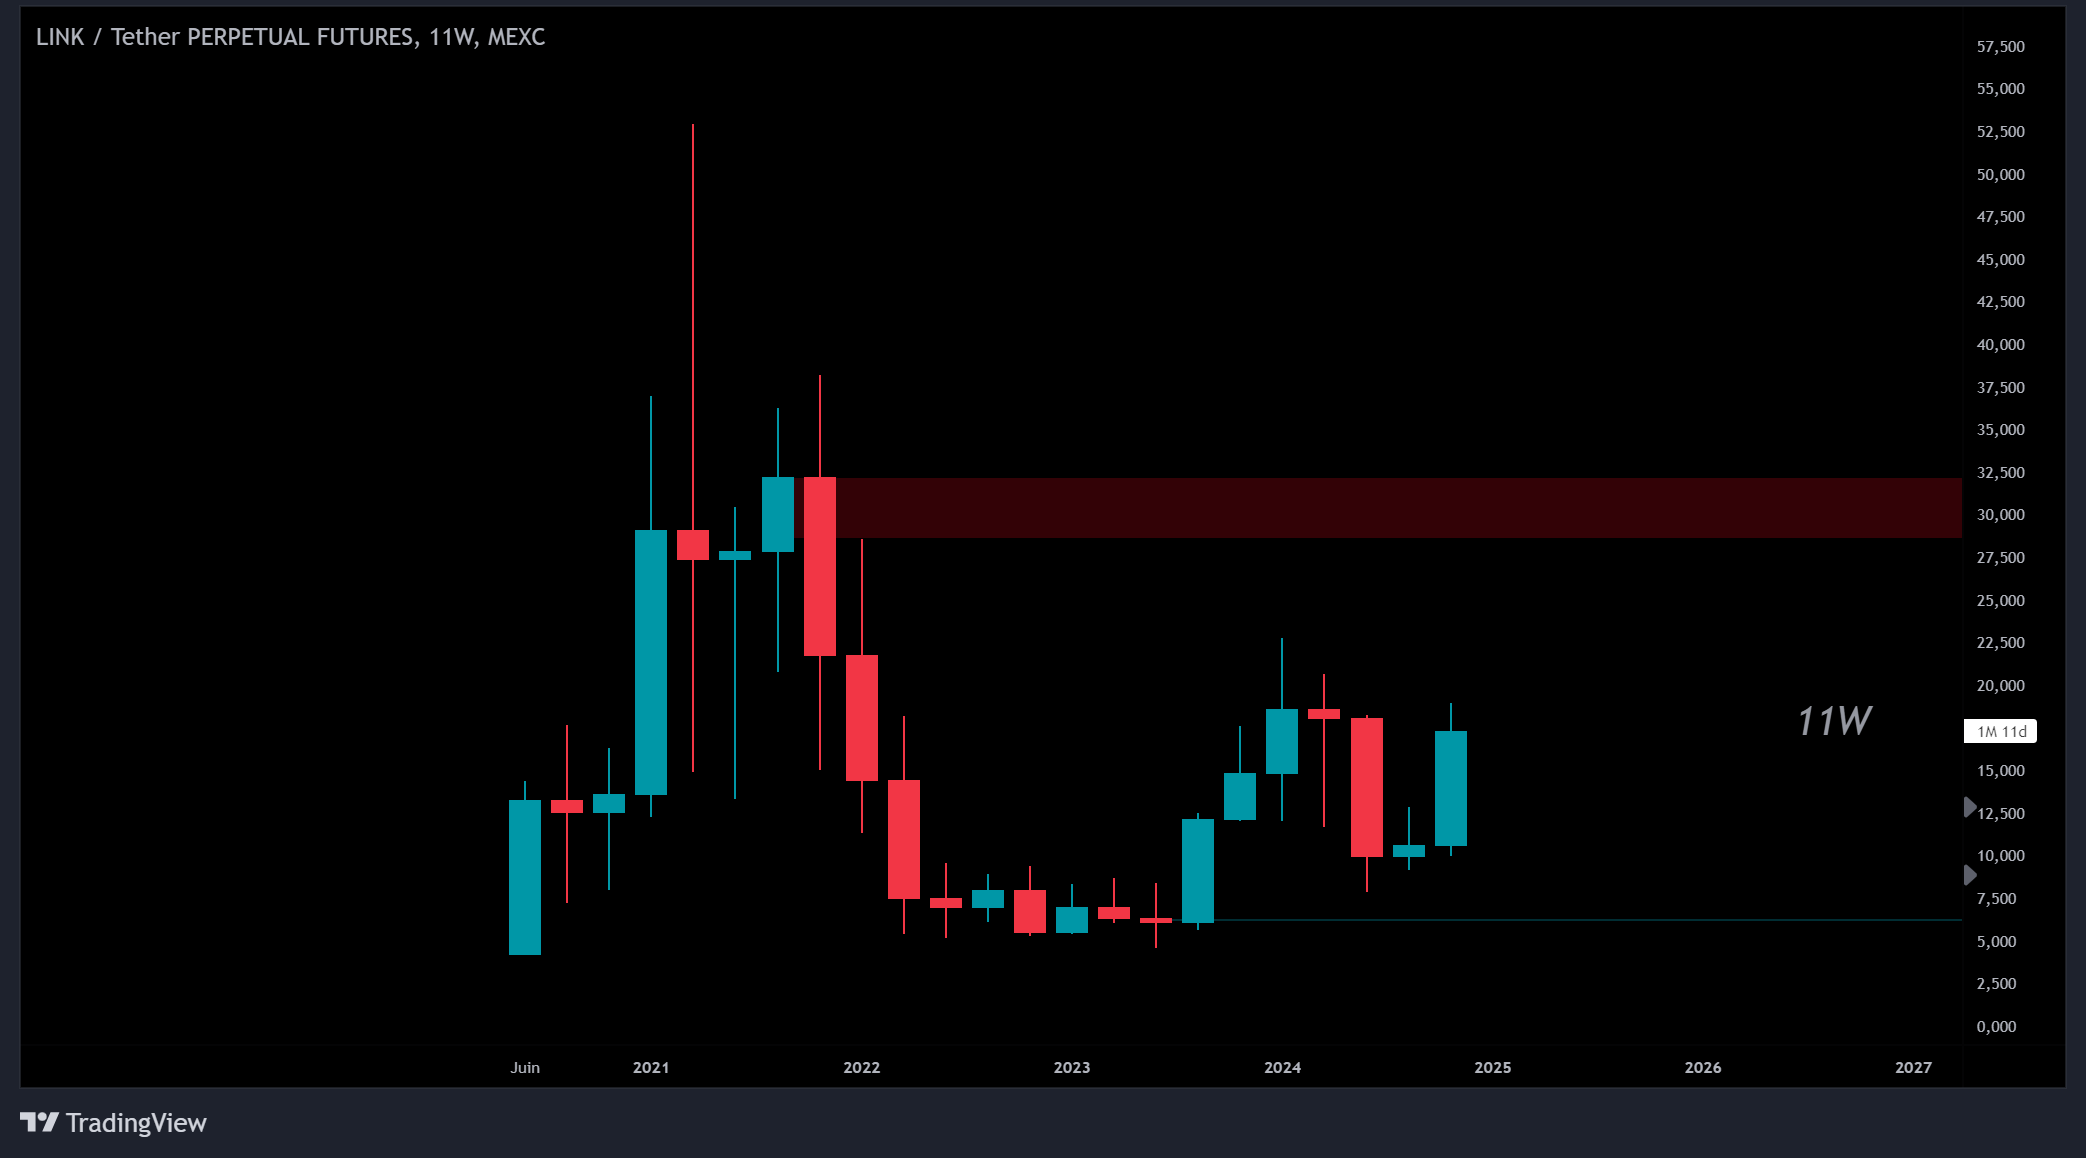
12W:
11W:
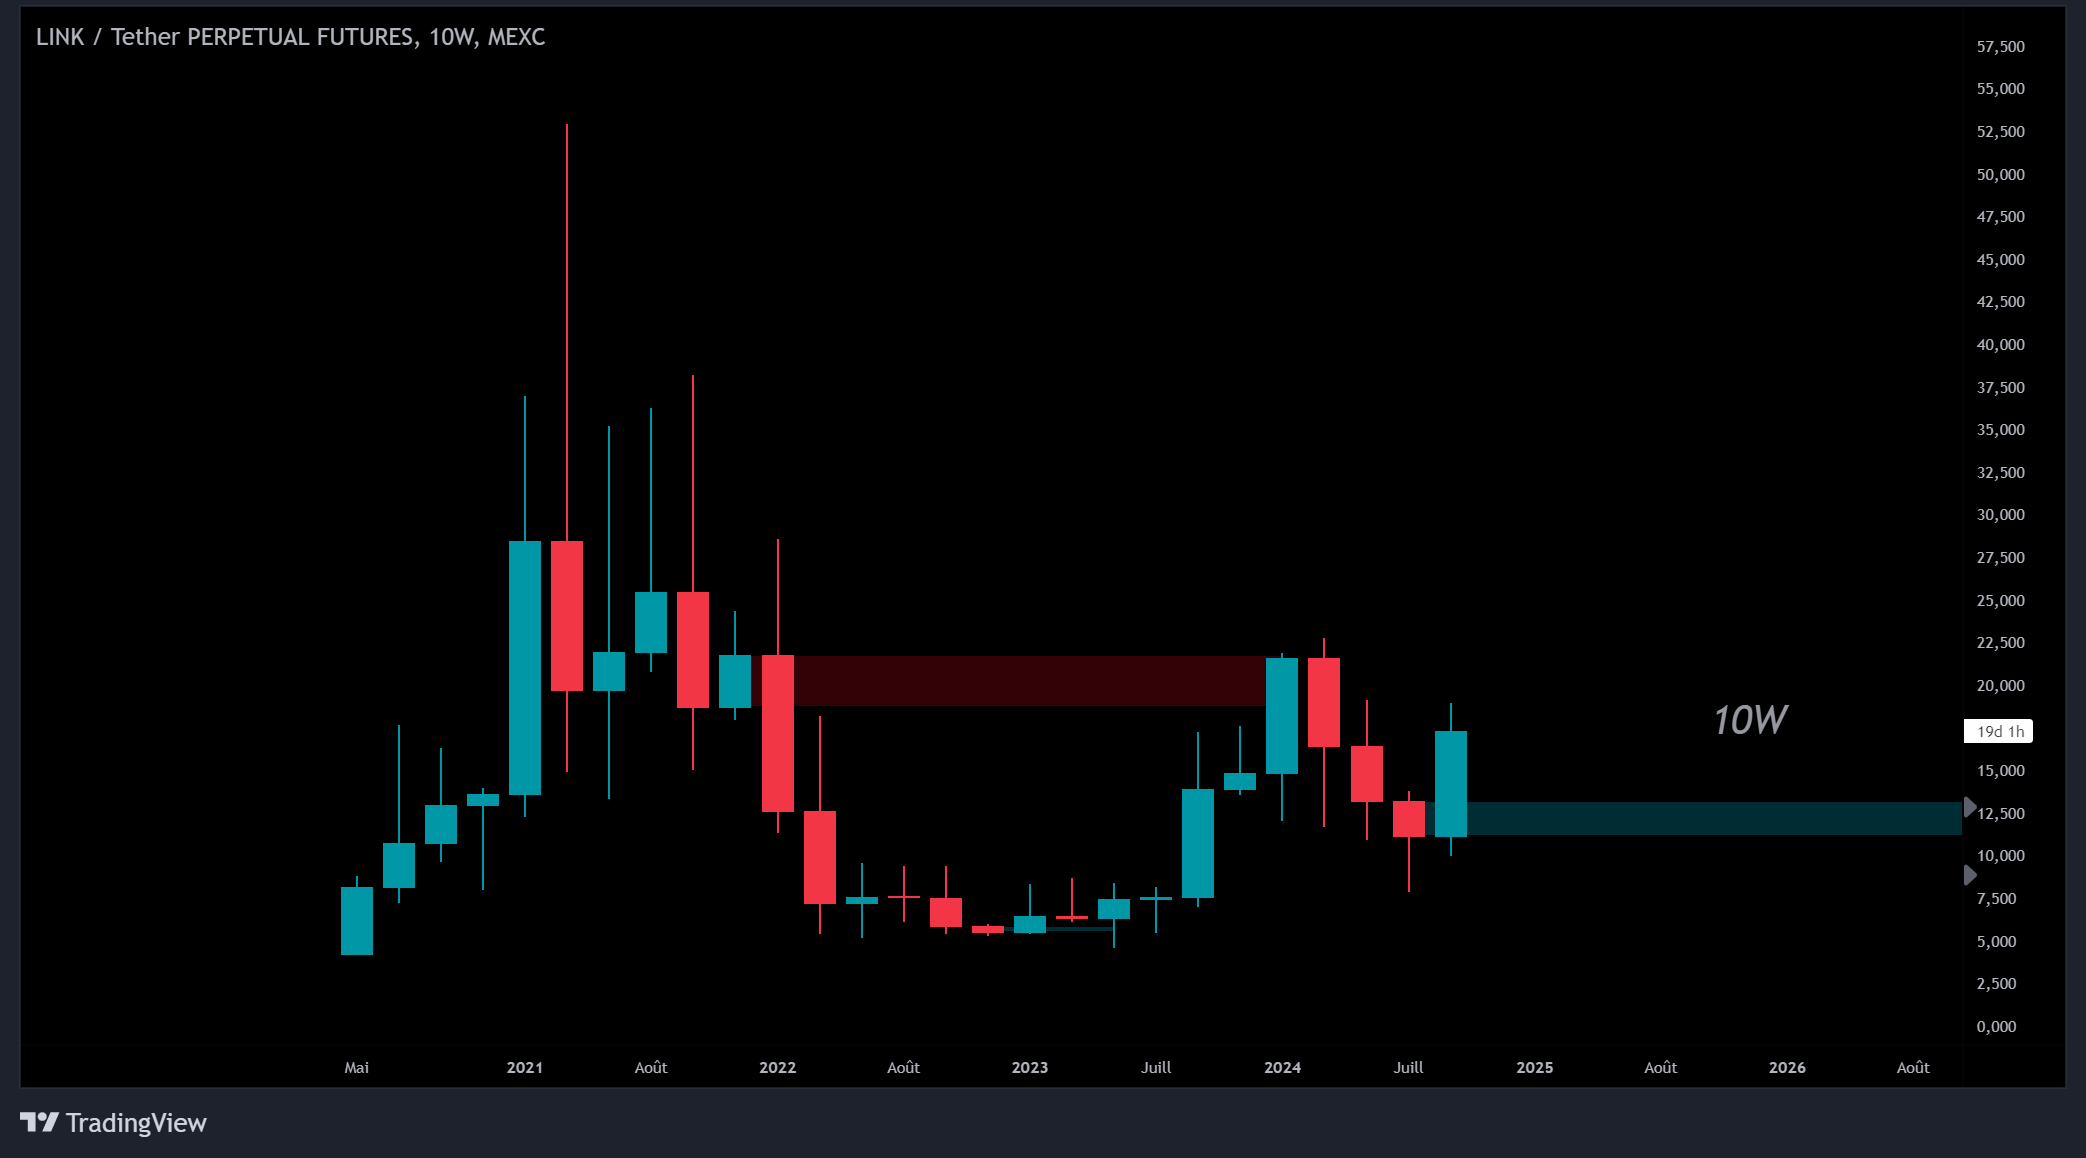
10W:
The higher the timeframe candle body, the more liquidity it holds. The
lower the timeframe candle body, the less liquidity is contained within it.
HTFs can represent billions of dollars in reversal pressure, while LTFs
might only reflect a few million.
A weekly candle carries significantly more liquidity than a daily, 12h, 8h,
or 4h candle. While these setups may take time to play out, the 24/7
nature of the market offers thousands of different opportunities.
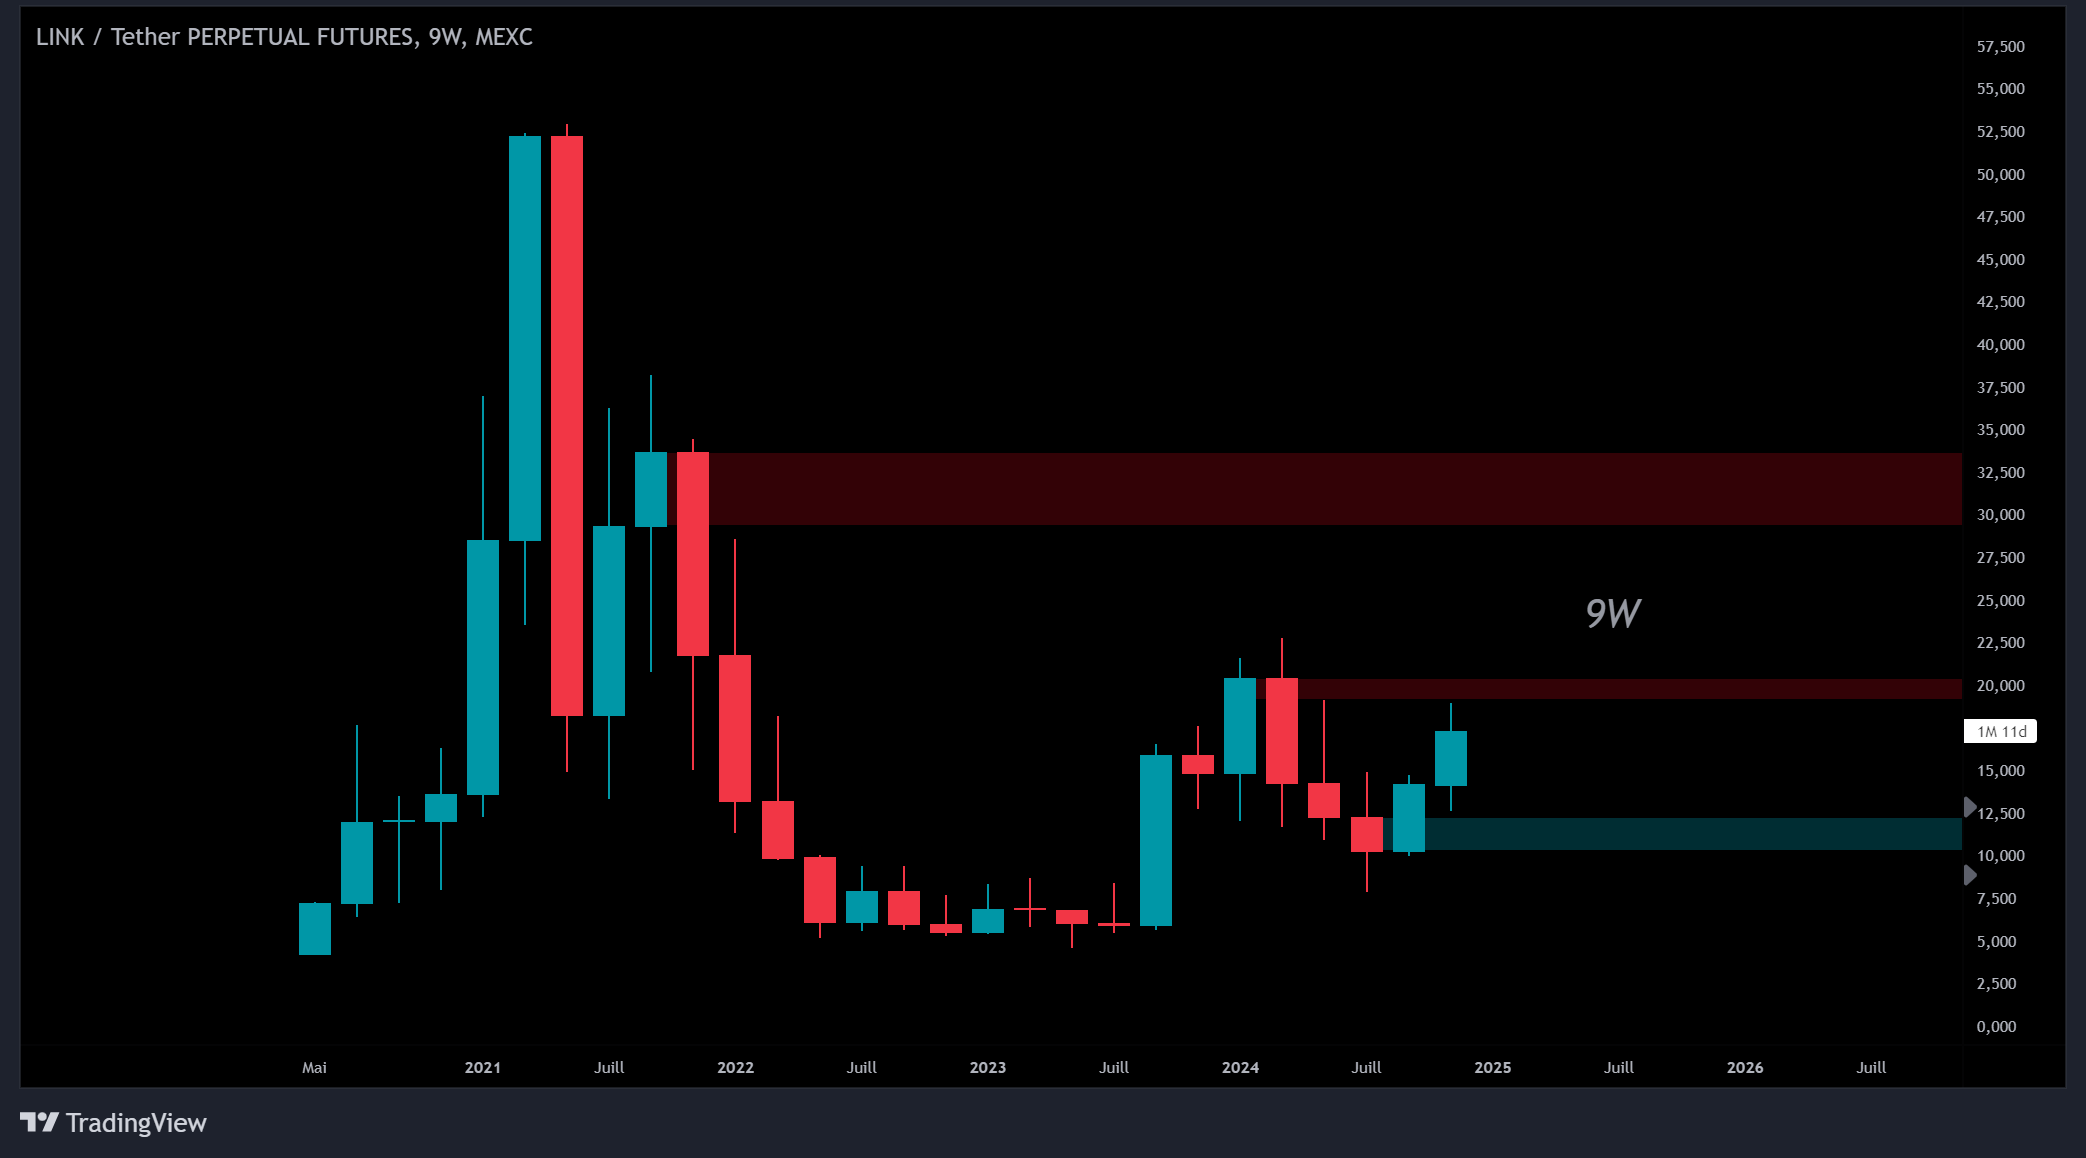
9W — Top red: regular. Bottom red: POB. Green: regular:
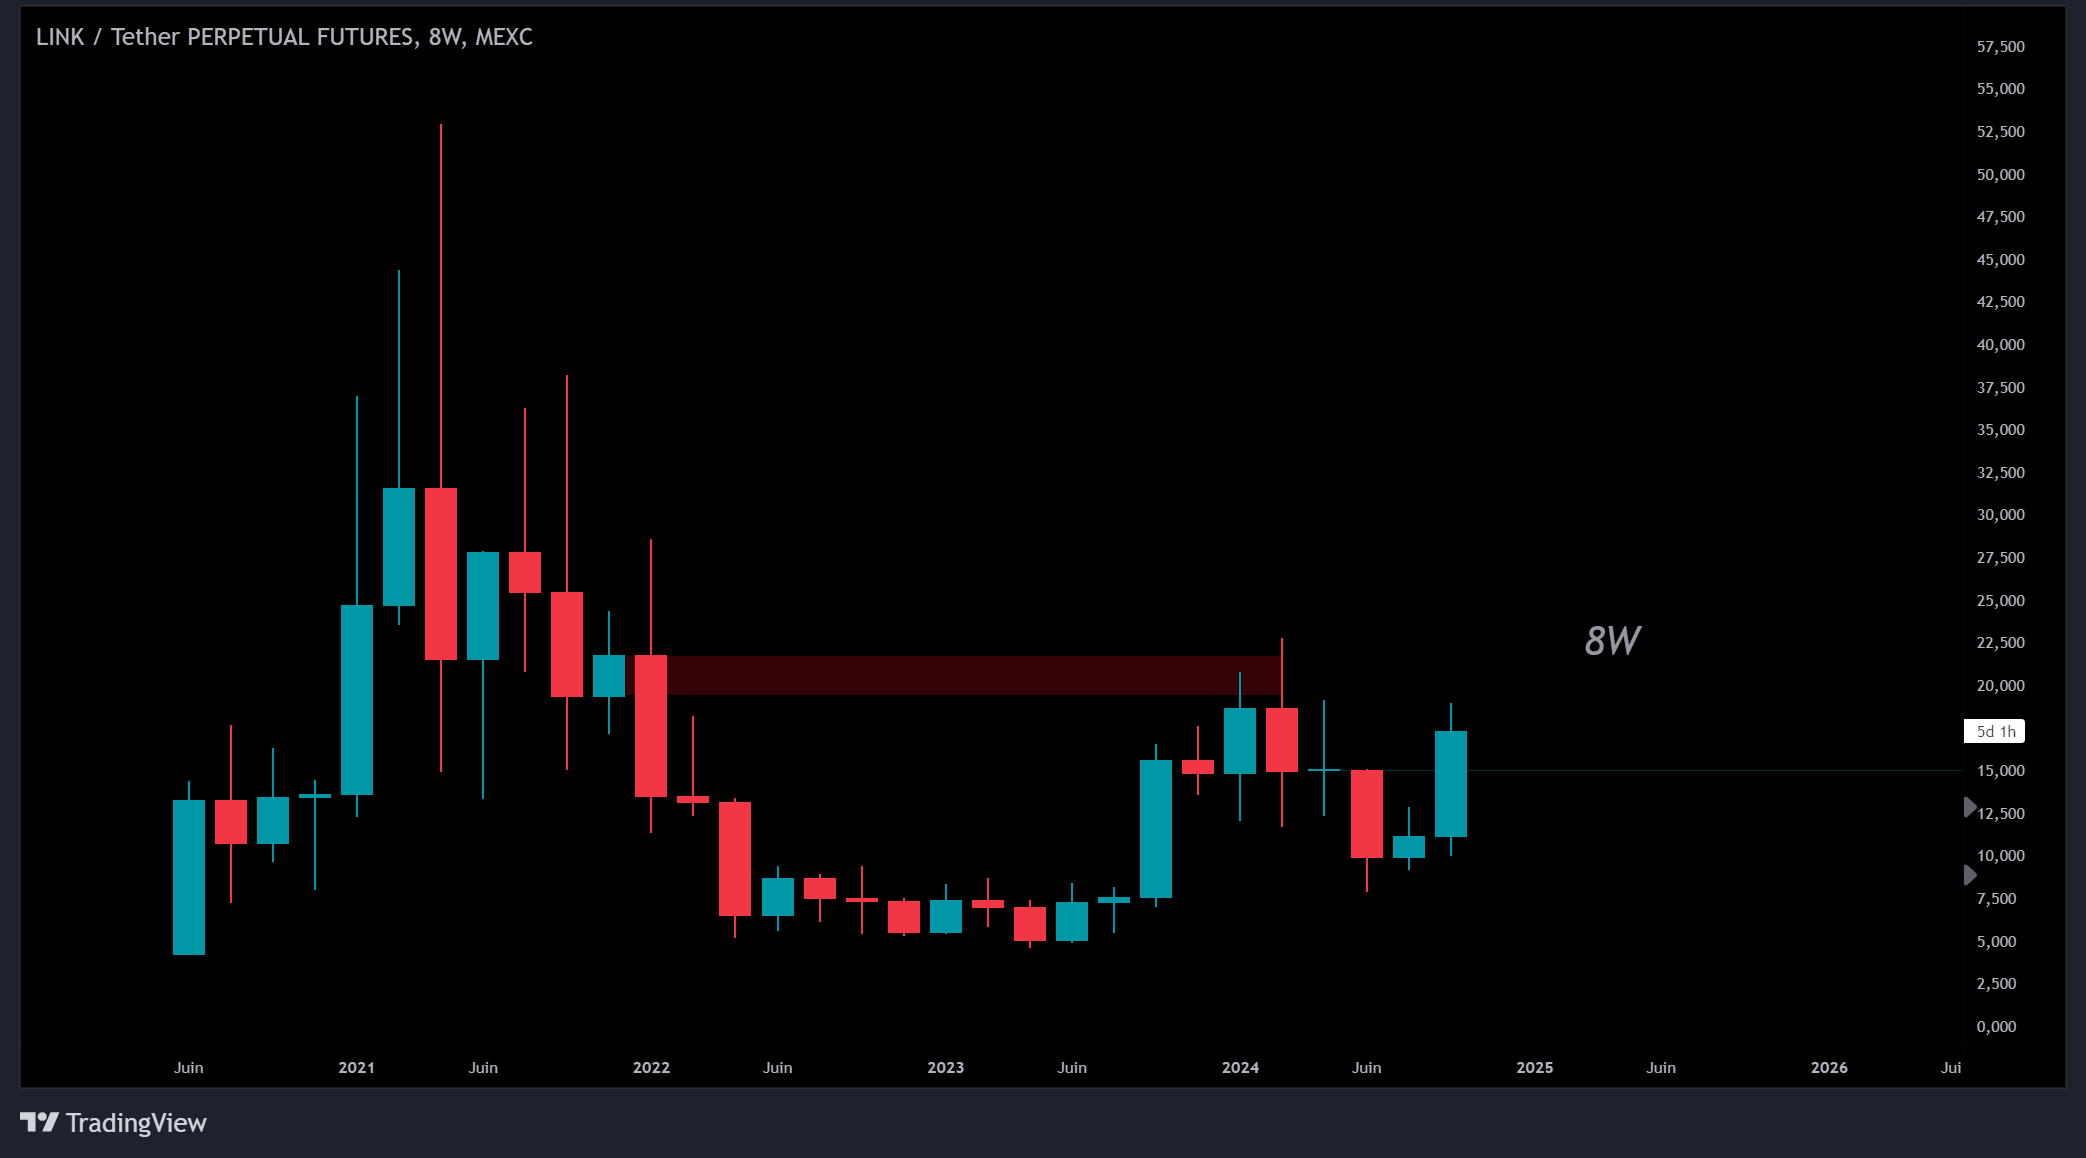
8W:
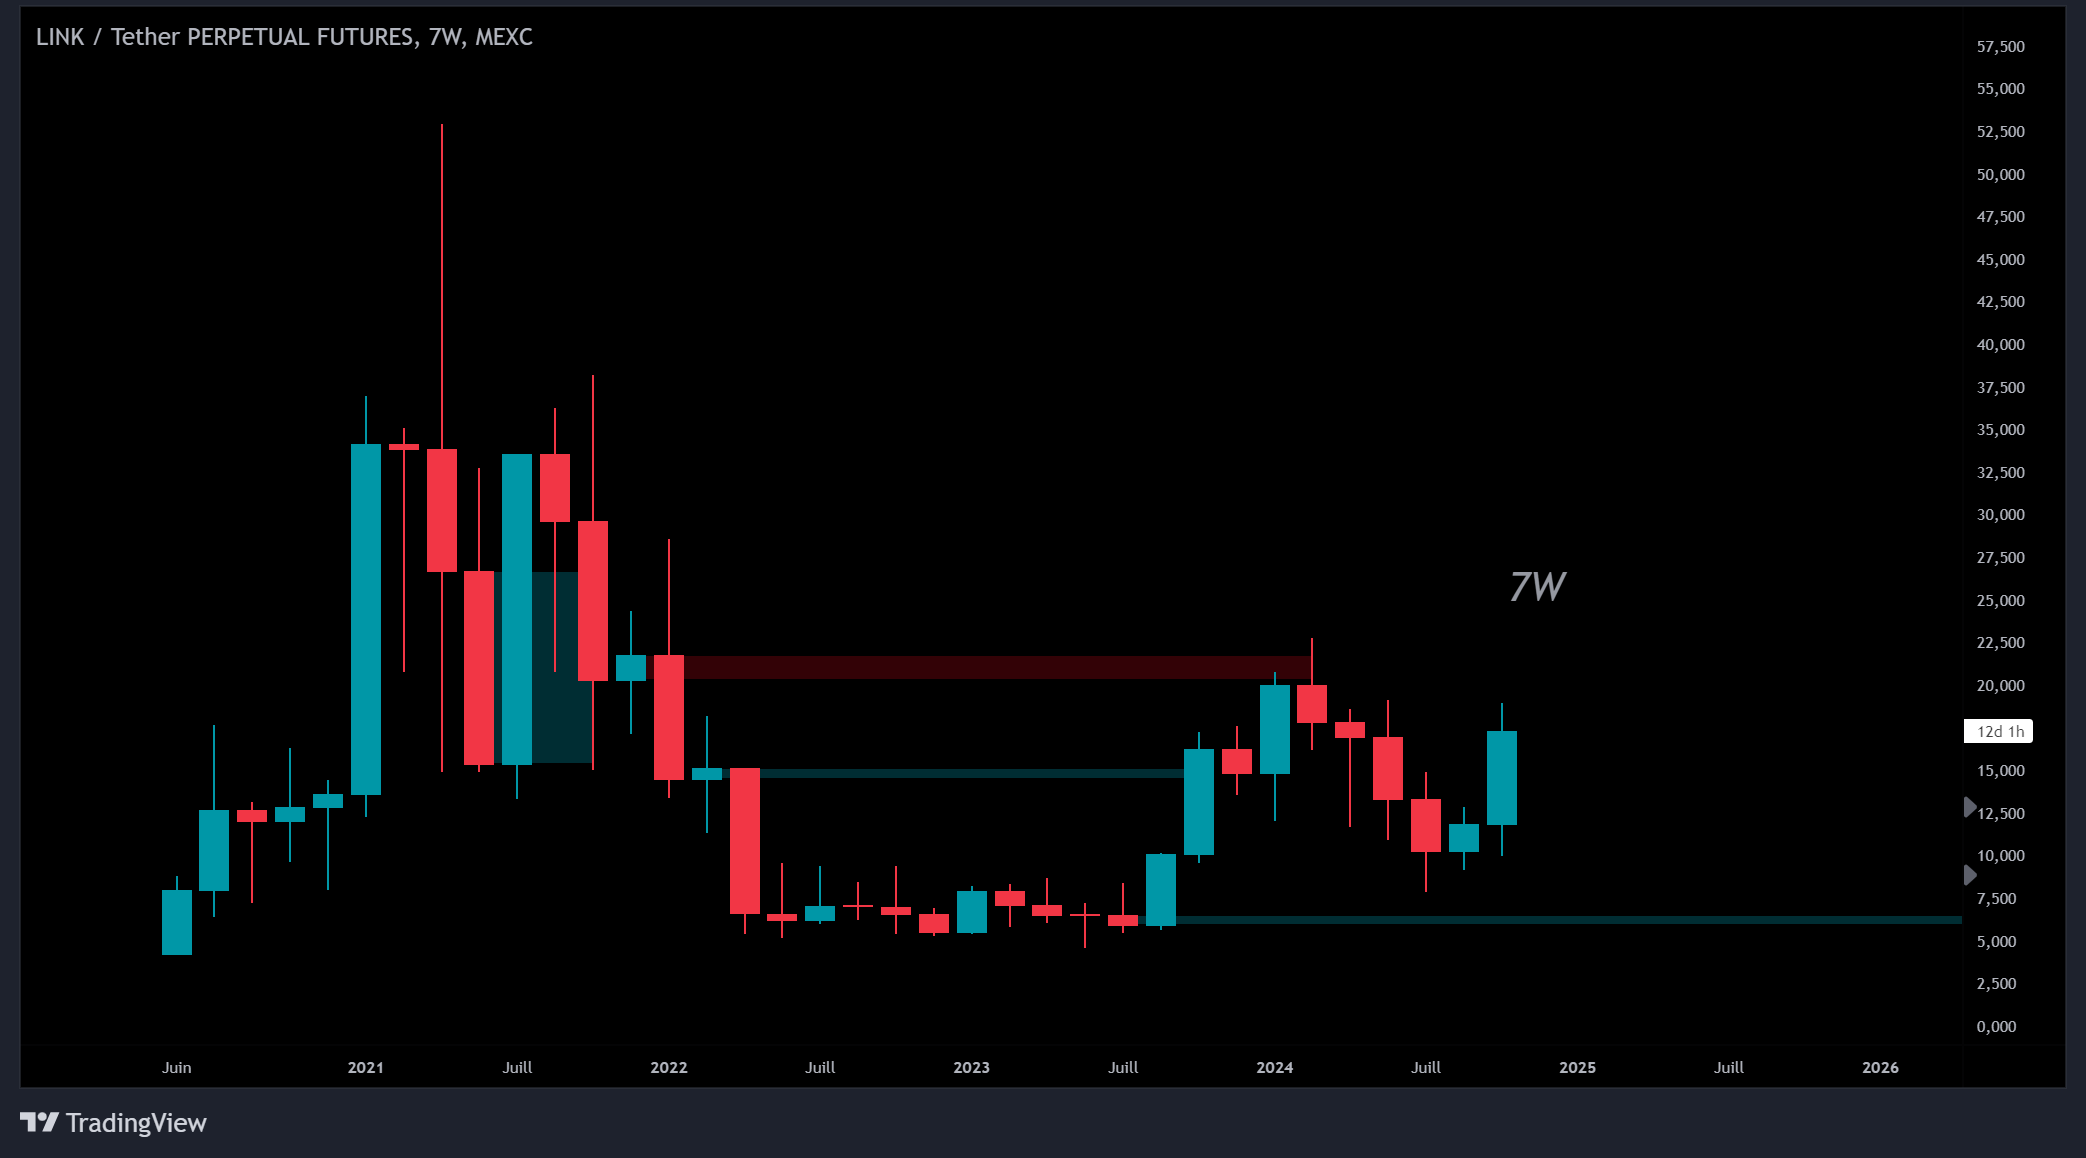
7W — All 3 regular OBs:
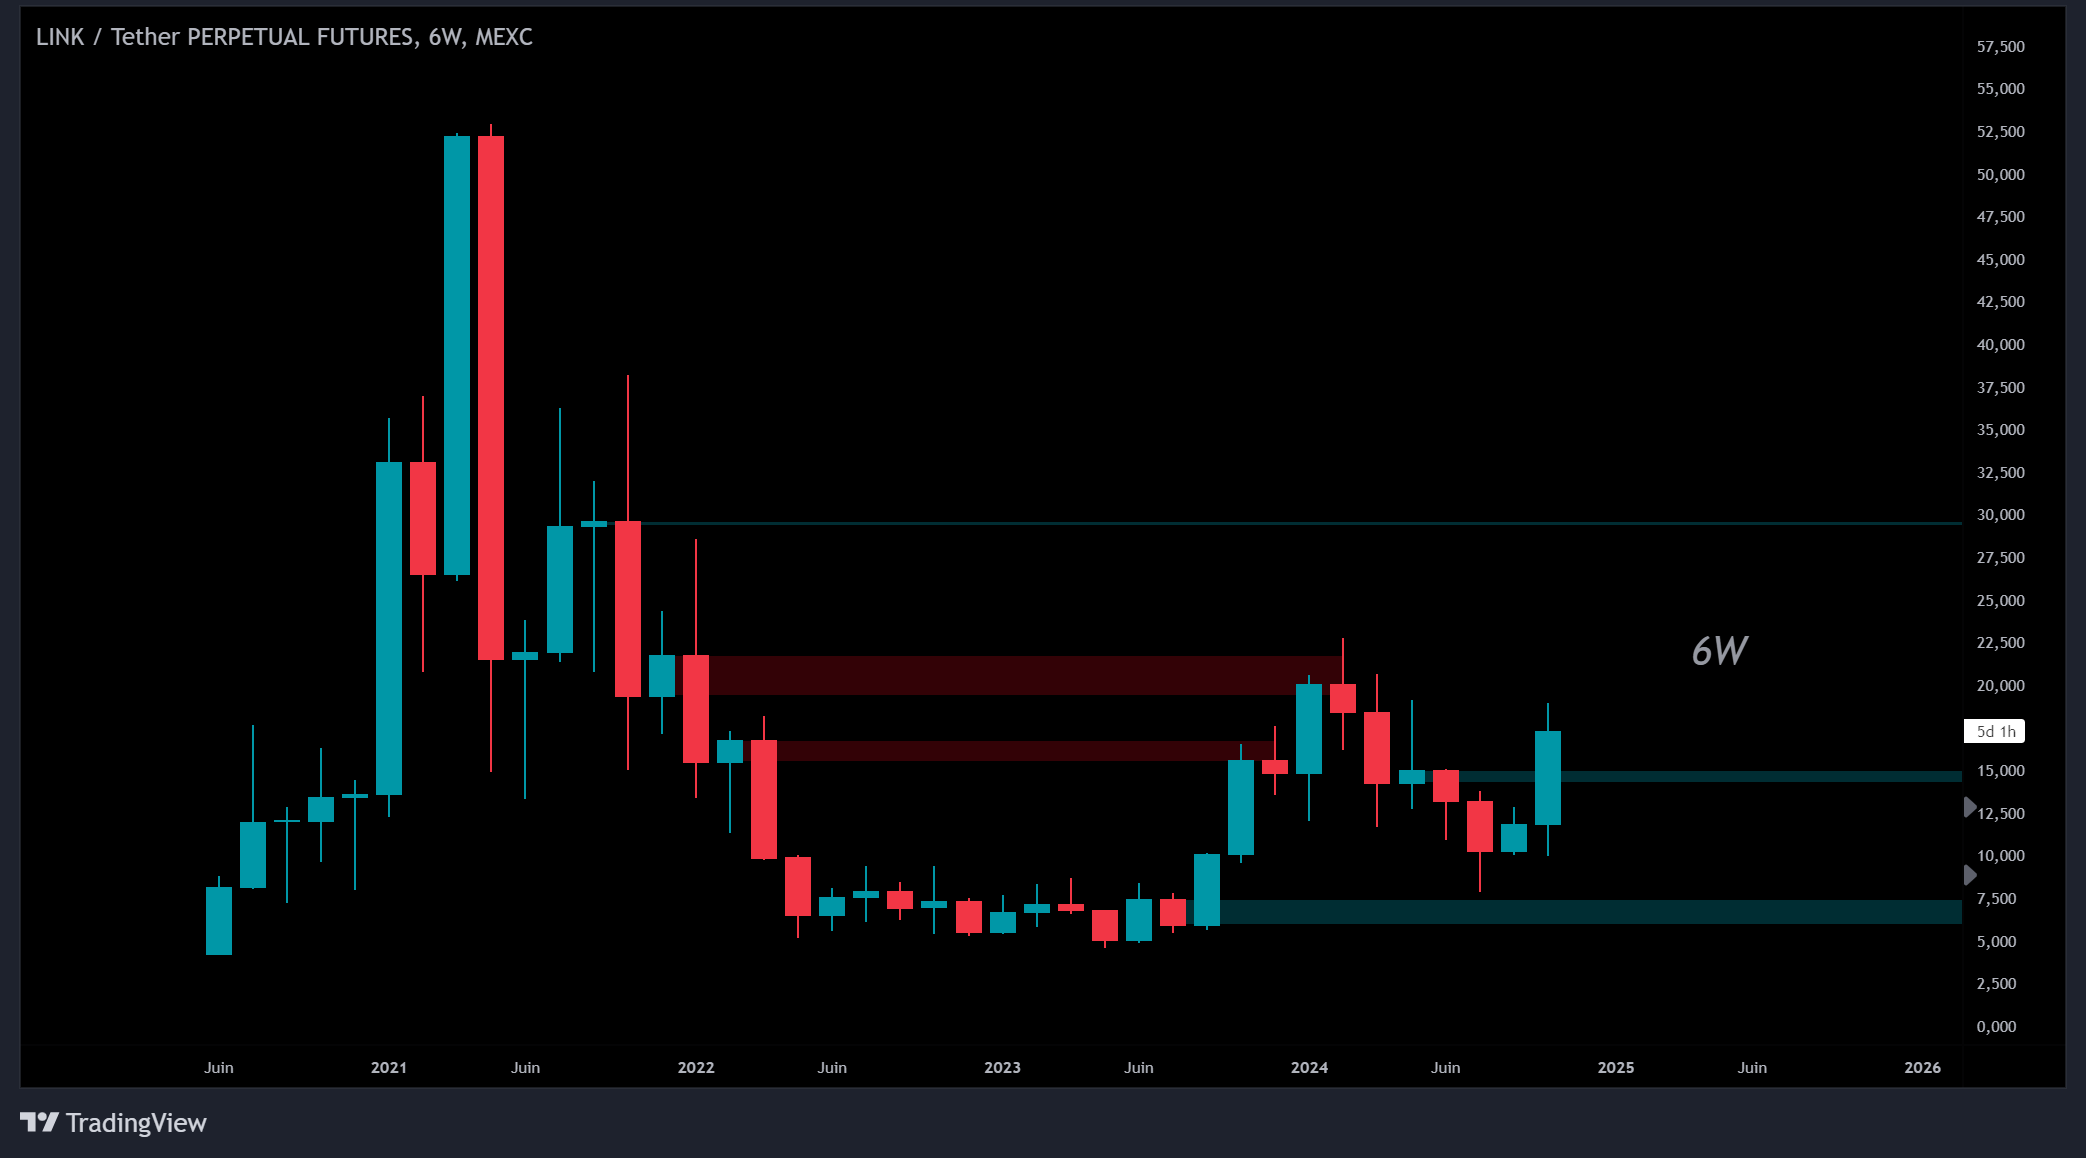
6W — All regular OBs except the middle green at $15 (HOB). The most recent candle is an FVG — though if the next candle retraces the entire green candle, the HOB would be mitigated:
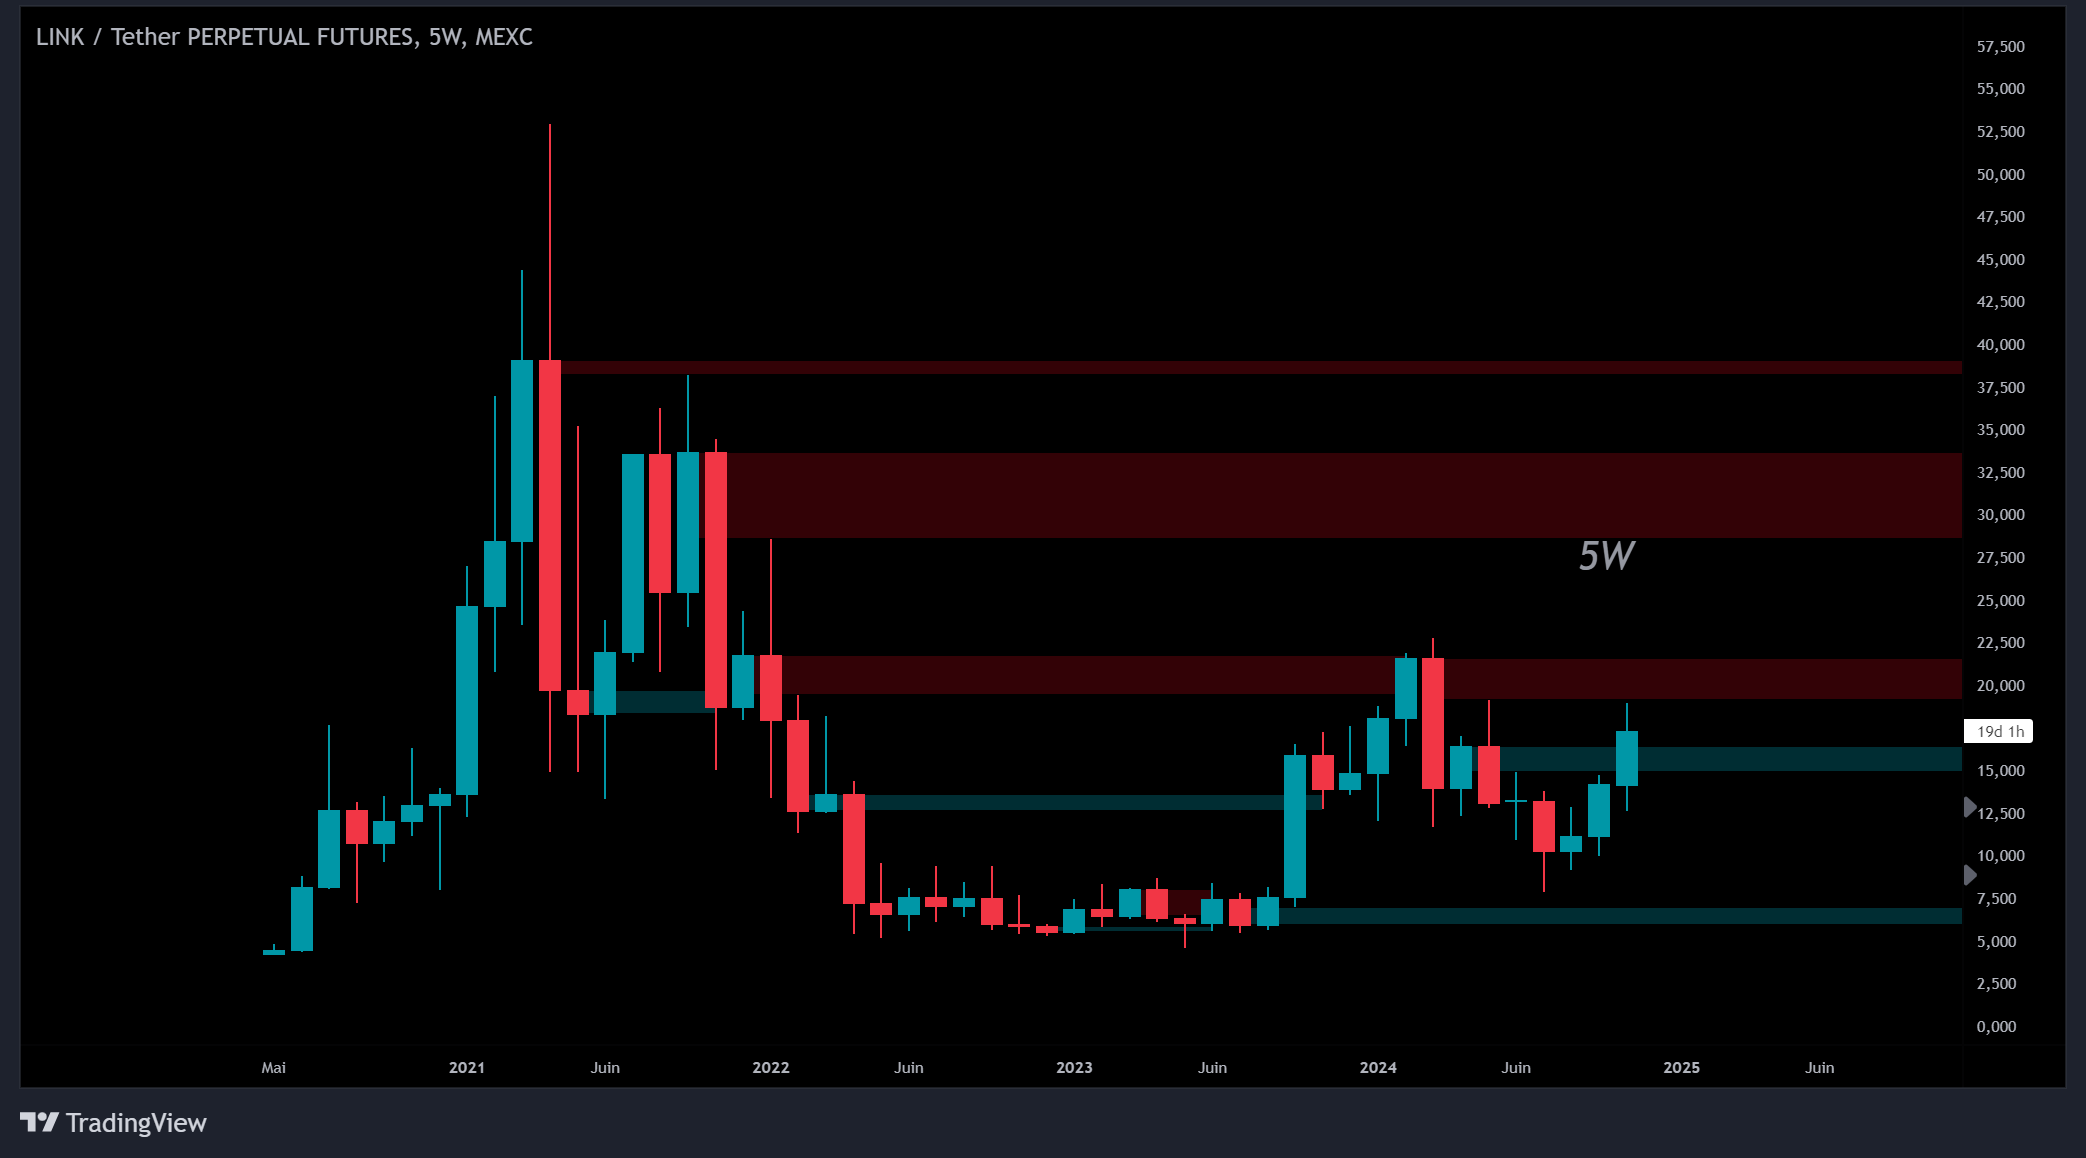
5W — Top red: POB. Middle red: POB. Lower red: both POBs. Left green: regular until mitigated. Middle green: regular. Top right green: PHOB. Bottom right green: POB:
The rest, figure out on your own:
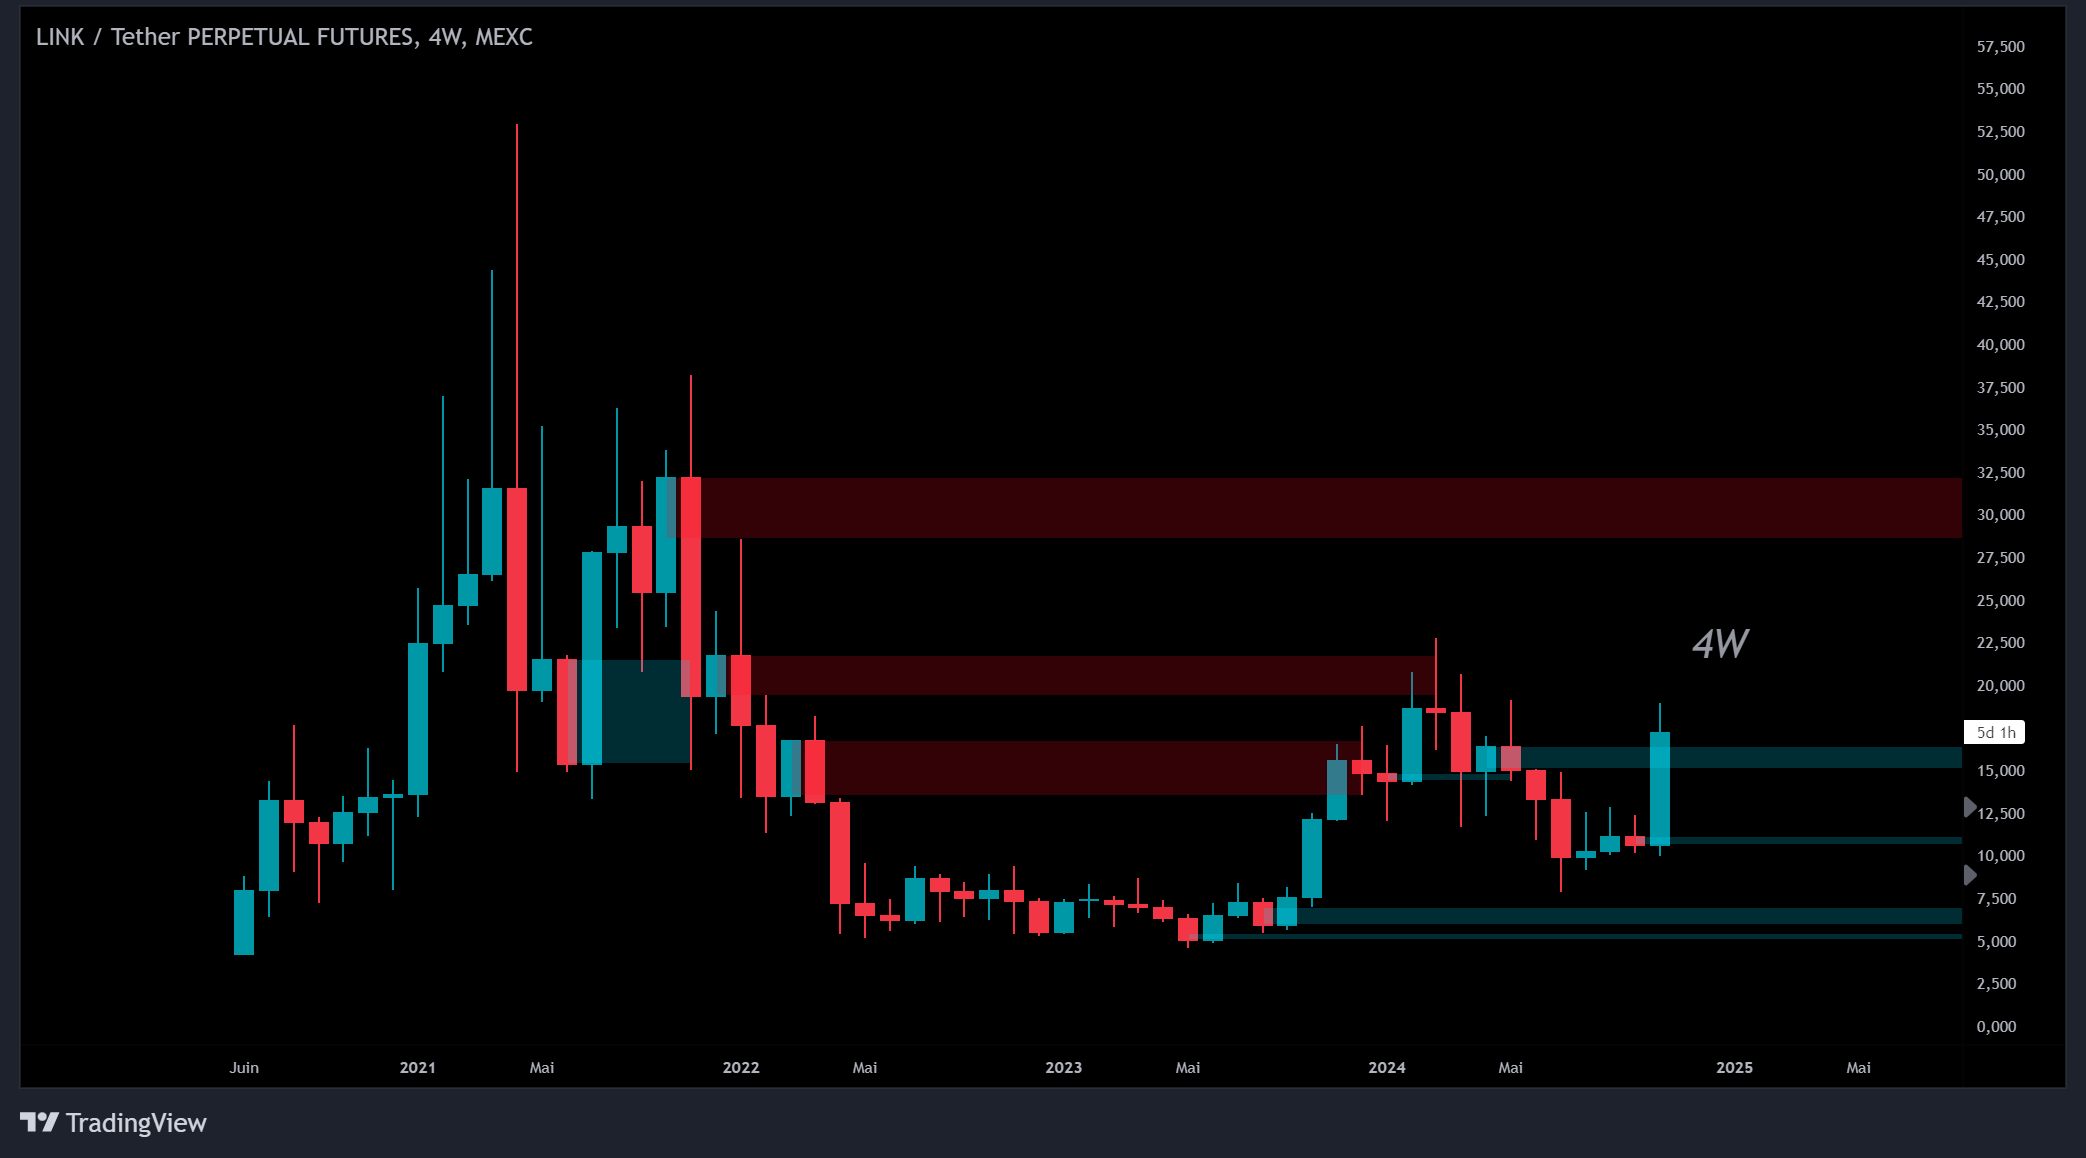
4W:
3W:
2W: MS matters. The higher the timeframe, the more powerful. The more you can refine, the more powerful. If you find a key level on Weekly, that is also a key level on 5D, 3D, 2D, 8H, it's a strong level. If you find a key level on 2W, W, 5D, 3D, 2D, 8H, and can refine entry with timeframes below 8H, it's semi-optimal and potentially optimal if it's Bitcoin or a high trading volume coin. If you find a key level on a single timeframe, such a daily, it doesn't mean you should completely ignore because it's not on any other timeframe and you can't refine, but you can't expect it to be anywhere near to as powerful.
1W: A weekly wick, or another high timeframe wick, can often translate into
other timeframes with bodies.
The takeaway: this exercise demonstrates the consistency of HTF order blocks across timeframes most don't focus on (weeks 1-12), each chart showing the powerful reaction of price at naked order blocks. We're reminded of the power of HTF setups, that there are many timeframes that exist, and that while HOBs matter, OBs matter too. Temporality is also respected — all TFs are relevant and make sense between each other.
The PEPE Discussion — An OB Is an OB
A reader proposes that wicks should be included for "wider areas" — not the case:
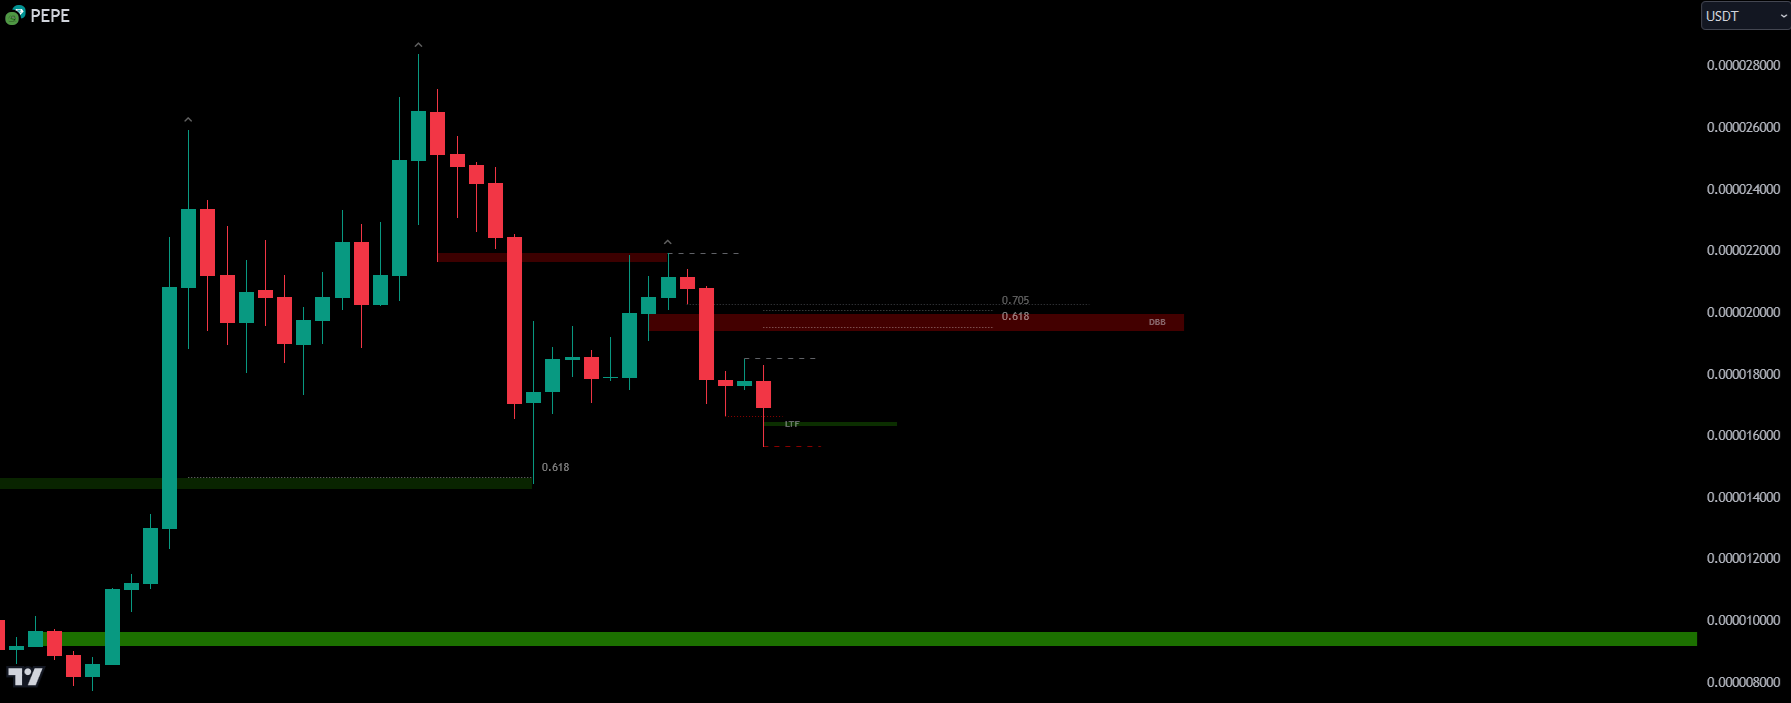
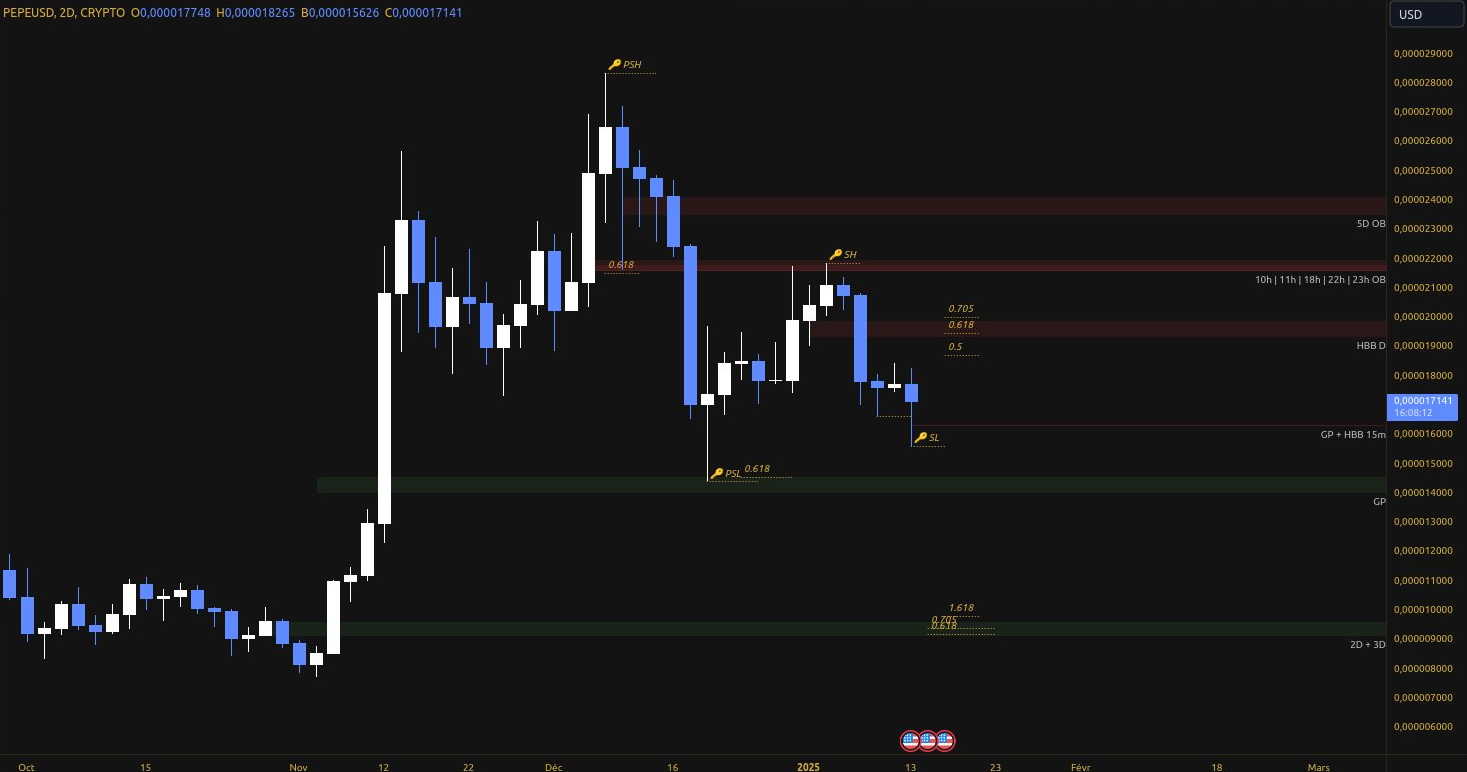
An OB is an OB regardless of whatever mental gymnastics you do to make findings seem "optimized."
There aren't different concepts for explaining OBs unless you're going YouTube style. An OB is an OB — body of candle. If you want to widen the area into wicks, you can — but a wick isn't an OB. You can widen levels to include a whole demand or supply area, but the OB is still what it is. Ultra-refining levels where applicable gives a higher R:R and tighter levels.
Putting It All Together
If there are no significant imbalances, there will be OBs and supply/demand fresh levels. If there are no OBs and supply/demand fresh levels, there will be significant imbalances. If there's none at all, price will move into a "fresh" level and build a new trading Ranges.
MS matters. The higher the timeframe, the more powerful. The more you can refine, the more powerful.
Look for short setups in PREMIUM zones and long setups in DISCOUNT zones. See DISCOUNT & PREMIUM ZONES. This is critical for invalidating setups.
When studying dozens of charts, Limit Orders aren't always realistic — set alerts as far as 15% from the level. See 👑Timeframe Rules.
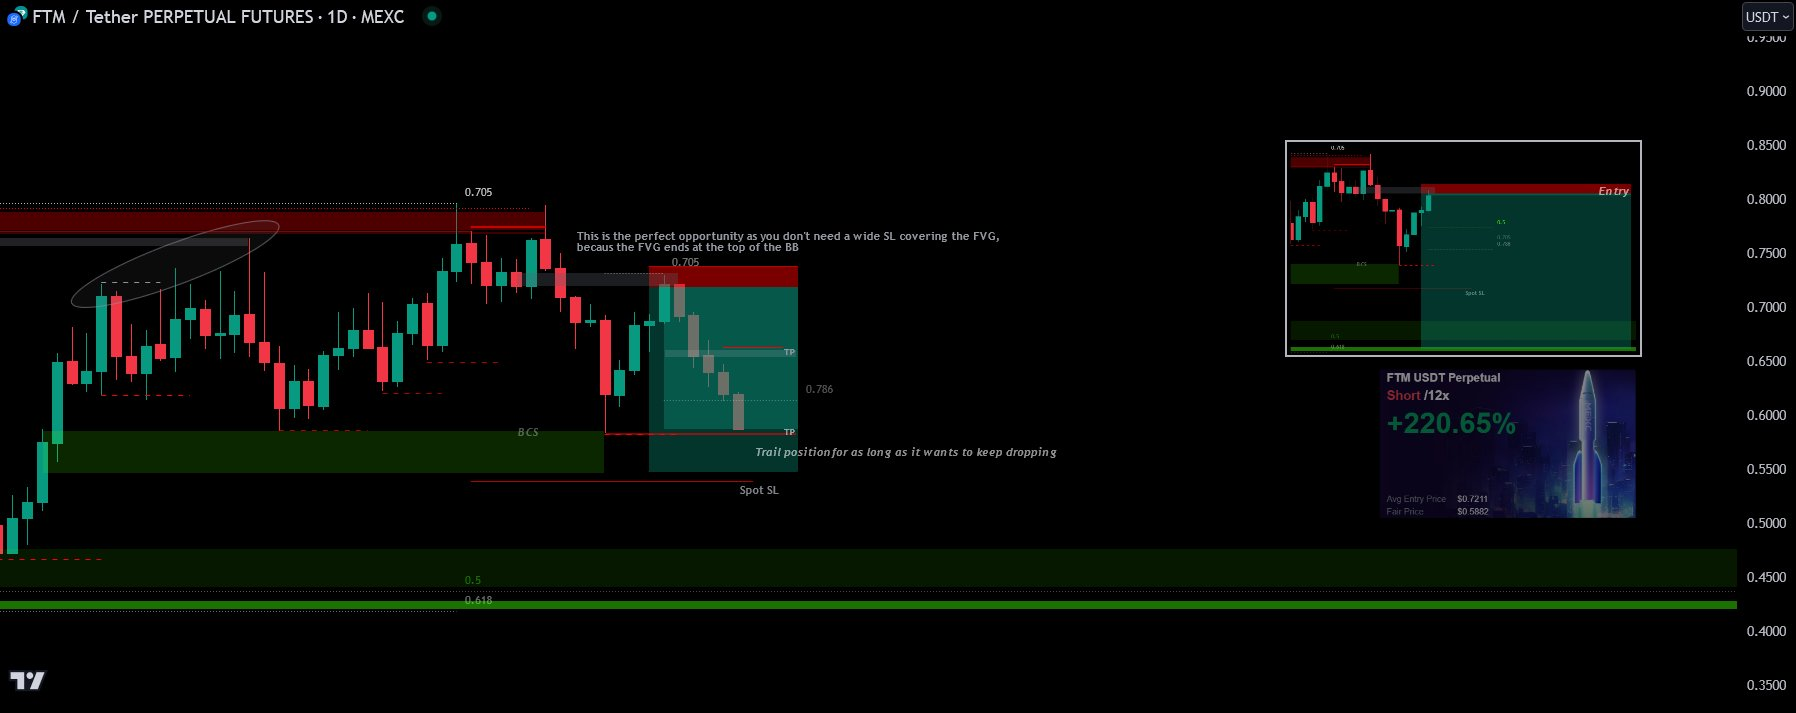
For SL placement: if the BB is at the end of the FVG, it's perfect for high R:R. If the BB isn't at the end of the FVG, sometimes cover the whole FVG with the SL, sometimes not — depends on how PA looks. See 🔷Stop Loss and Stop Loss Hoodstock.
A weekly OB level is more powerful than a 5D level. If you find a key level on Weekly, also a key level on 5D, 3D, 2D, 8H — that's a strong level. If you find a key level on a single timeframe, you can't expect it to be anywhere near as powerful. 🔷Position Size accordingly. See Optimal Plays.
You don't have a big enough 📝Journal nor large enough data on your mind early on. You need to Play the Game🎮 for several months to years and accumulate data. Only then can you find the patterns and optimize your game.
"Sell side liquidity" is bullshit when used to fearmonger about wicks below your OB. Unlearn and relearn. No, not worried about wicks taking out so-called "sell side liquidity."
TIME FRAMES matter. On BTC, even LTFs matter.
The Battlefield View
Sometimes it's helpful to understand the why of something. If you want to move from trading order blocks as a blind signal to trading the market behind the order block, this matters.
An order block represents a place where a large volume of orders were transacted and some of those orders were left unfilled. Any time an order takes place, there are always two parties: a buyer and a seller. Price action is essentially the footprint of the battle between these two groups. The order block is the battlefield.
In an order block, the party opposite the trend steps in aggressively. Price is trending down, buyers step in and start to push price up. If they're successful, price reverses and the second candle goes up. If they fail, the second candle moves down.
The more aggressive the move (the body of the second candle), the more that tells us price was displaced — there were not enough opposing orders to absorb, and the winning party tolerated slippage because they believed in their level.
If the first block of an OB is the coil, the second is the coil unwinding. It tells us who won this specific battle. The first candle is smaller because it's where the battle is fought — orders are being transacted aggressively on both sides, and the body remains tight. The second candle shows the winner.
This is the essence of an order block: a place where a volume of activity happened, and we expect a lot of activity to happen there again when price returns. An order block is not a sign of price going up or down. It's a place where a battle for direction will occur. An order block is not a signal to take a trade — it's a location where a trade can happen.
When price comes back to the level, three things can happen:
- Price bounces and the level is defended. A bullish OB lifts price, when price falls back down, the level holds and price bounces. Buyers win, sellers lose.
- Price falls through and an FVG is printed, hiding the OB. Sellers won by either overwhelming buyers or buyers simply didn't show up. Liquidity in the OB is preserved as there was no fight.
- Price hits the level, consolidates as buyers and sellers battle, fight ensues, and price reverses or falls. The liquidity from the OB is drained.
Now price is below the level of the initial bullish OB. When price comes back up, what can happen? Same: buyers and sellers will fight, or not fight, and price will reverse, consolidate, or print a new FVG.
This is why we trade OBs: they are places where SOMETHING will happen. But we don't always know what — that's why learning to spot levels is only the beginning. You have to read the battlefield to make an educated guess about who will win.
Fib confluence is not confluence for who wins the battle — it's confluence for the level being a valid battlefield.
Once the battlefield is identified, what now? Look at the majors. Who is winning on USDT.D and TOTAL? Is there a battle taking place over on the majors at the same time as your entry on an asset? If so, you have more information available to determine who's winning the bigger battle. This is why we look for entries at levels where levels also hit on majors.
Some traders use order flow, heat maps, etc., to determine winners.
Pay attention to the information environment: what propaganda is being pushed when price hits a battlefield? He who controls the memes controls the world.
Whales need a counterparty. To sell holdings at a battlefield, they need to bring in significant counterparties — people who passionately believe they can win. Breakout chasers who see a pump, moonboys who buy every dip, trapped traders who simply want to get out at break even, forced liquidations. These are the sheep that propaganda brings to the battlefield for slaughter.
If the news is bullish, sellers are probably trying to get buyers to the battlefield so they can dump. If the news is bearish, they need sellers to come dump so they can vacuum up.
When you enter a trade at an order block or hidden order block, you are stepping onto the field, whether you realize it or not. Finding the battlefield is the first step. Your job now is to make sure you're playing on the side of the winning team.