Supply and Demand: The Institutional Footprint
Supply and demand trading is the discipline of finding where the big players have already bought or sold, marking those areas on the chart, and stepping in beside them when price returns. It's not retail noise. It's institutional footprint.
This lesson lays out what those zones actually represent, why they exist, how to draw them, and how to qualify them so you're not just sketching rectangles around random highs and lows.
What Supply and Demand Actually Are
The Supply & Demand (S&D) trading style combines key elements of Support & Resistance with the concept of Supply & Demand into one strategy. By integrating these principles, you can identify the areas where financial institutions are buying and selling, and capitalize on significant reversals before they materialize.
The changes in Supply and Demand are readily observable as rises, declines, and consolidations on charts:
- Increases in price indicate that Demand exceeds Supply.
- Decreases in price indicate that Supply surpasses Demand.
- When Supply and Demand are roughly equal, a consolidation pattern emerges — a range. Ranges
Various factors such as news events, economic announcements, and market trends trigger distinct groups of traders to engage in buying and selling, adding to fluctuations in the equation. Significant shifts in Supply and Demand are typically driven by the actions of large financial institutions and major traders, not retail trades. Retail traders simply do not possess sufficient buying or selling power to impact the price of Bitcoin.
It is essential to monitor the behavior of institutional investors and prominent traders to gauge the trajectory of Supply and Demand and make informed decisions accordingly. Only financial institutions with their substantial buying and selling power can influence price movements in the financial markets.
💎Supply & Demand Trading focuses on identifying areas where institutional players have previously bought or sold large positions. Enter trades when price revisits these zones to align with institutional movements rather than Retail🧠 traders, who often take losing positions.
Spot the areas where price moved sharply upward or downward, mark these as supply or demand zones using rectangles.
Discount and Premium → DISCOUNT & PREMIUM ZONES
Key takeaway:
- If there are no significant imbalances, there will be OBs and Supply/Demand fresh levels.
- If there are no OBs and Supply/Demand fresh levels, there will be significant imbalances.
- If there's none at all, price will ⚡️ into a "fresh" level and build a new trading range. (⚡️ Move / Ranges)
If PA goes above and beyond supply zones into price discovery, rely on negative Fibonacci levels and trail positions under HTF/MTF ♨️Key Levels🗝️. → NEGATIVE FIBONNACCI RETRACEMENT
Why Institutions Split Their Orders
In Forex, for instance, institutions are many times unable to execute their complete position in a single trade due to its sheer size. Instead, they break it down into smaller chunks and execute each trade individually at similar prices to avoid generating significant price movements that may negatively impact their entry price. This method of breaking down large orders enables banks to remain discreet and minimize their market impact, allowing them to acquire or offload large positions with minimal disruption.
There's a downside to this approach for banks. Due to the massive size of their positions, there may not be enough counterparties available to execute trades when they need to buy or sell, even when they split positions into smaller chunks. This lack of liquidity can be problematic for whales — they require counterparties to fill their positions. If they cannot find sufficient liquidity, they may need to adjust their trading strategies or accept less favorable prices.
Solution: they must let price move away and then make it return later on to get the rest of their position entered.
This isn't "luck" or lagging indicators or MA's or anything retail uses the most. This requires understanding the big players' game and the ability to read price action.

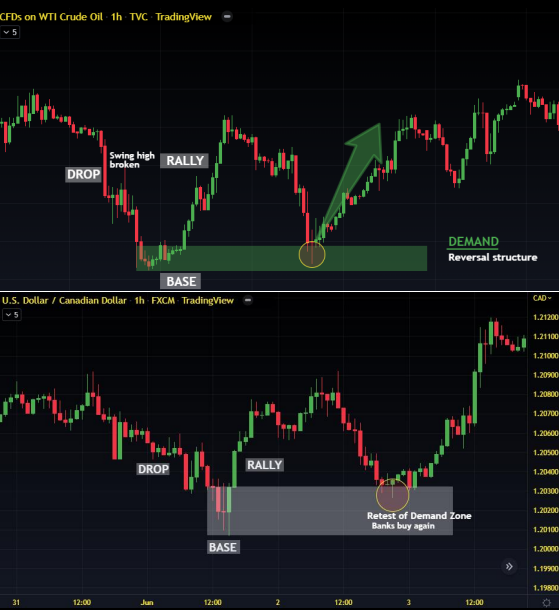
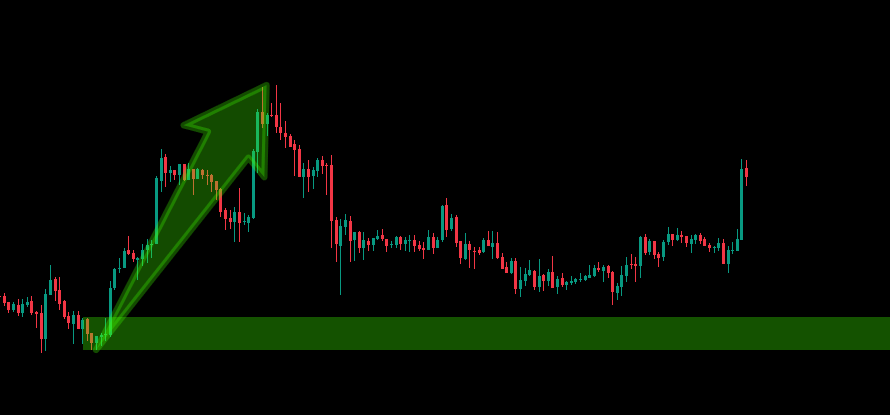
S&D trading is all about finding points where the big players have bought or sold, then jumping into trades when price returns to pick up the rest of their position — getting into the reversal right beside the banks instead of beside retail, which is a loser. The idea is to find points in the market where price has made a strong advance or decline, and mark these areas as Supply and Demand zones using rectangles, ellipses, or whatever you want to use to mark the zone.
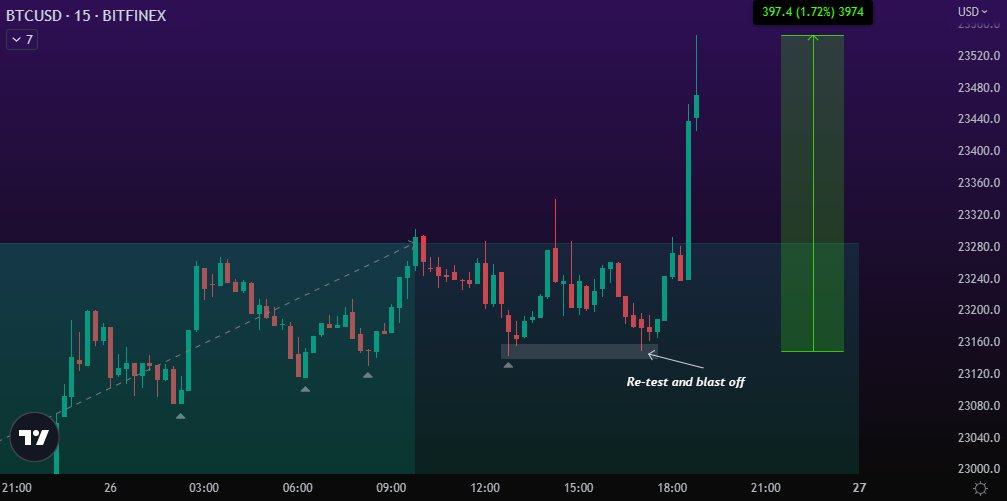
Another instance below on BTC's 15min chart (LTF). This isn't a retail injection of capital.
Demand Zones
Demand zones signify areas where banks have established a significant number of buy positions, and therefore represent a crucial level of support in S&D trading. These zones typically correspond to levels where prices have rebounded or reversed upward in the past, as large financial institutions and traders are more likely to engage in buying activity at these levels.
A demand zone is where the whales deem the asset cheap (discount) — a place where they want to buy at a valuable price. They will often purchase and accumulate the assets at these demand zones, so we see multiple strong reactions back to the upside.
A "double action" creates upward momentum from demand zones, which explains why we get explosive movements when this zone is reached:
- Whales deciding to open new long positions
- Whales deciding to close their short positions
Follow these movements to ride the momentum, buy at the lows at the right time, and achieve big gains by selling into supply zones.
Supply Zones
A sharp decline in the market is typically identified as a Supply zone. These zones represent areas where banks and other large traders have established significant sell positions, leading to an excess of supply relative to demand. When prices approach a Supply zone, traders often anticipate a potential price reversal and look for opportunities to sell. This makes Supply zones crucial levels of resistance.
A supply zone is where the whales deem the asset expensive (premium) — a place where they want to sell at a valuable price. They will often offload and distribute their assets at these supply zones, so we see multiple strong reactions back to the downside.
The same "double action" applies in reverse:
- Whales deciding to open new short positions
- Whales deciding to close their long positions
This is the violent drop you see — whales selling, their footprint. It's too strong to be retail.
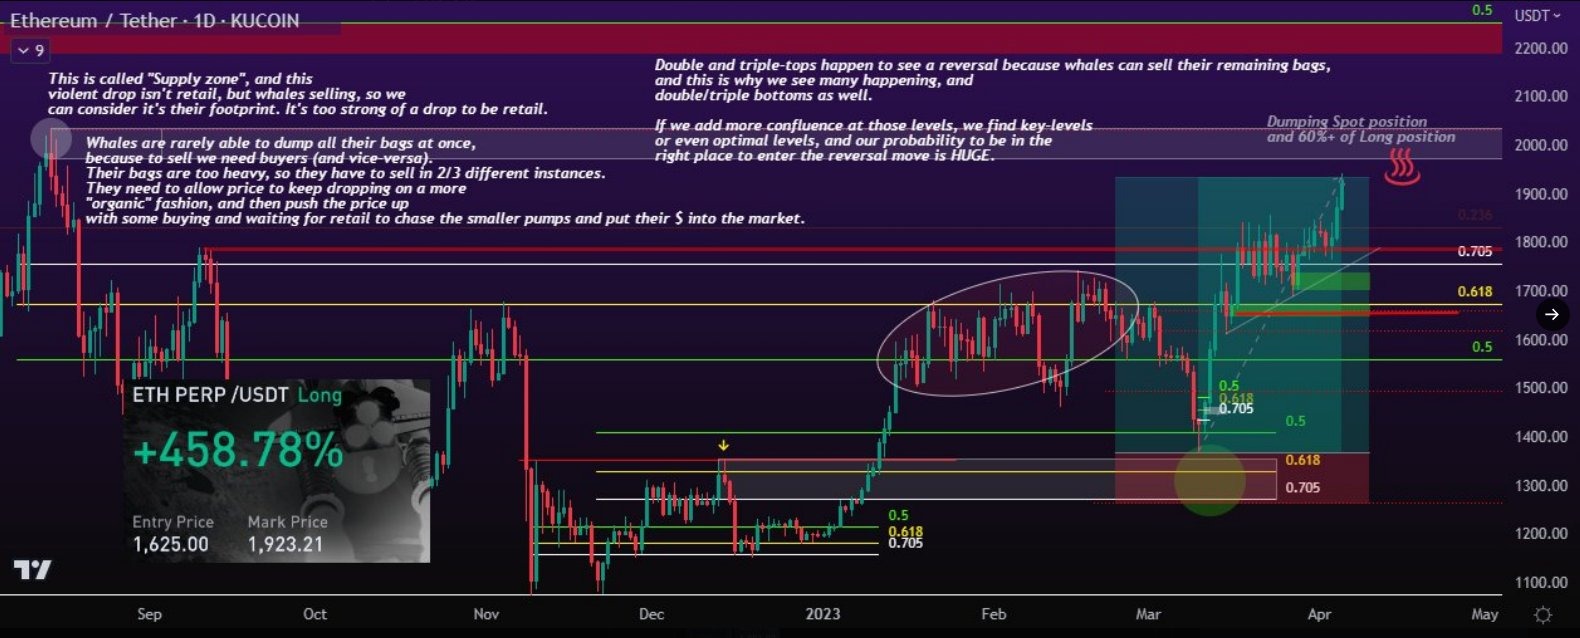
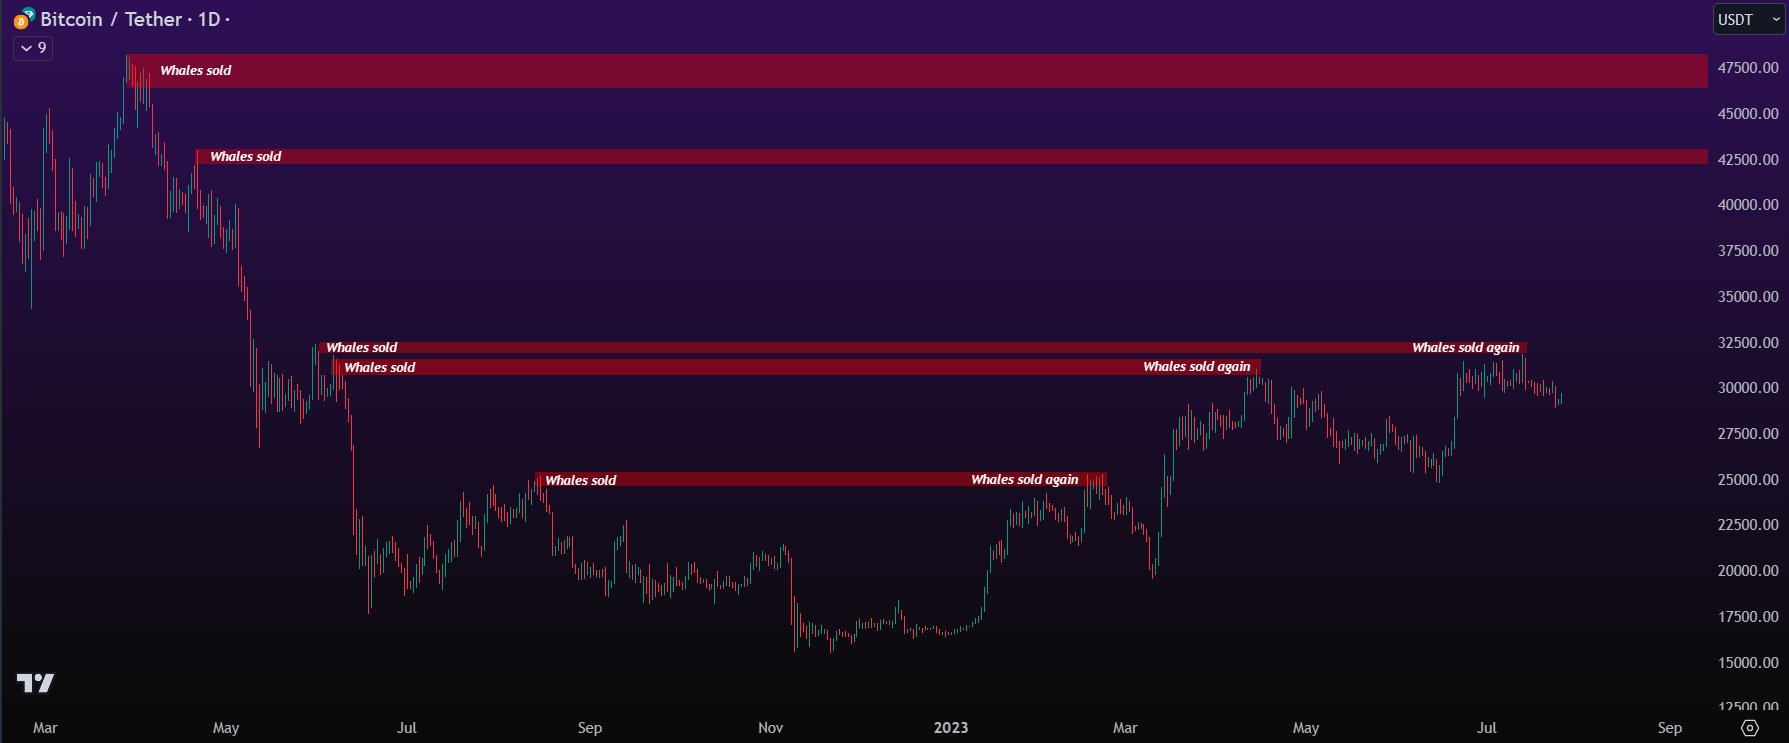
Whales are rarely able to dump all their bags at once, because to sell we need buyers (and vice-versa). Their bags are too heavy, so they have to sell in 2/3 different instances. They need to allow price to keep dropping on a more "organic" fashion, then push price up with some buying and wait for retail to chase the smaller pumps and put their money into the market. Double and triple-tops happen for this reason — whales selling remaining bags. Same logic explains double/triple bottoms. Selling Tops / Buying Bottoms
What Distinguishes S&D From Support and Resistance
Supply and demand is the market psychology and driving market force behind what creates support and resistance levels. By identifying levels where institutions are buying and selling, you can capitalize on significant reversals before they happen.
This is why we treat support and resistance as general areas and not solid lines or solid numbers — because of the supply and demand concept that anchors them.
There's a general belief that every time a resistance or support is tested, the more it gets tested the stronger it becomes. This statement is false.
Each support and resistance should be more properly considered as demand and supply zones respectively, where buy or sell orders are being placed. Every time the price of an asset tests multiple times a demand or a supply zone, that area doesn't become stronger but instead weaker. This happens because the dominant part of the market is in control (buyers/sellers) and has the strength to continue pushing price toward a specific zone, absorbing the counterpart's orders.
It's like a war between two factions, where each attack kills a bunch of soldiers. How do you imagine the status of the faction constantly attacked? Of course not in shape — and this causes the loss of the war.
How to Draw Zones: The Origin Point
S&D zones go hand in hand with Premium, Discount & Equilibrium ones and Dominance & Momentum concepts. Supply and demand zones, contrary to support and resistance levels, are areas (not finite numbers) on a price chart where the balance between buyers and sellers may shift, due to the presence of a lot of pending orders.
How do you find them? The idea is somewhat subjective — traders use different S&D areas depending on operativity (short/long term). To make it simple, use the concept of Auction Market Theory (Imbalances, Fair Value, Volume Profiles) — analyzing the balancement or imbalancement of the market.
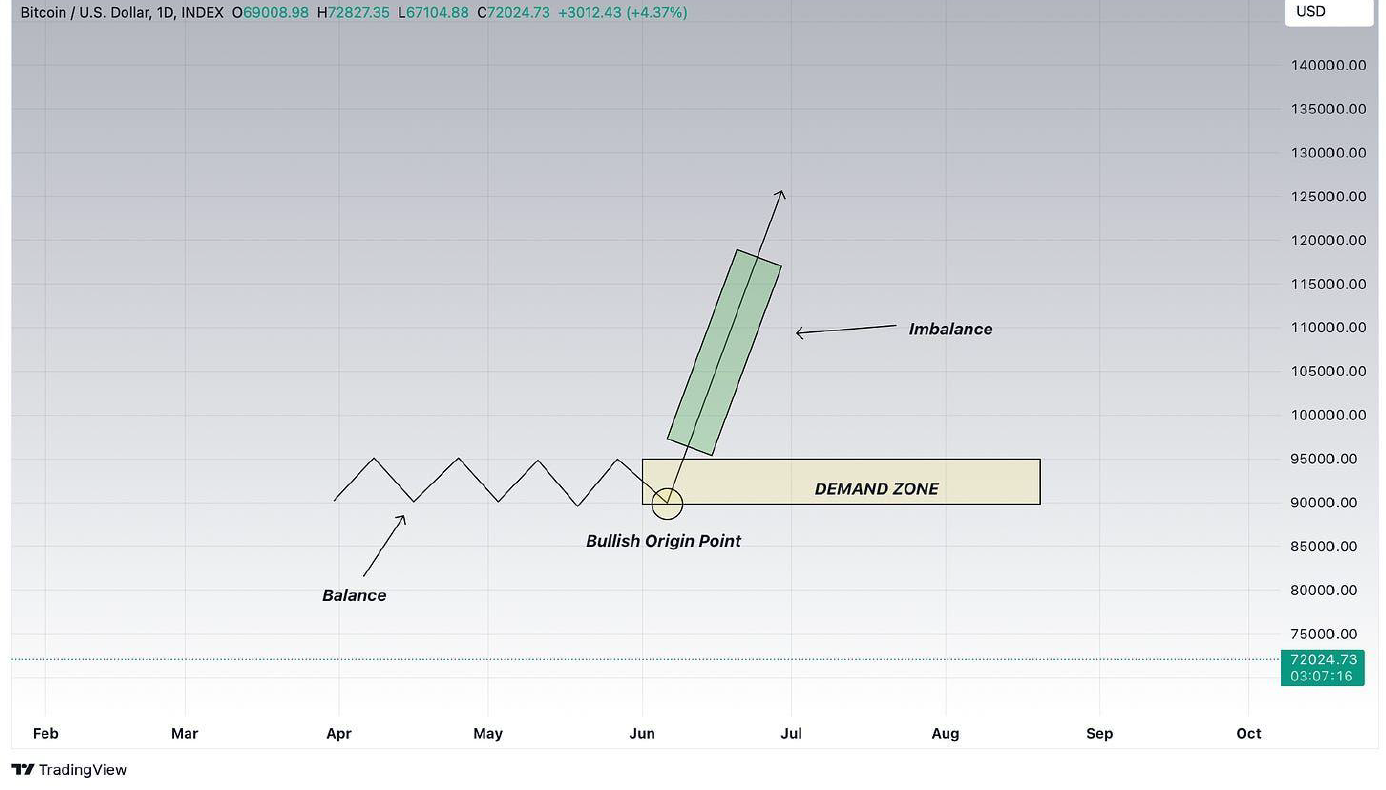
When the market is balanced or in consolidation, at some point an impulse is being created by buyers or sellers. The point from which the impulse starts is called the "origin point" and becomes the key reference for a potential demand zone.
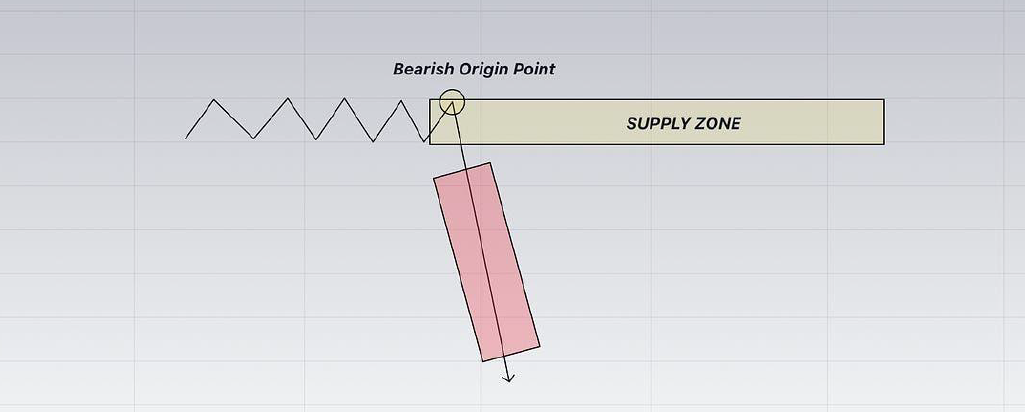
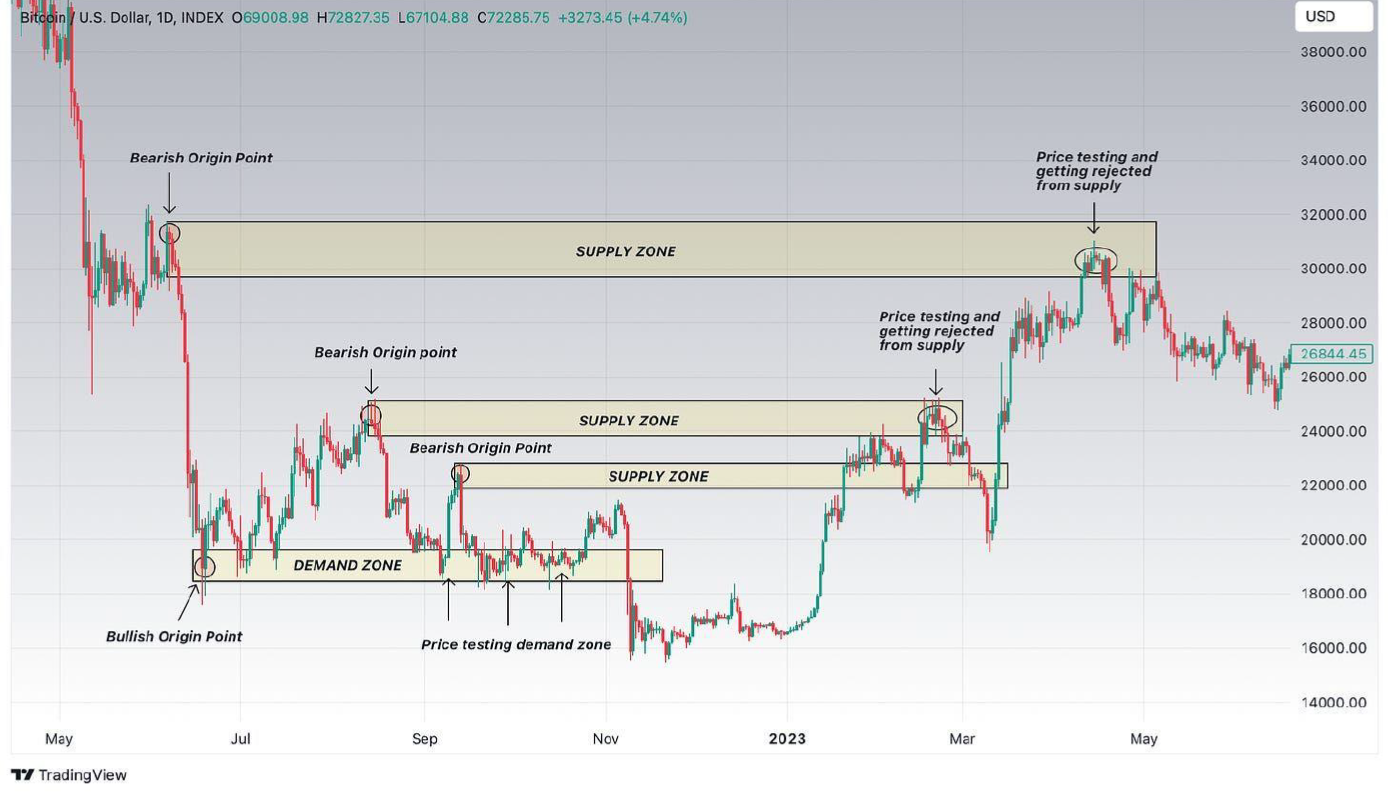
For the same reason, a potential supply zone starts from the bearish origin point — where the market was previously balanced before the drop.
A practical example on the daily chart of Bitcoin:
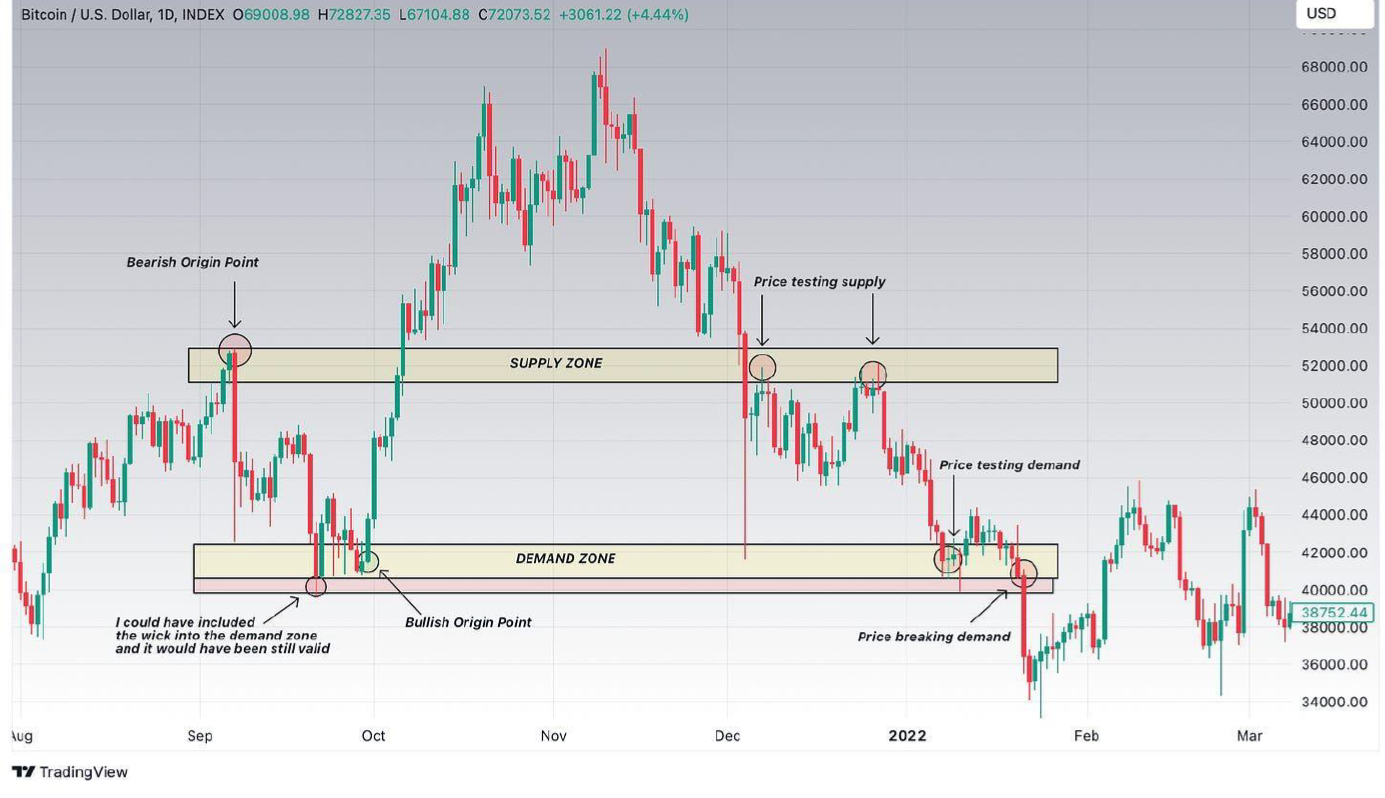
The supply zone is identified from the start of the first bearish origin point at 53K (strong signal given the nasty connotation of the red candle). Over time price tested that supply zone and got rejected from it. The demand zone starts from the bullish origin point at 40/41K, validated by price testing that zone with a long red wick and later with the body of the candles.
Two key things to remember:
- You could include the wicks of the candles in the demand zone and it would still be valid.
- The more a supply or demand zone is tested, the weaker it becomes as sell or buy orders get absorbed.
The example below shows price testing the demand zone multiple times — notice the wicks that grab liquidity, absorbing buy orders. At some point, those tests "consumed" the buying pressure, leading price to melt the demand zone.
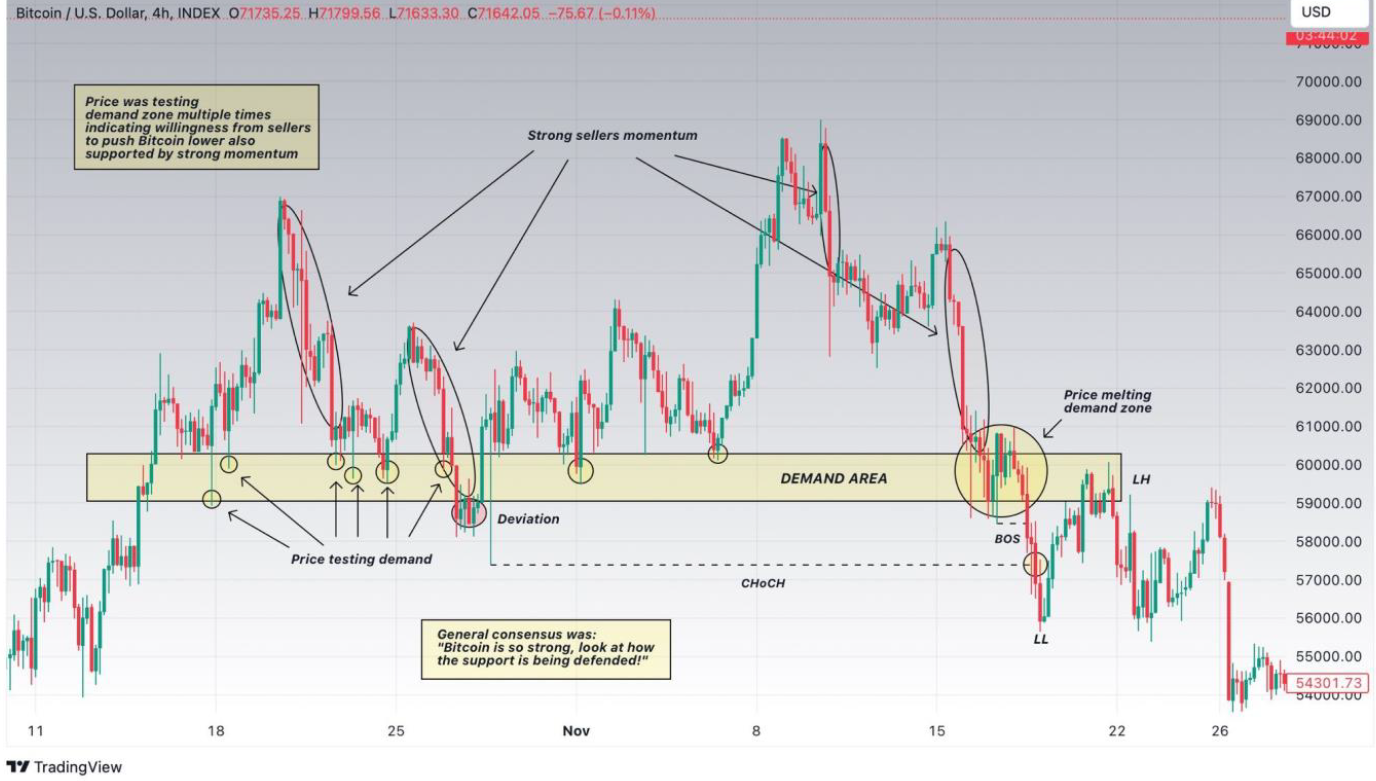
Another clear example of absorption — price testing demand multiple times over months, then breaking below it with a strong bearish impulse. The demand zone absorbed all the buy orders without being able to produce a strong uptrend.
How Drawing Zones Works in Practice
Demand and supply blocks aren't drawn linearly. Things have to make sense:
- A demand block runs from wicks at the bottom to the top of the order block body at range low (OB body high to wick low).
- The block can be refined further with methods like 👑Refine or Ultra-Refine Plays.
- There needs to be at least a full OB body in the demand block — or if not an OB, the lowest full candle body, including other relevant levels like the bottom wick below if they make sense.
- Sometimes the block is placed lower than the wicks (cushion). Pay attention to nearby fibs from untested swings if covering them with the supply zone.
- Sometimes not all the bottom wicks are included — refine if too long, to just the body. Wicks can have no liquidity.
- Drawn when seeing two bottoms at similar lows (range low forming).
- Often it's useful to include part of the top wicks of the OB if a few stop at similar highs — check if there are bodies in those wicks on lower timeframes.
- Most useful on 3D and 1D for HTF context.
A weird case — body half in:
Include the lowest two wicks. Things don't have to be linear but have to make sense.
BTC Example
Demand — clear demand zone areas where MMs have key interest in buying/longing:
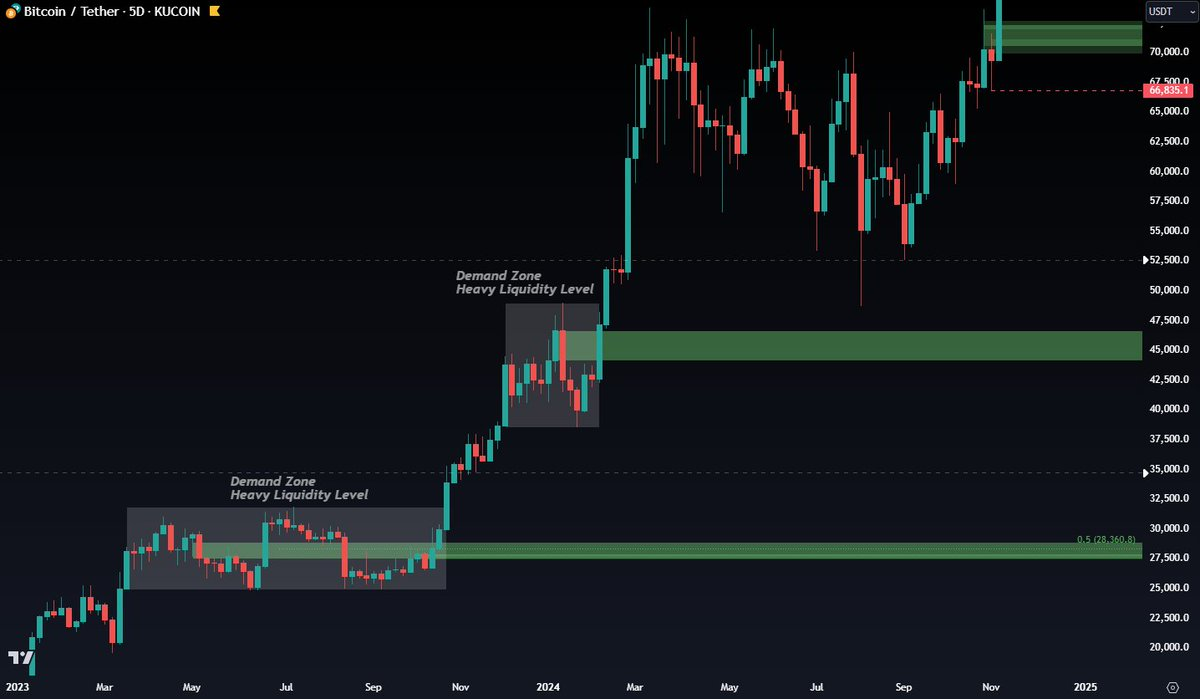
Supply — clear supply zone areas where MMs previously took profits or closed long positions:
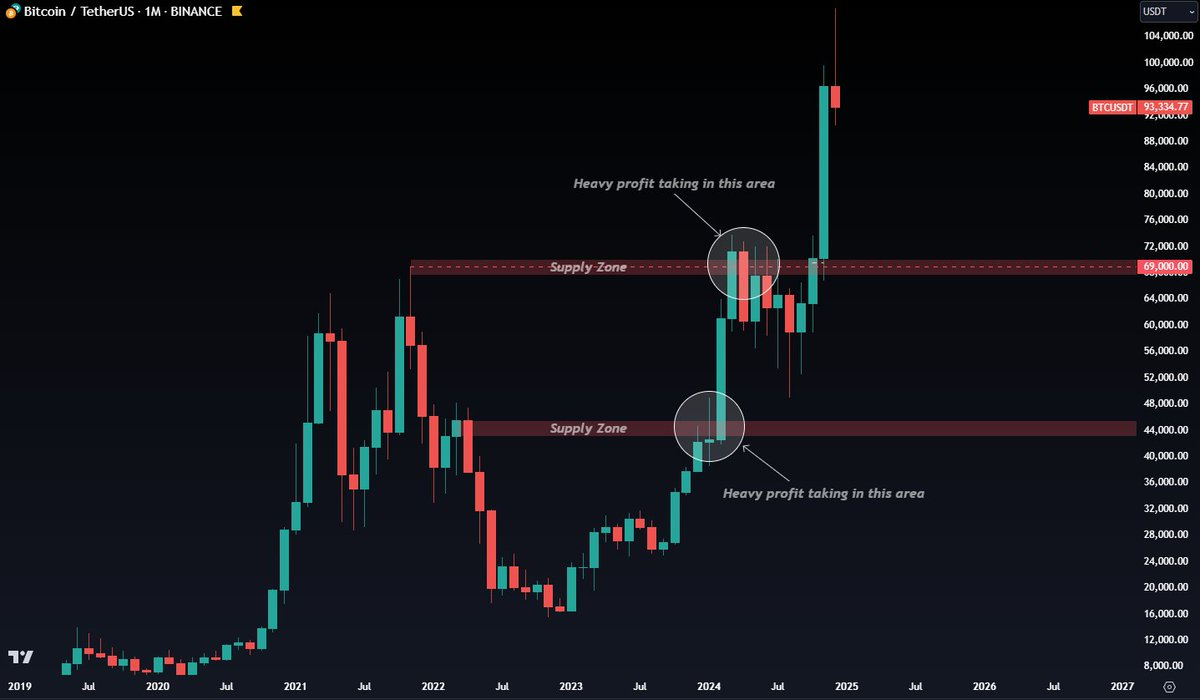
Look for HTF Order Blocks followed by engulfing candlesticks with sharp movements (Bullish OB followed by bearish engulfing candlesticks and vice-versa). HTF OBs represent higher volume — higher chance of reaction and reversal. HTF OBs can be hit multiple times before a true reversal as they contain lots of liquidity, but with each hit the level becomes weaker.
When supply zones are broken through, they can turn into key demand zones (resistance flips to support). When demand zones are broken through, they can turn into key supply zones (support flips to resistance).
Combine market structure with demand and supply zones for stronger confirmation. → MARKET STRUCTURE
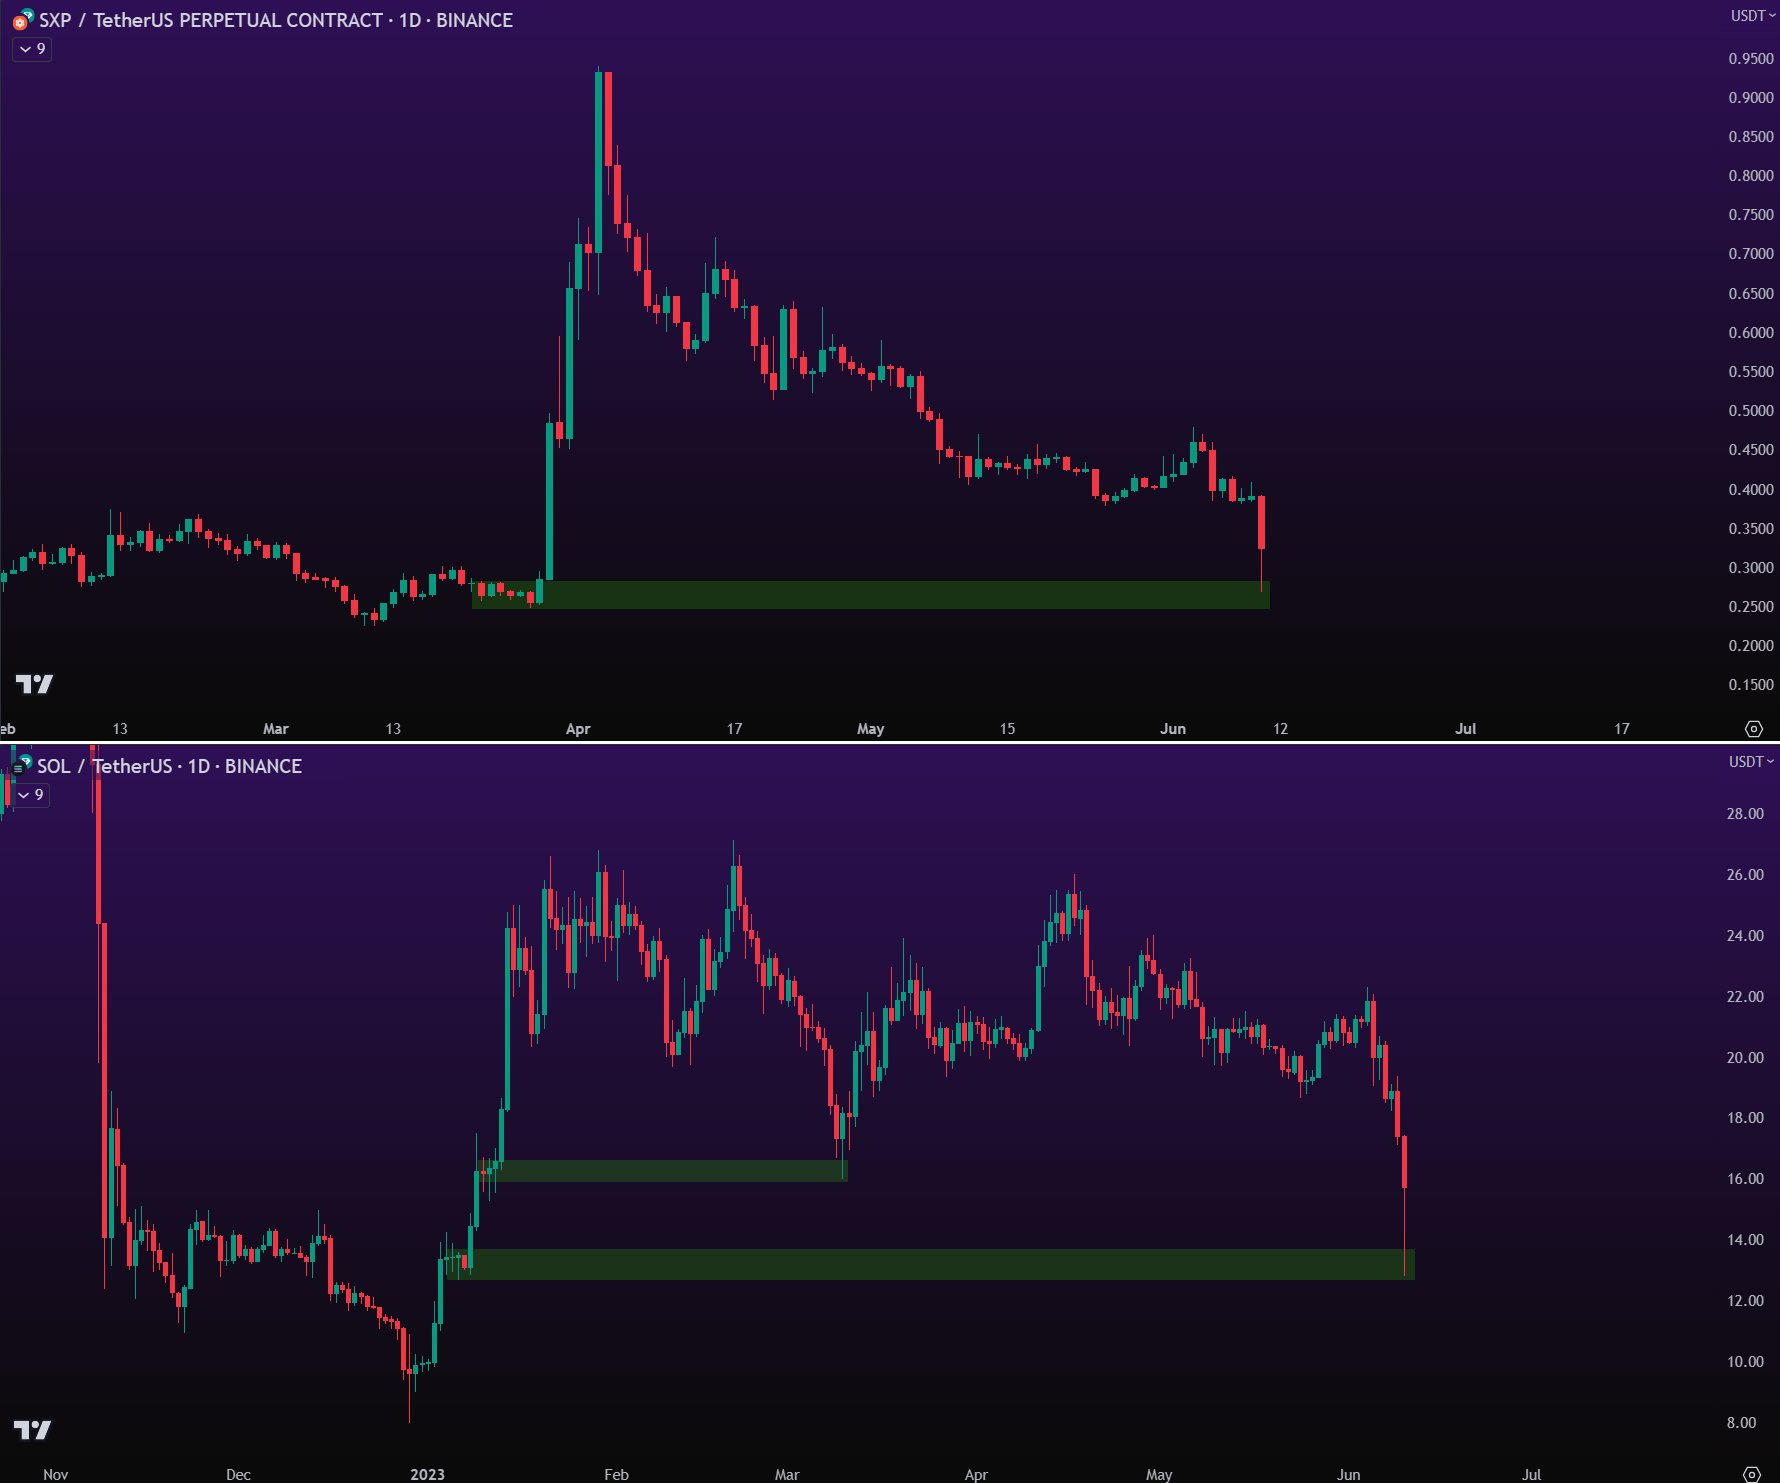
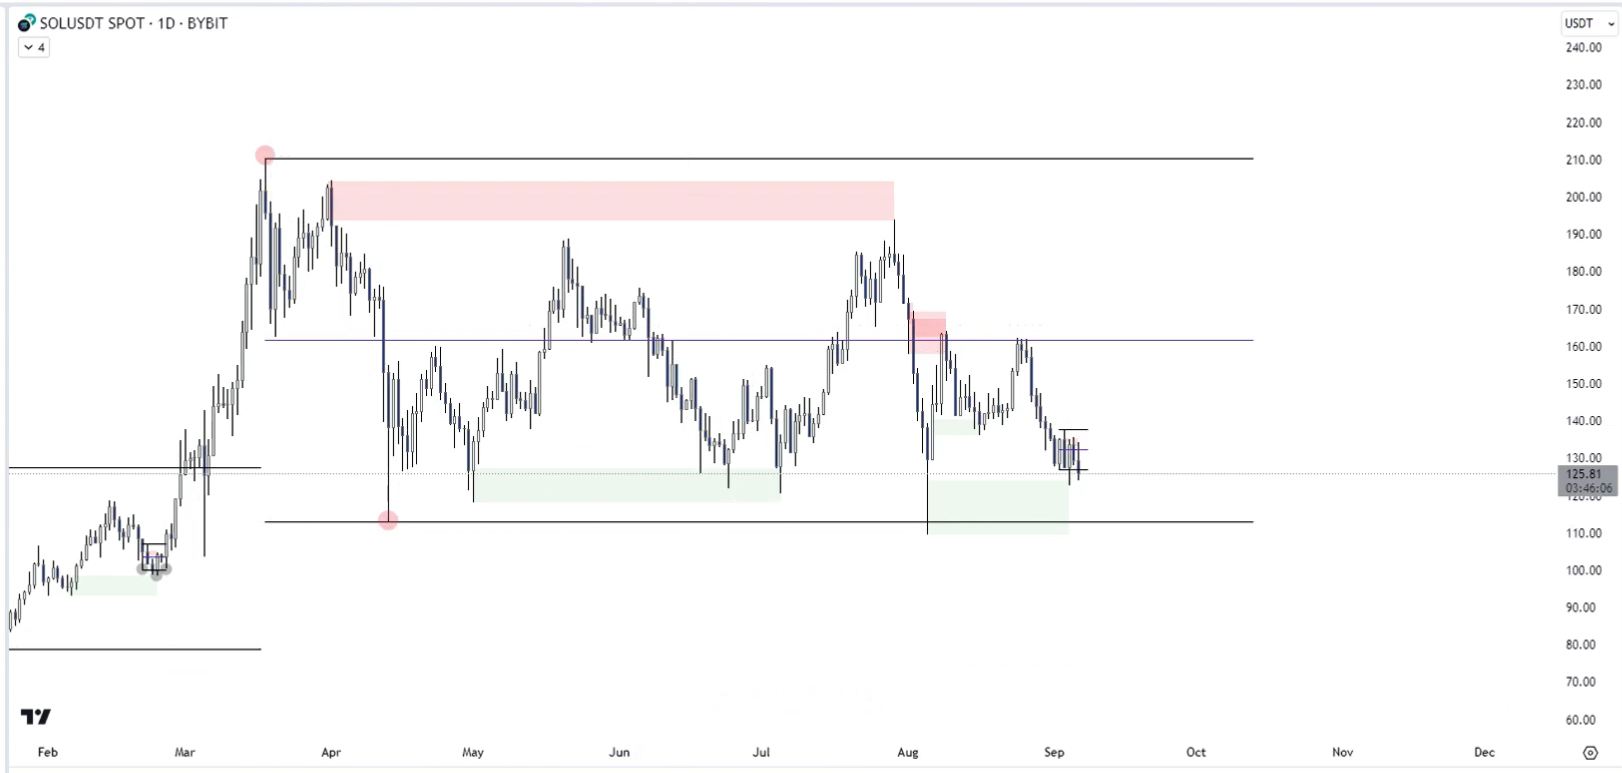
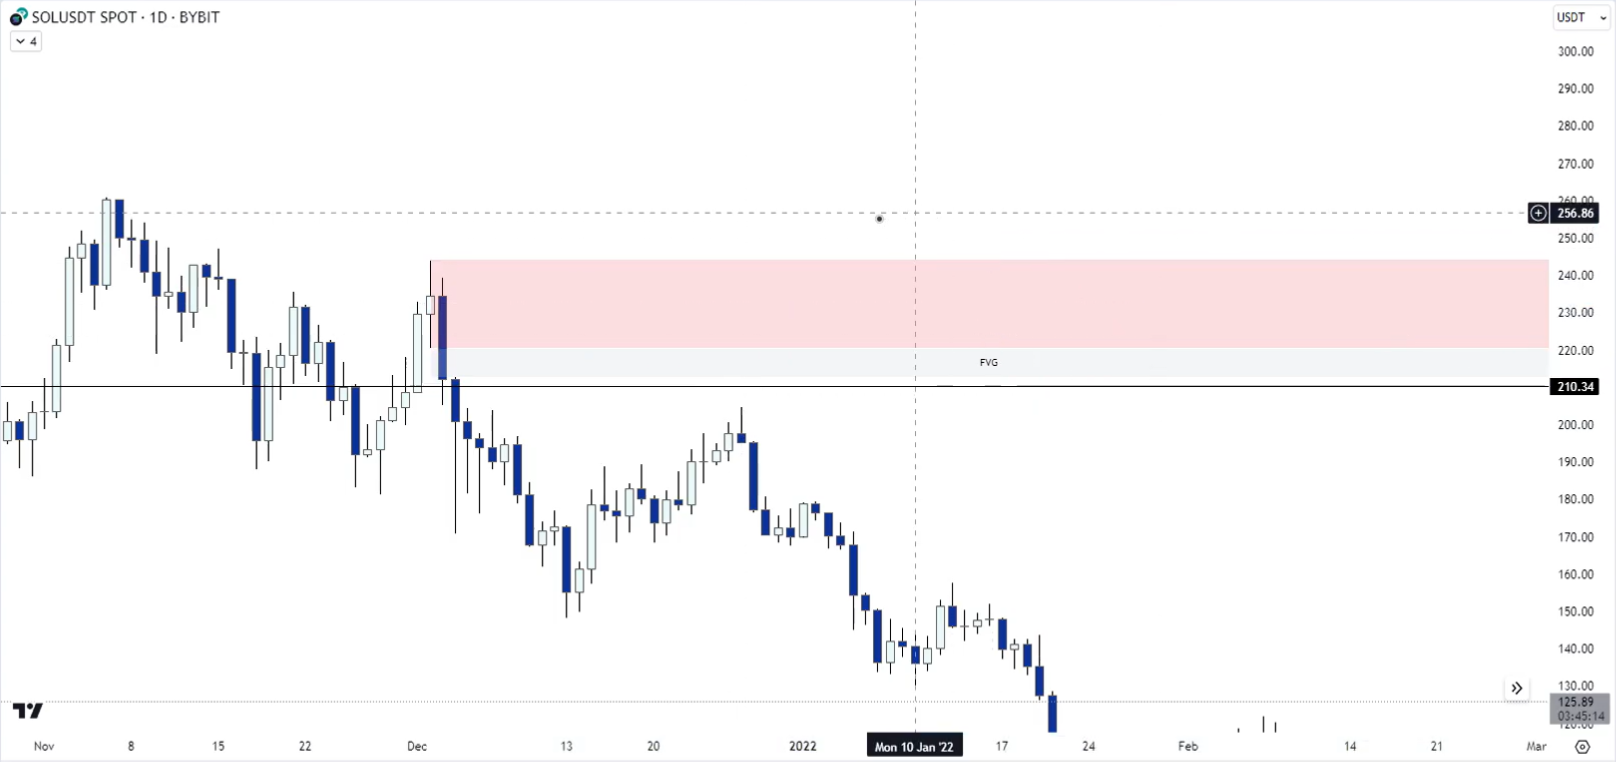
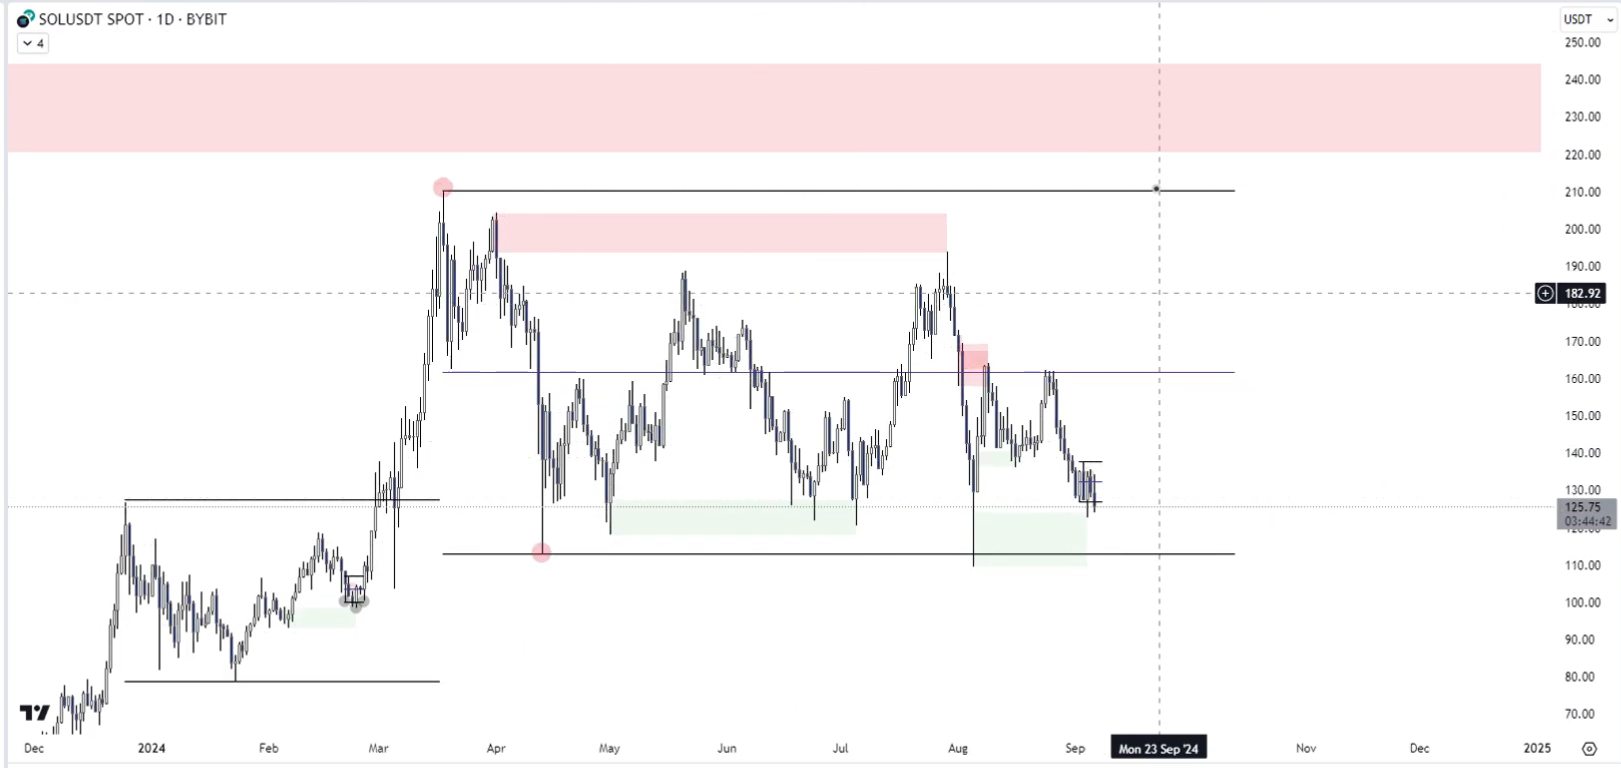
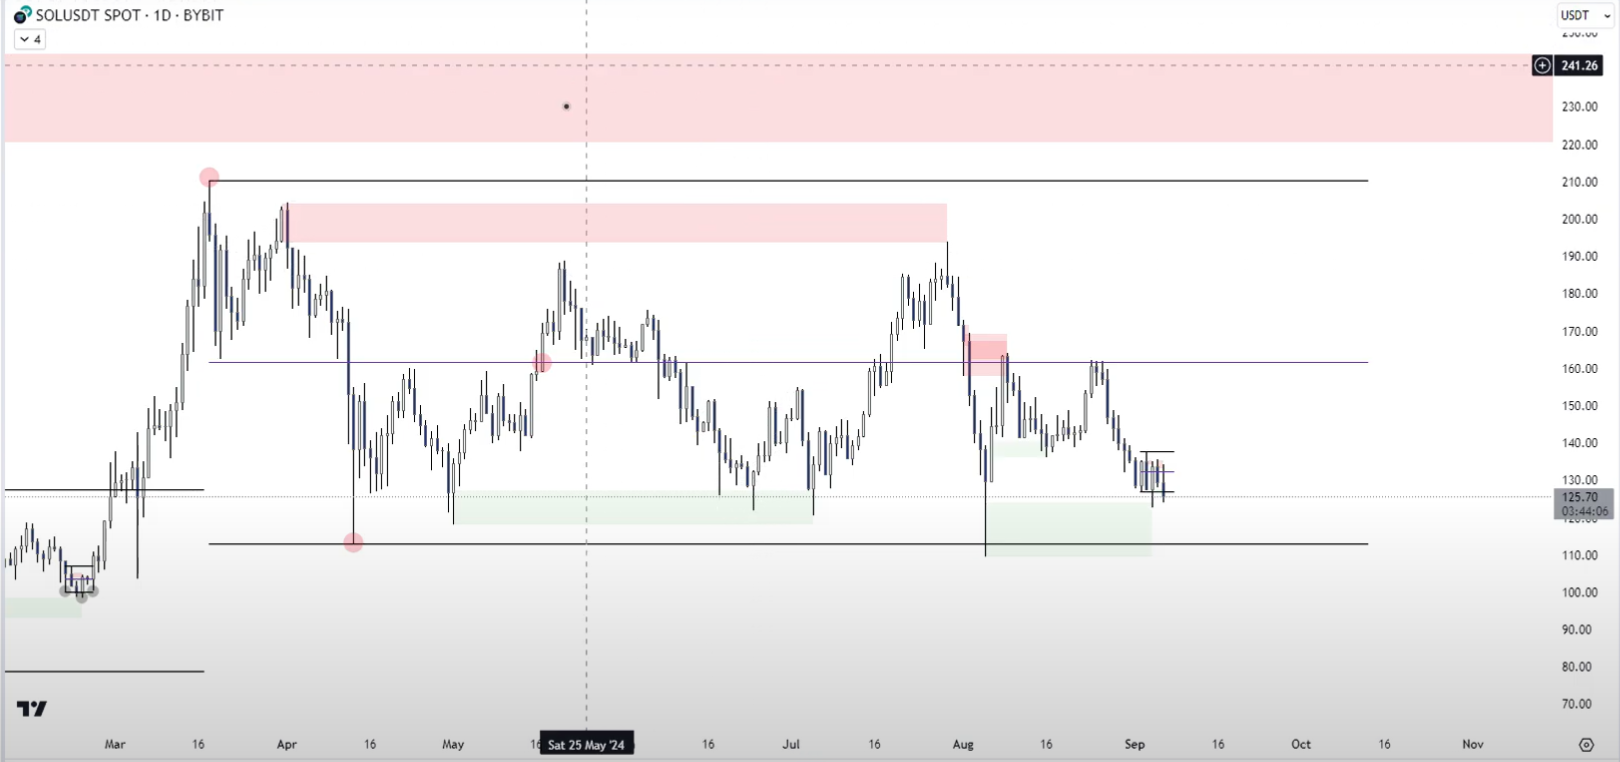
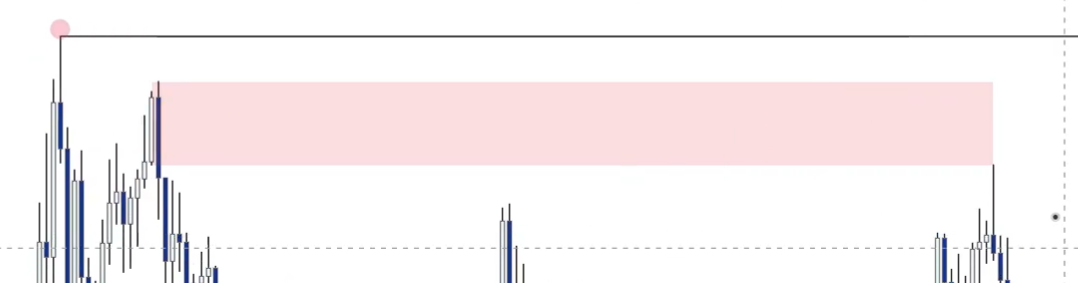
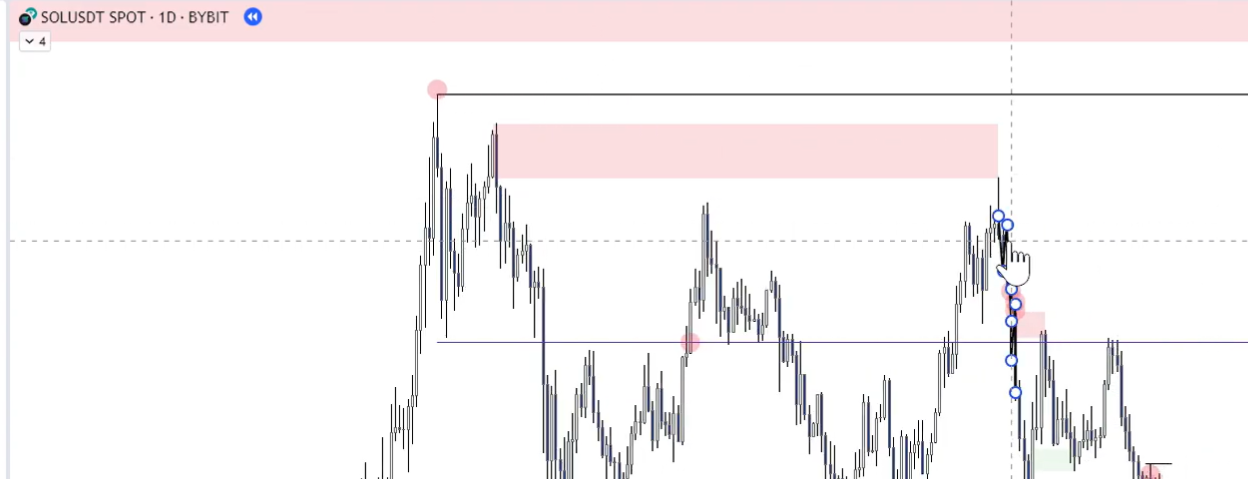
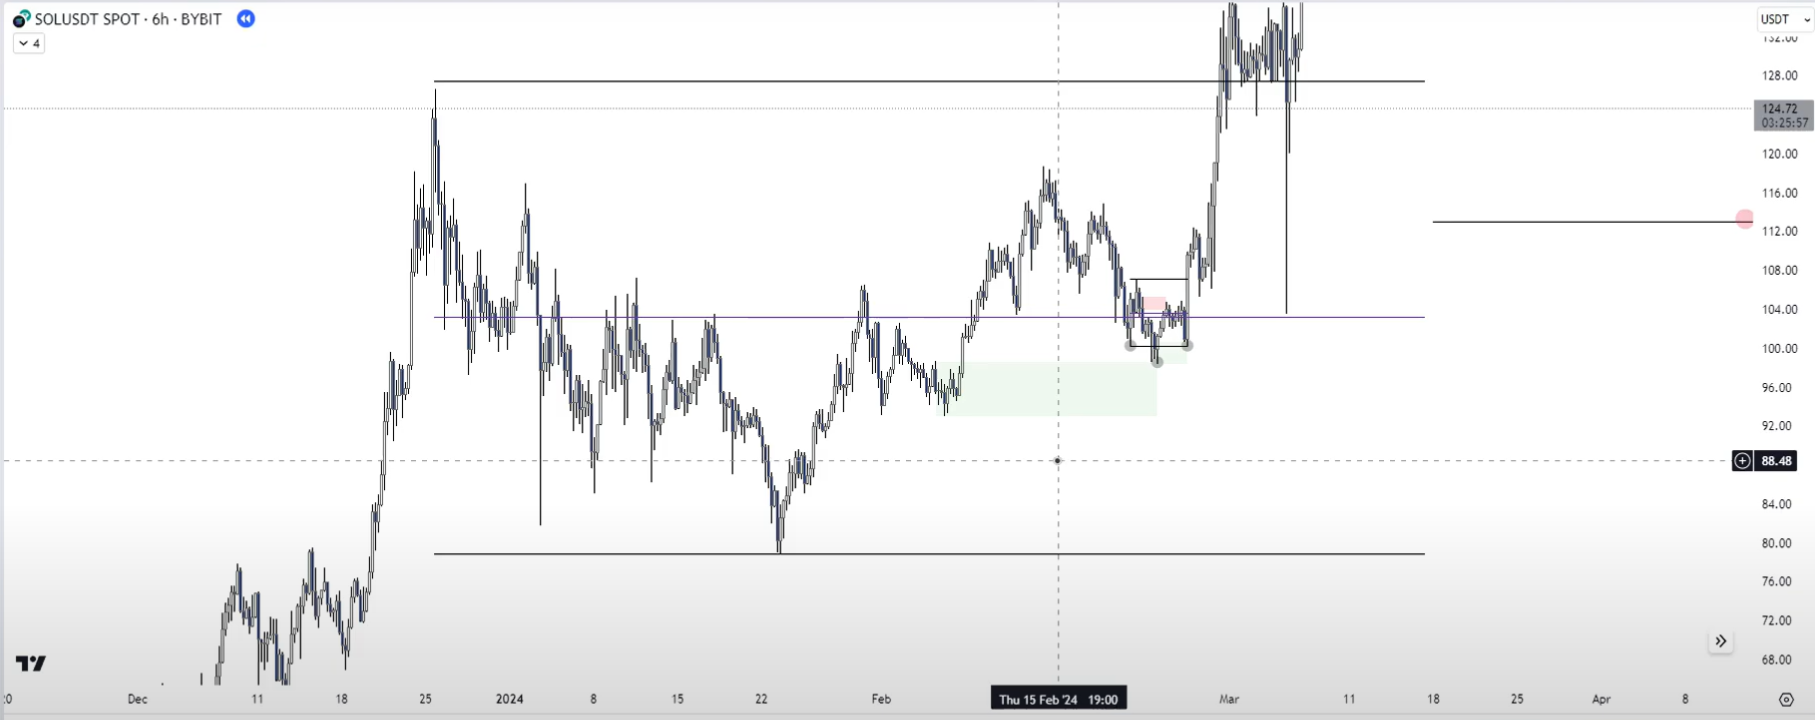
SOL Example
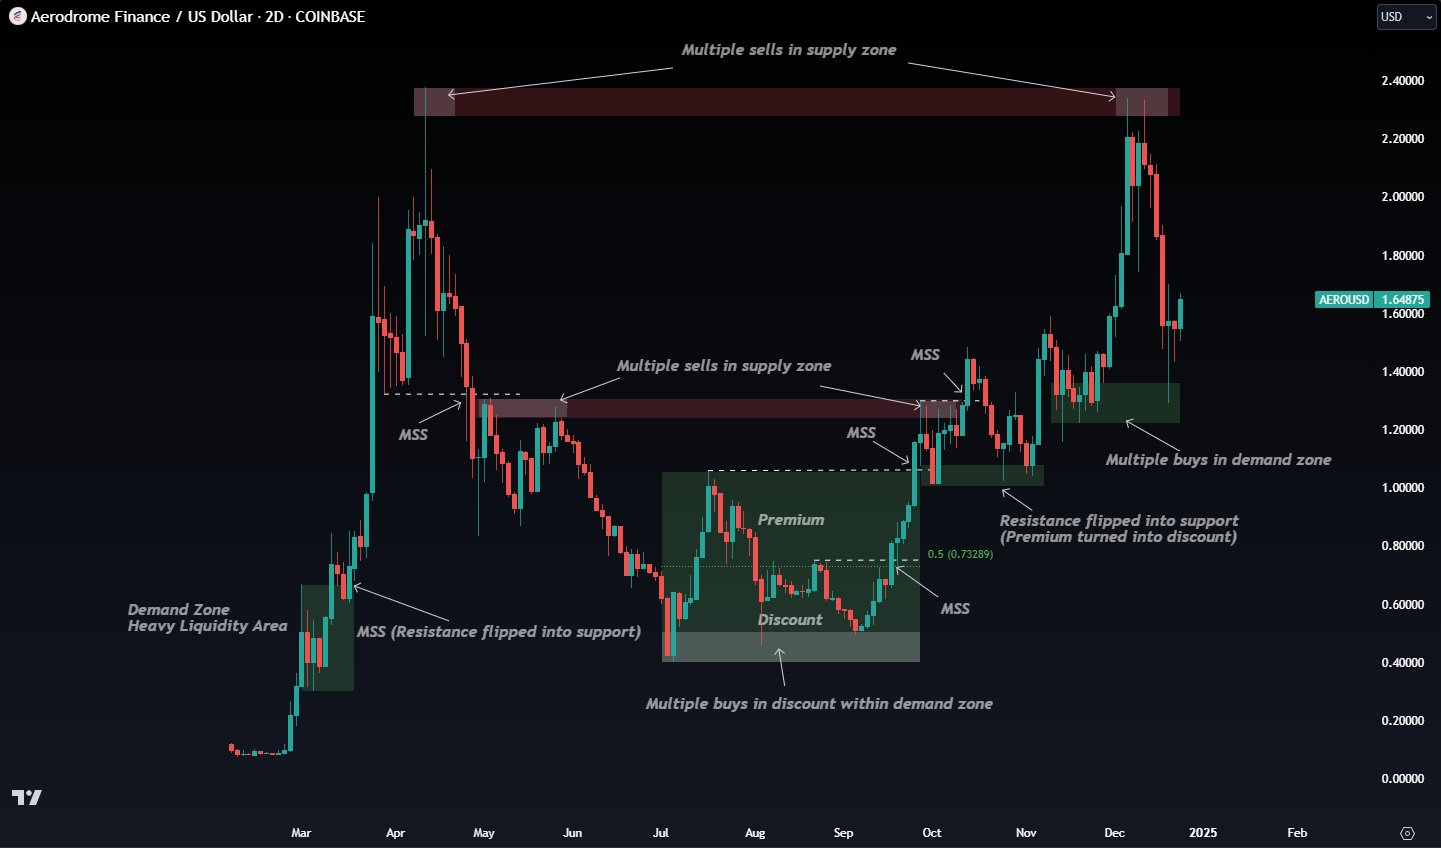
Monthly OBs and a SH acting as supply zones:
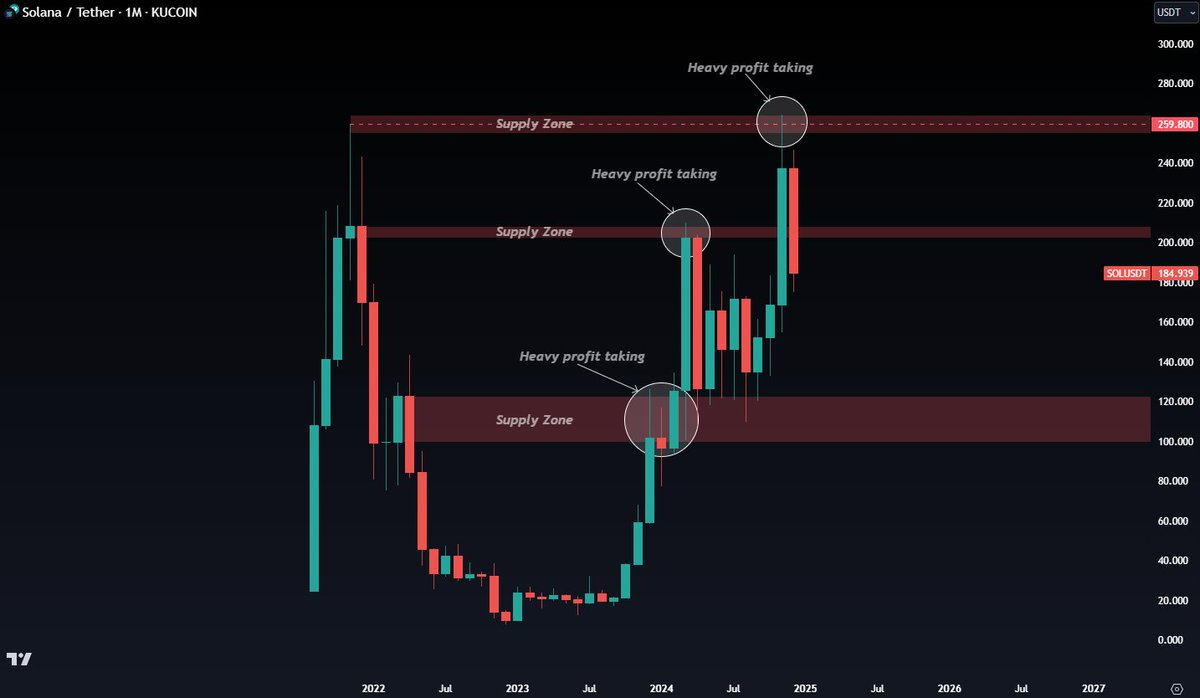
At the first supply zone, heavy profit-taking, then price broke through and turned into a key demand zone where MMs placed multiple buy orders at $120–$110 (resistance turning into support). Follow smart money and do the same.
Why HTF Zones Dominate
HTF game is where the big money is at, with the least false signals. Weekly and monthly supply/demand zones hold more weight and are higher quality. Higher quality means a higher percentage chance of price reacting and reversing off these zones — not just a slight bounce, but a true/big reversal that moves a greater distance.
Weekly/monthly zones are where the big guys take on or offload massive positions. Slow-moving institutions aren't going to do these massive movements off minor lower-timeframe levels. You don't sit there trading these levels day to day, but you should have these zones marked and labeled. When price approaches these key weekly and monthly zones, be ready — these are huge money-making trades.
What institutional players look at are HTFs.
-20241022082825972.webp)
Don't care much about Supply and Demand unless it's Extreme Premium or Extreme Discount — HTF highs and lows. 🔷Premium & Discount
You win this game when you can be on time to buy at HTF Demand and sell at HTF Supply:
- Wait for extreme Discount level on the charts and buy + look for long opportunities.
- Wait for extreme Premium level on the charts and sell + look for short opportunities.
Full analysis: W > D > 4H < LTF. Mark important levels. Set alerts. 👑Timeframe Rules
For 💎Supply & Demand Trading context, remember TSLA: whales always buy or sell at major reversal levels where they've previously placed orders, filling any remaining ones. Sometimes it seems like they take a long time, but that's because they don't operate on the short-term. If you look at FX markets, you'll notice that it can sometimes take as much as 10 years for major supply or demand levels to be reached before a powerful reversal occurs.
Extreme Premium [HTF Supply] and Extreme Discount [HTF Demand] — and a ton of confluences:
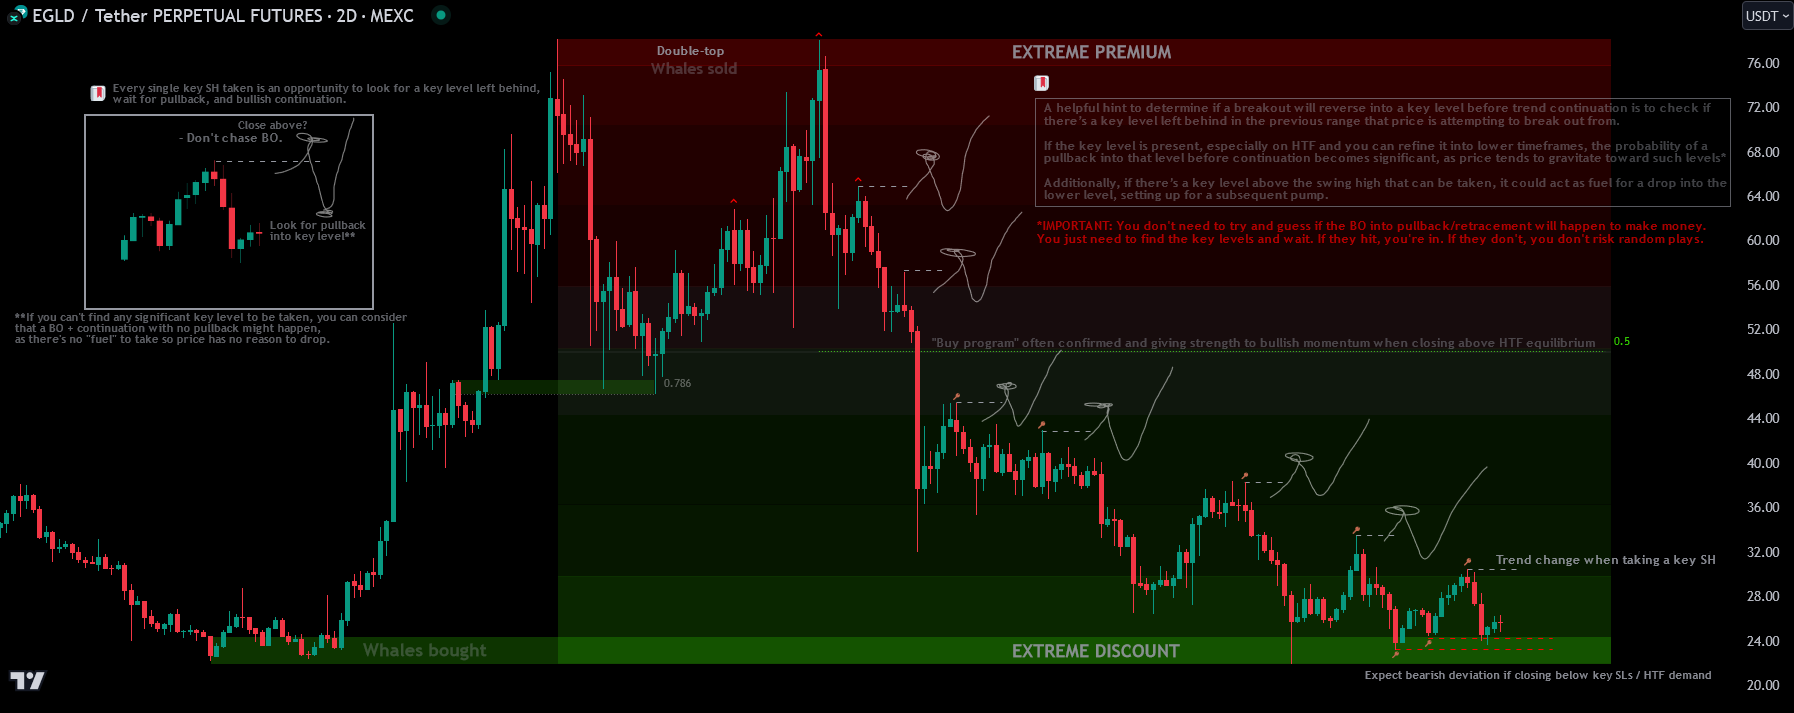
Expect bearish deviation if closing below key SLs / HTF demand.
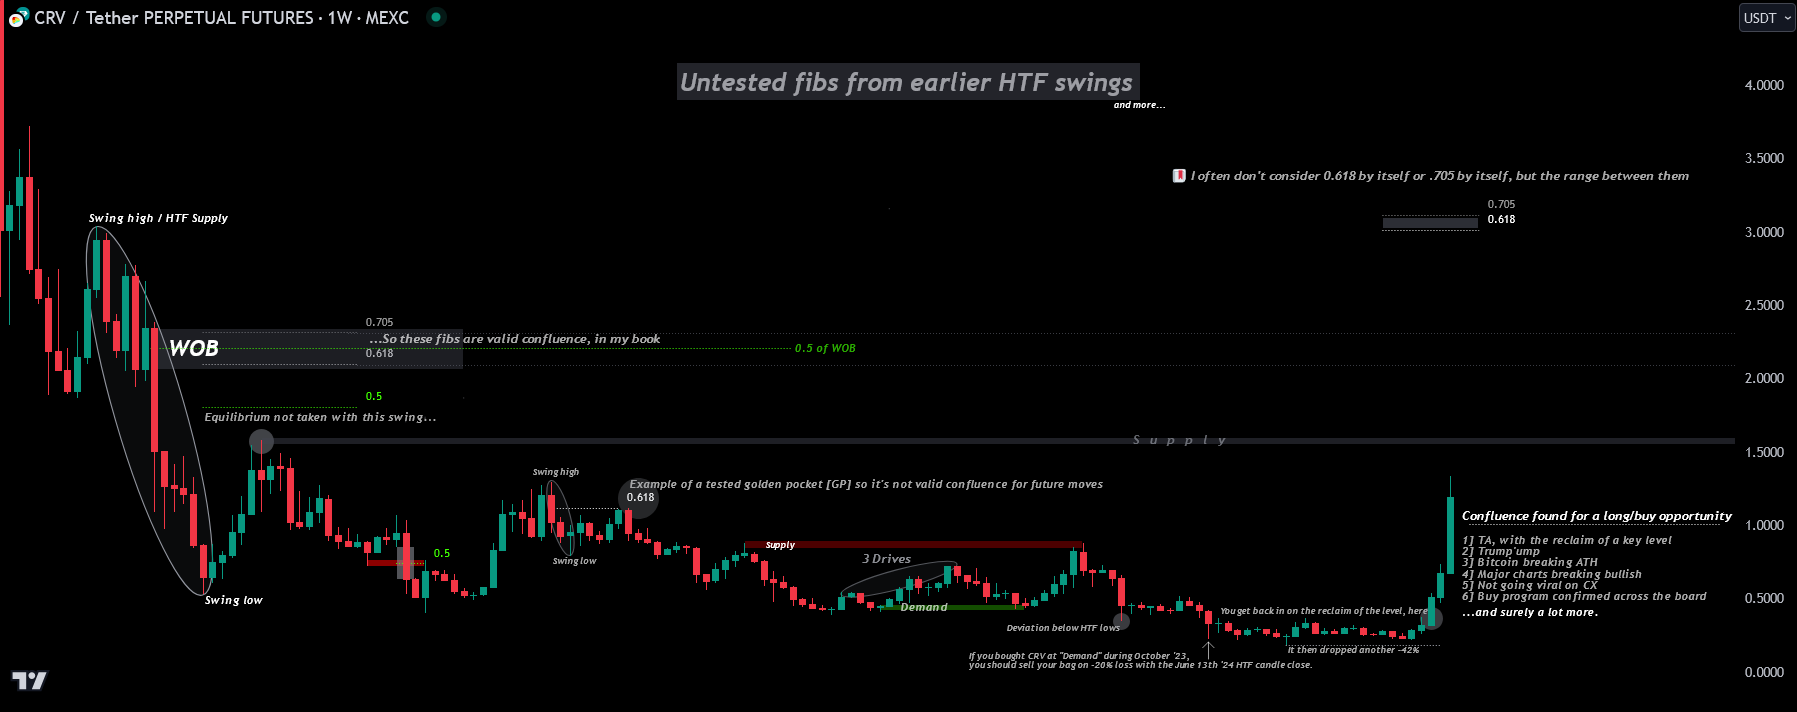
When 🔷Fibonacci Levels confluence with HTF zones, the picture sharpens further:
Probability and Confluence
Supply and demand are always potential reversal levels but not the highest of all probabilities levels. Hit rate stays high because probability is measured by how many confirmations at that level through different timeframes you can find.
The more confirmations, the more powerful. This is where Confluence and 👑Refine or Ultra-Refine Plays enter the picture.
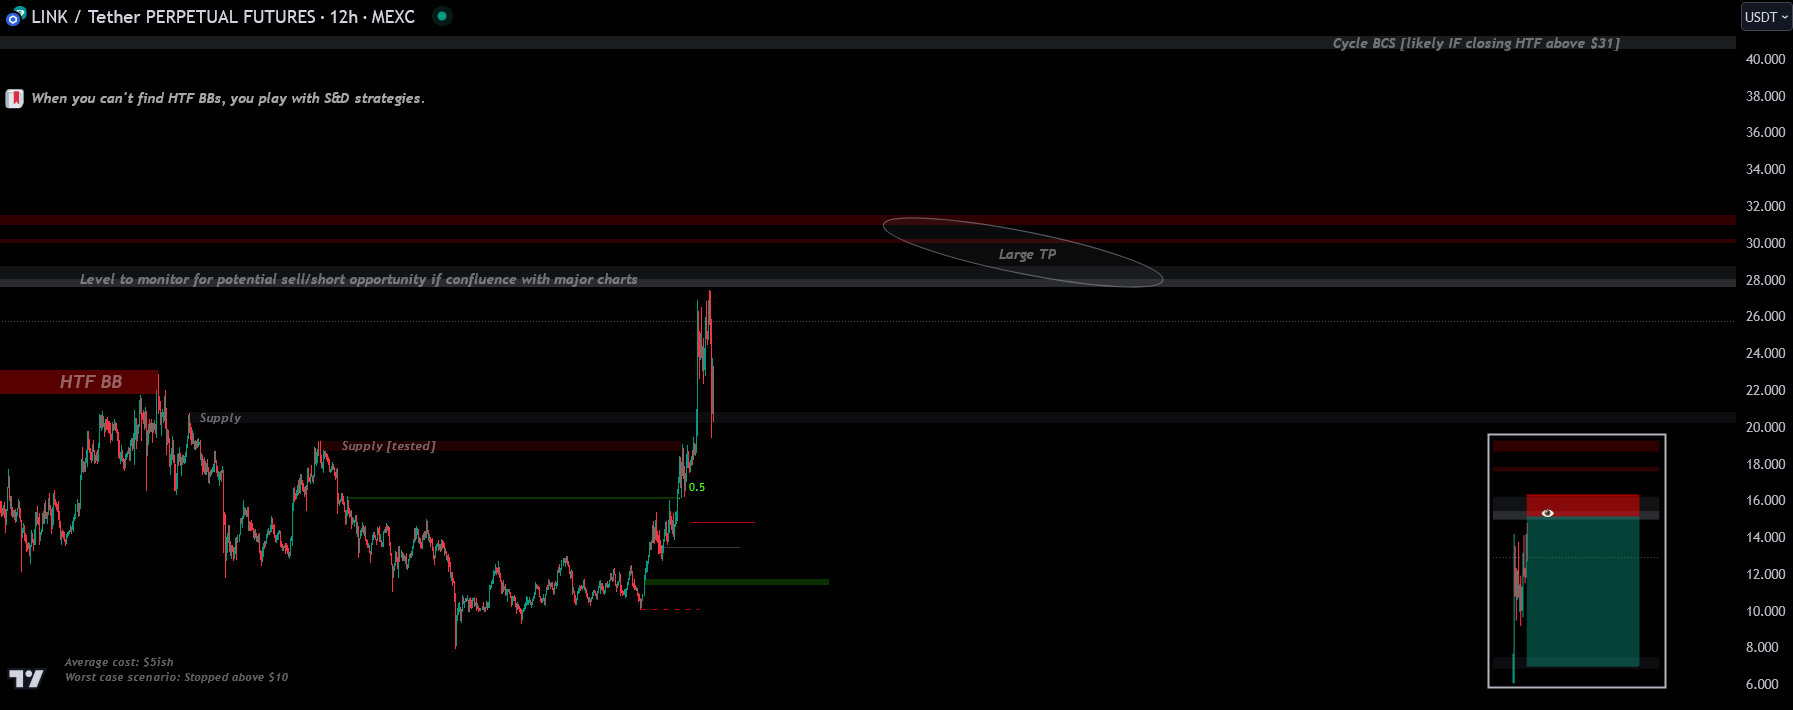
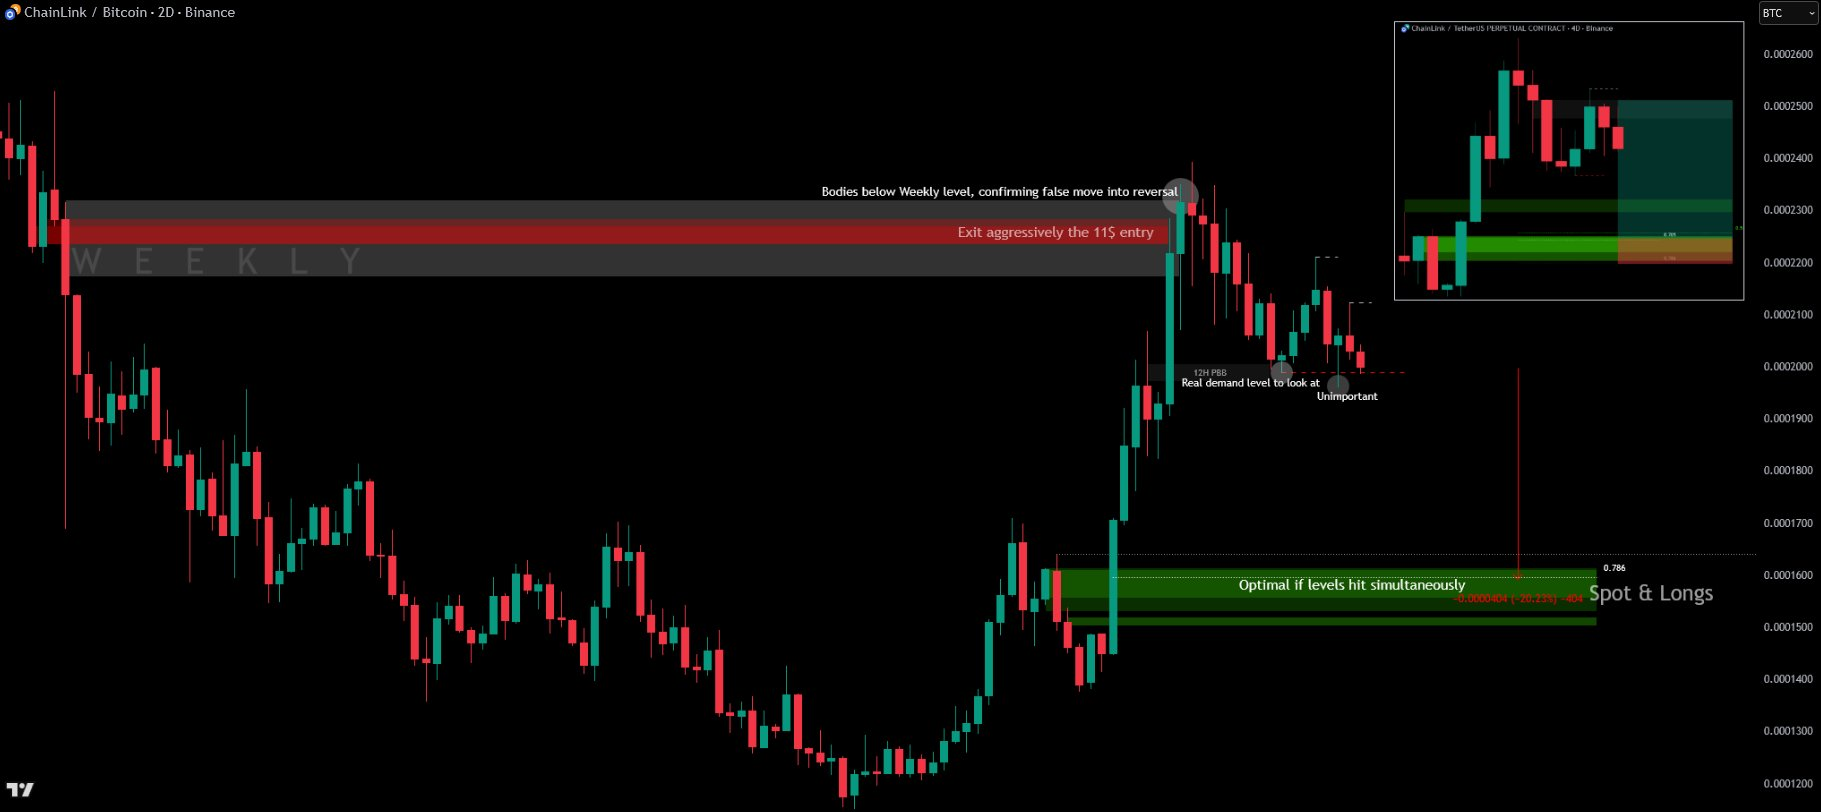
When you can't find HTF BBs / HOBs to be found, you play with S&D strategies. Bodies in both extremes of the current range are selected. If there are no refinable bodies near both extremes, fresh wicks / double tops bottoms / extreme discount & premium are used. SUPPLY & DEMAND SELECTION AND REFINING
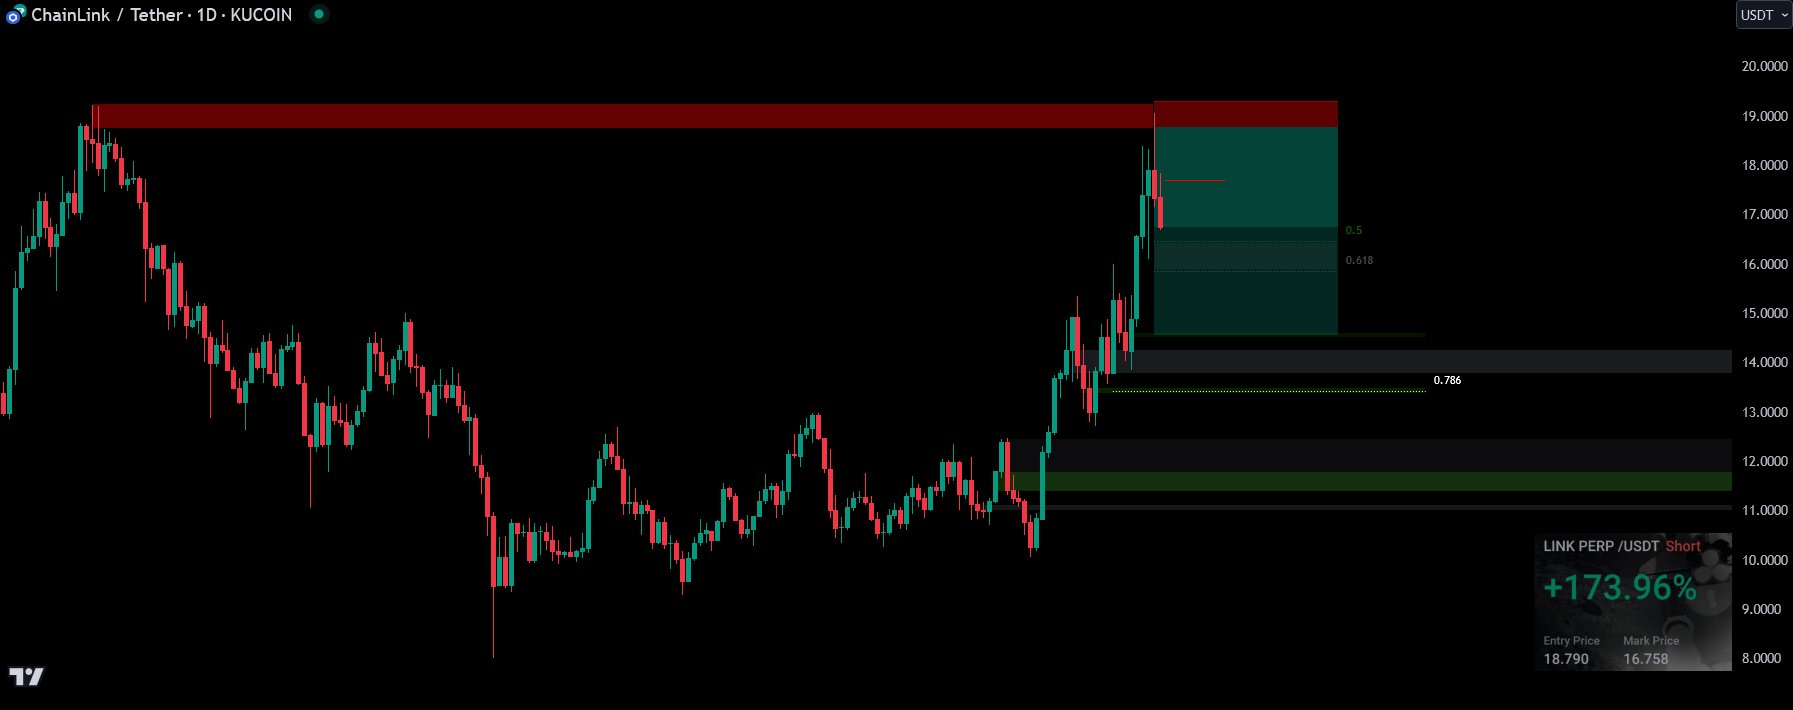
LINK on HTF, when you can't find HTF BBs, you play with S&D strategies:
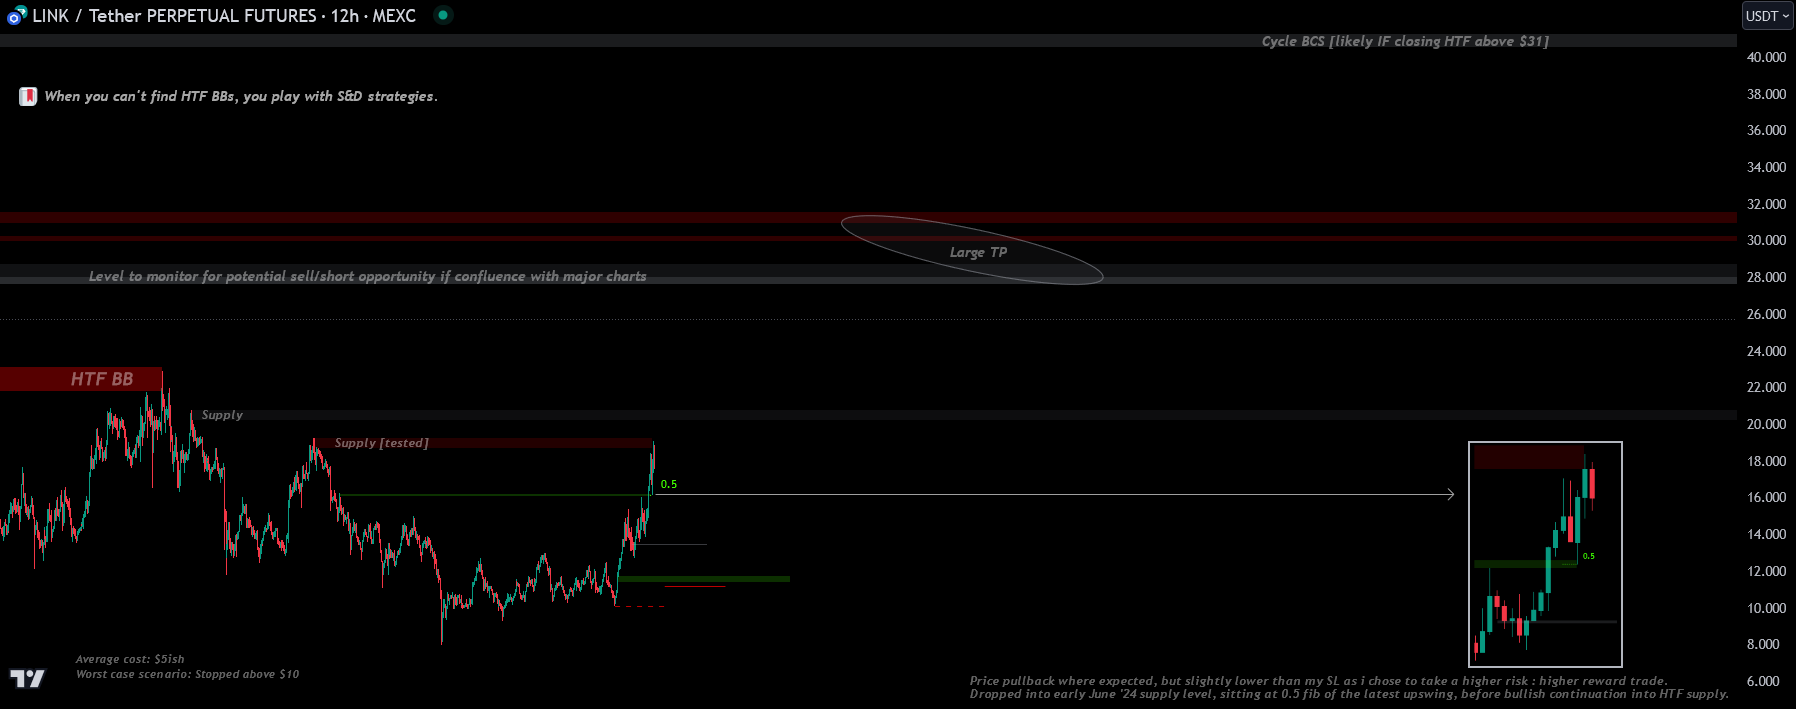
Buy with whales, and sell with whales:
ROSE HTF — dig into lower TFs when charting in order to find hidden confluence / market makers footprints. 🐋Whale TA Analysis

Supply (single candle = whales sold and likely to come back to this level and sell remaining orders as they are too big to sell everything at once).
The same on ROSE:
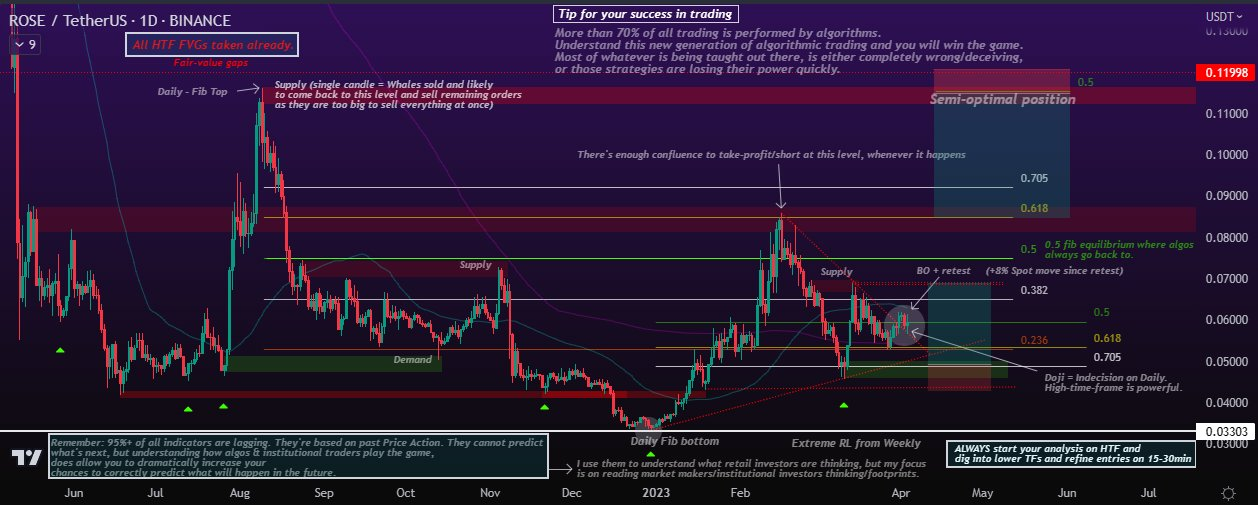
Pay attention to equal-high wicks / double tops. The reverse logic applies for demand.
Yes, you can use even higher timeframes such as 1W or 1M if there's enough PA for it.
Opposite Pole Plays vs FVG Stacking
There's a difference between taking a level through FVGs in the same direction versus playing the opposite pole.
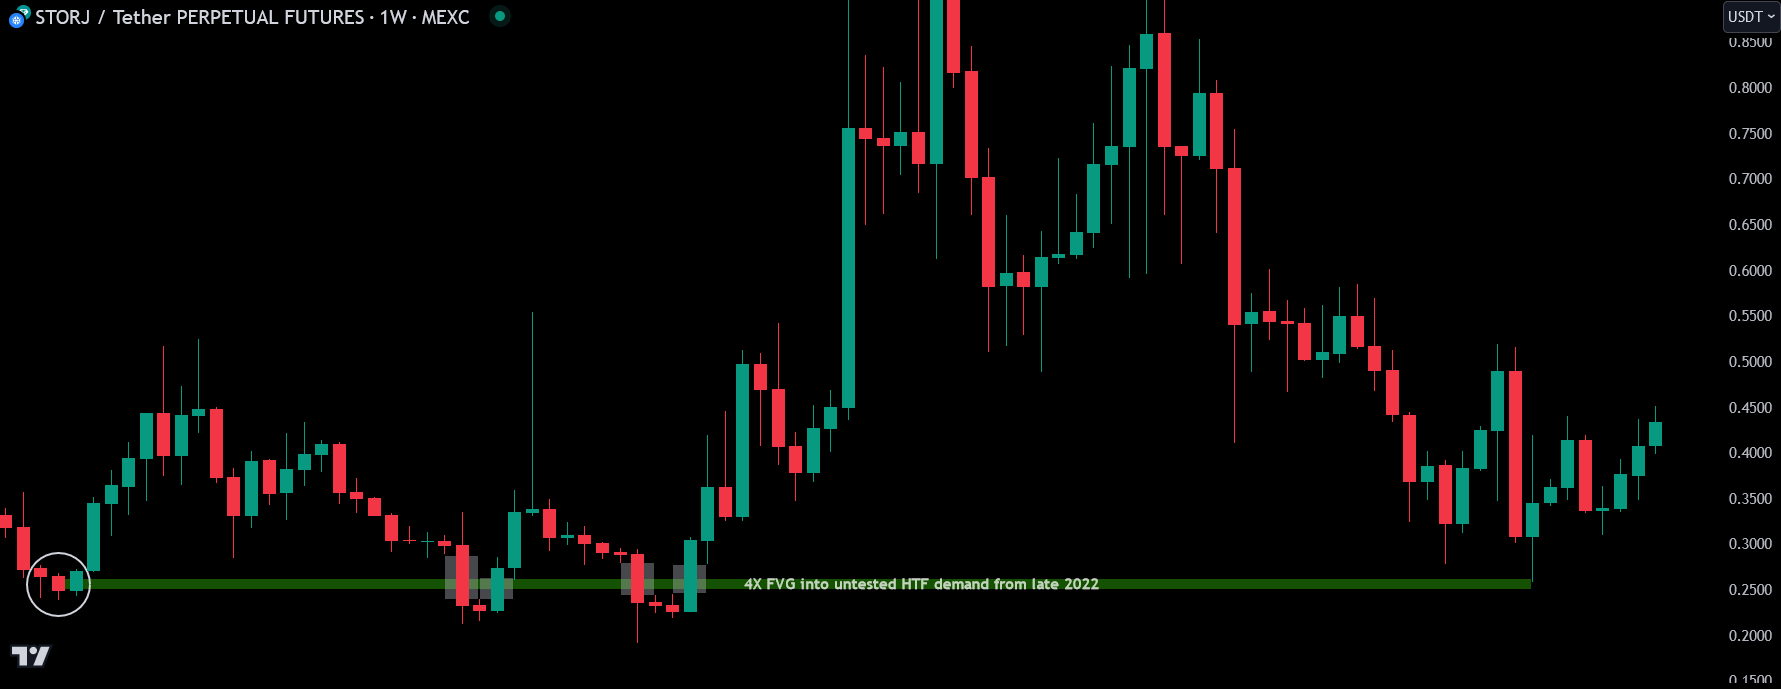
For STORJ, the move only gapped through the level once, with a Weekly candle. The first FVG from June first wasn't good enough — don't chase Supply & Demand principles on anything that's not at least a large cap. The other two FVGs were on the same direction, and the play here is opposite directions, like opposite liquidity poles. Opposite Pole Trades
If it had gapped through again — unlikely because the level is just perfect — take the SL and it will eventually hit and get SL back, riding a long and spot bag into major profits.
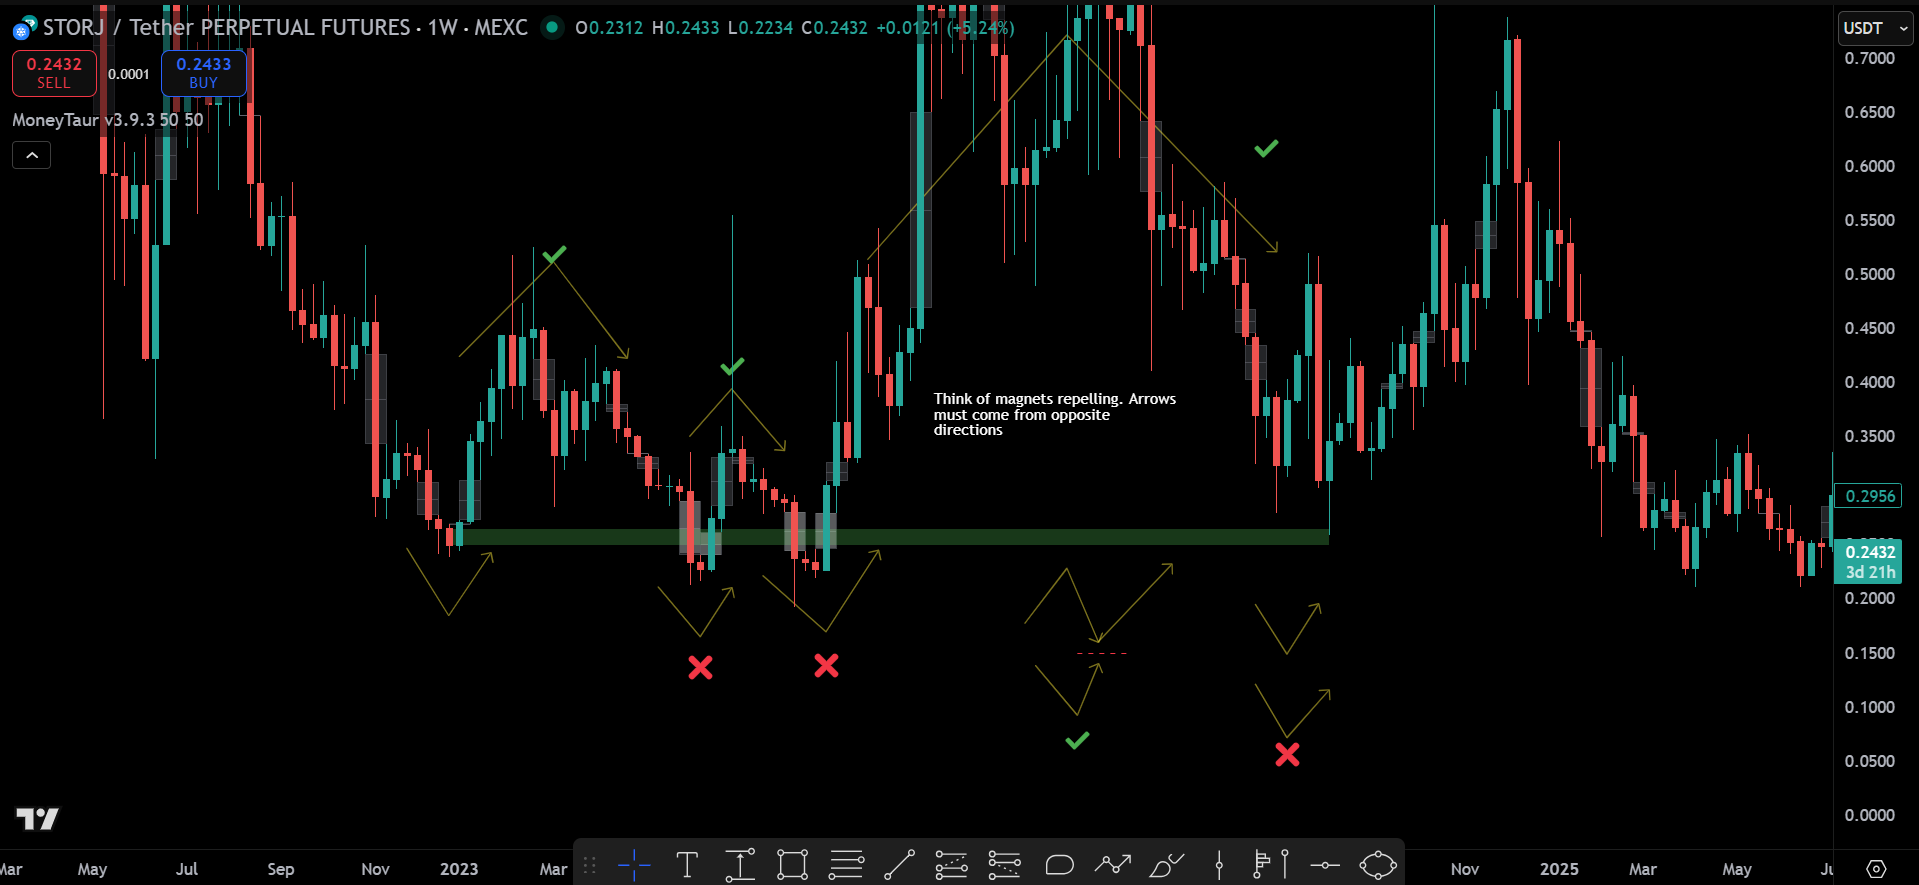
Opposite Pole Trades explained more directly:
Opposite poles/direction is more powerful than taking a supply level through FVGs in the same direction.
- The more FVGs hide a key level, the more powerful the level is. No PA is the same. The game isn't "linear." 🎮Game Isn't Linear
- Countless different criteria exist because there are millions of different patterns. It's not always what's "valid" or not, but how powerful each different level is.
- Don't try all FVGs just because it's an FVG into liquidity. Often don't confirm an opportunity if there's no fibs confluence or ability to refine through TFs.
- No need to wait for PSH or PSL close when it's like this, because this is proper hidden liquidity on HTFs. 🎁Hidden Liquidity Levels
- Look for opportunity at the test on opposite directions.
Refining Into Bodies
💎Supply & Demand Trading refined into bodies instead of wicks — the ADA play:
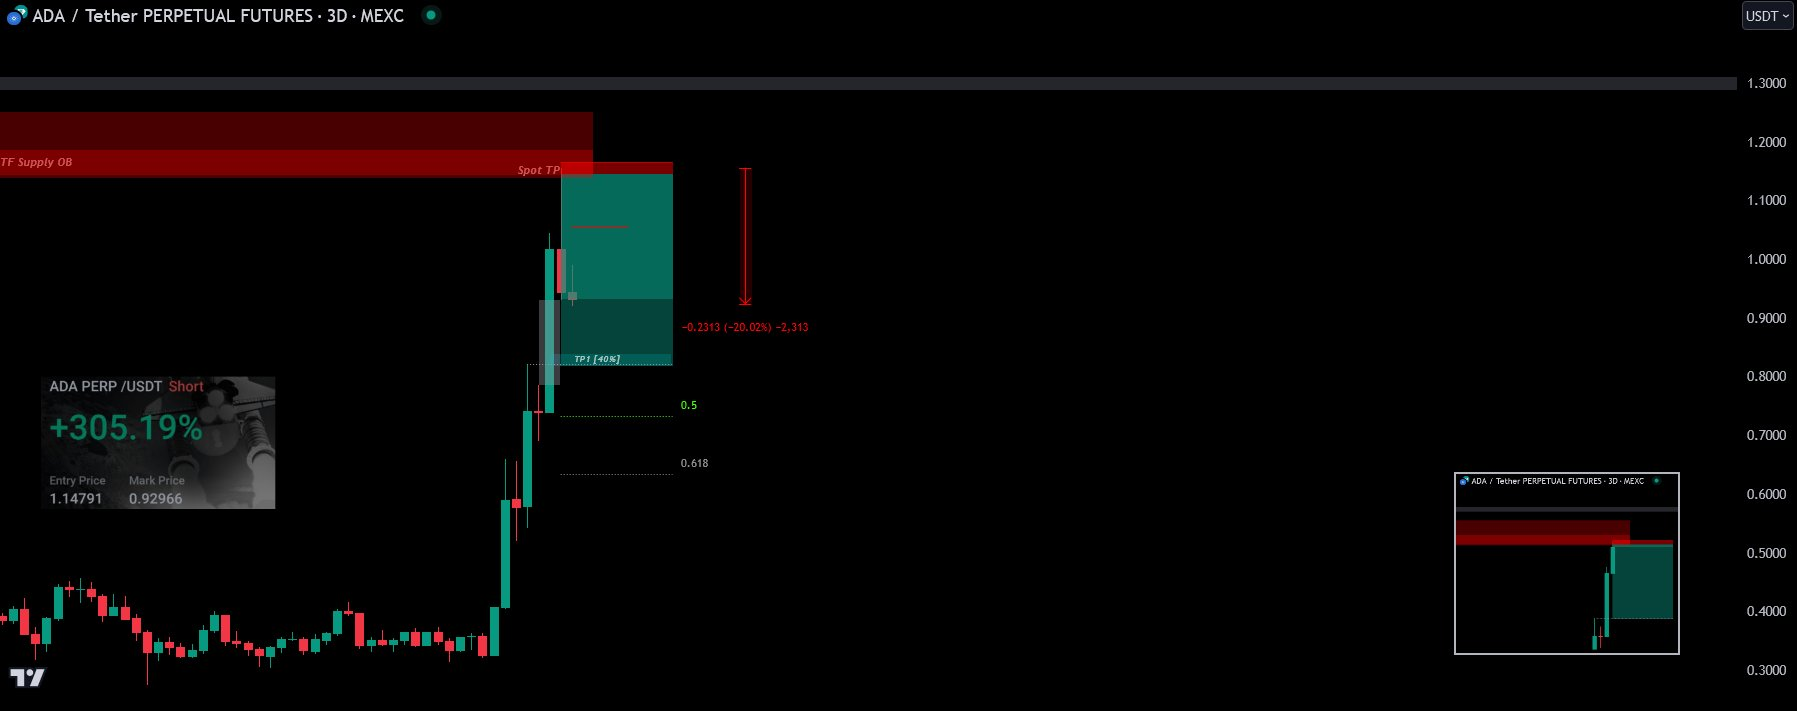
The reason for choosing the 5D/3D OB over a massive Monthly OB outside the supply area is supply and demand principles applied with body refinement. Sometimes the cleaner setup is in the lower-timeframe body inside the higher-timeframe context, not the macro wick.
Bitcoin 1min — supply and demand, liquidity games. The game is perfect. See what others cannot see and earn what others will never earn:
-20241123214719097.webp)
Alchemy Pay — same idea, 💎Supply & Demand Trading:
-20241123214906085.webp)
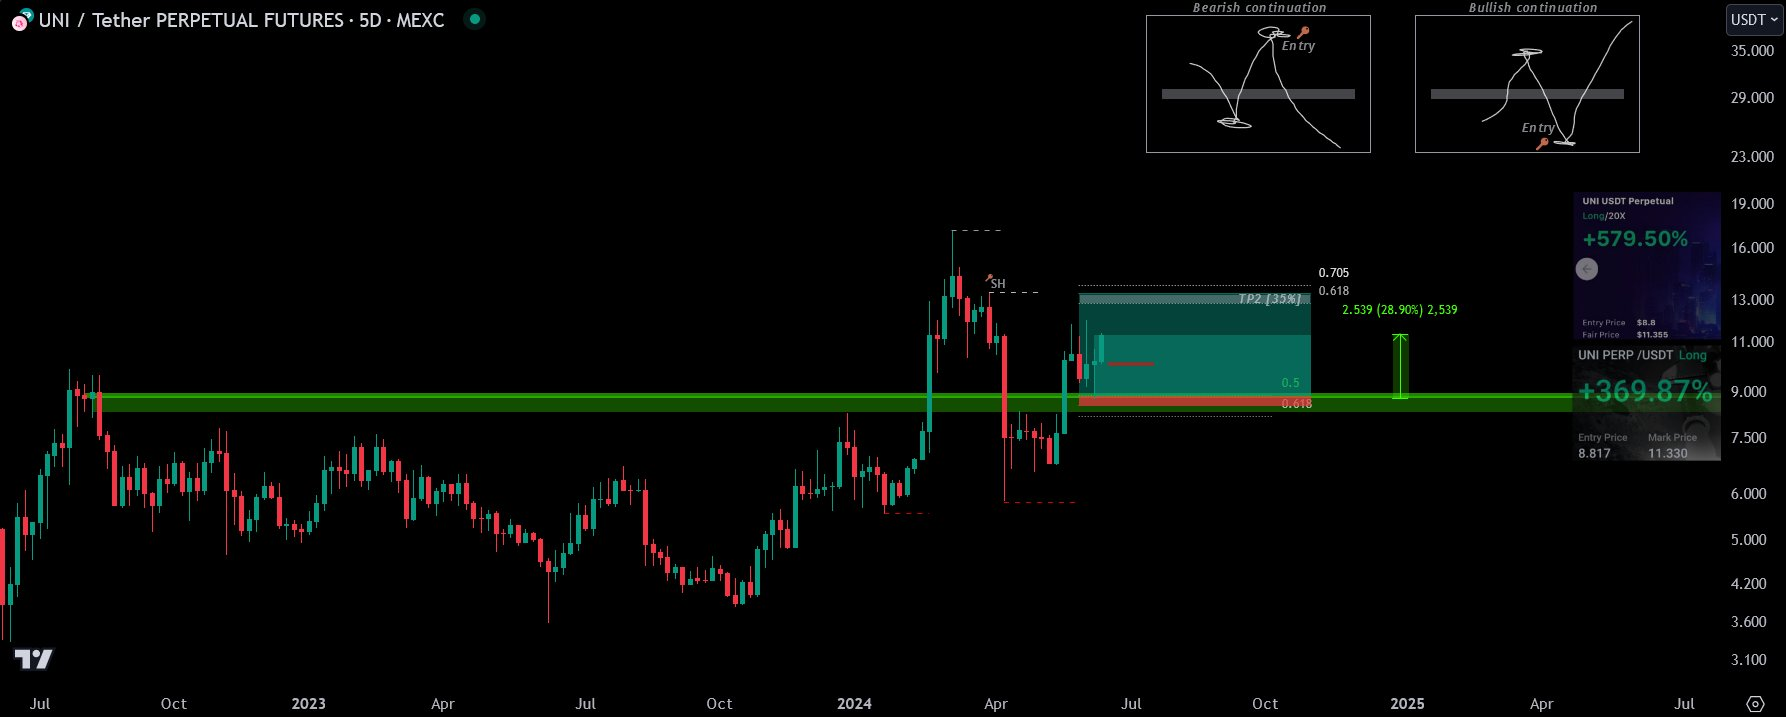
CRV at $0.50 — long re-entry on retest, half-size vs first hit, add size into MTF key levels, trail along. Hodl spot bag unless closing below key level:

You can TP at fibs and re-enter at second hit, not third — or hold all bullish positions and trust the level holds. Trader's discretion.
When looking for an HTF reversal on altcoins, don't take profits on spot, or at least try not to, because there are multiple HTF key levels and demand zones already taken. PA isn't sitting mid-range; it's mostly buried at the bottom of the charts, deep in demand territory.
If you actually understand 🎁Supply & Demand principles, you know the natural progression: price tends to reverse upward, at least toward the 0.5 retrace of the HTF range. Majors confluence is a must.
Accumulation and Distribution
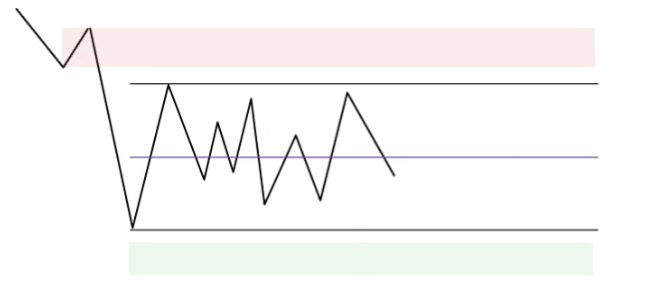
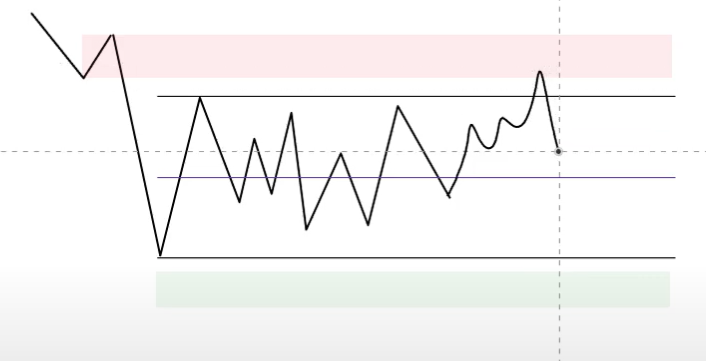
At areas of supply and demand, you won't always have price reversing drastically once it reaches there. You'll often have price chopping sideways first before taking off. This is a result of the process of Accumulation and Distribution occurring live.
Accumulation: When price is at a key demand zone, MMs will accumulate their positions because they can't buy everything at once. If they enter too much at once, the market will likely take off to the upside, resulting in less profit (smaller filled position than intended). They gradually load up and spread out their buy orders, creating sideways price movement.
Distribution: When price is at a key supply zone, MMs will distribute their positions because they can't sell everything at once. If they sell too much at once, the market drops and they sell below their desired premium price. They gradually sell, spread out orders, create sideways consolidation.
This is why we see multiple touches at heavy liquidity areas before the true reversal. If there isn't sufficient liquidity at the time to complete their position, whales will let price move away and then come back to complete it. No need for other indicators — clear as day when you know how to read PA.
patterns naturally form during the process of accumulation and distribution. The variety of patterns reflects the process occurring in real-time. 🐋Whale TA Analysis / 🔷H&S and 3 Drives
The example below shows the accumulation/distribution process visually:
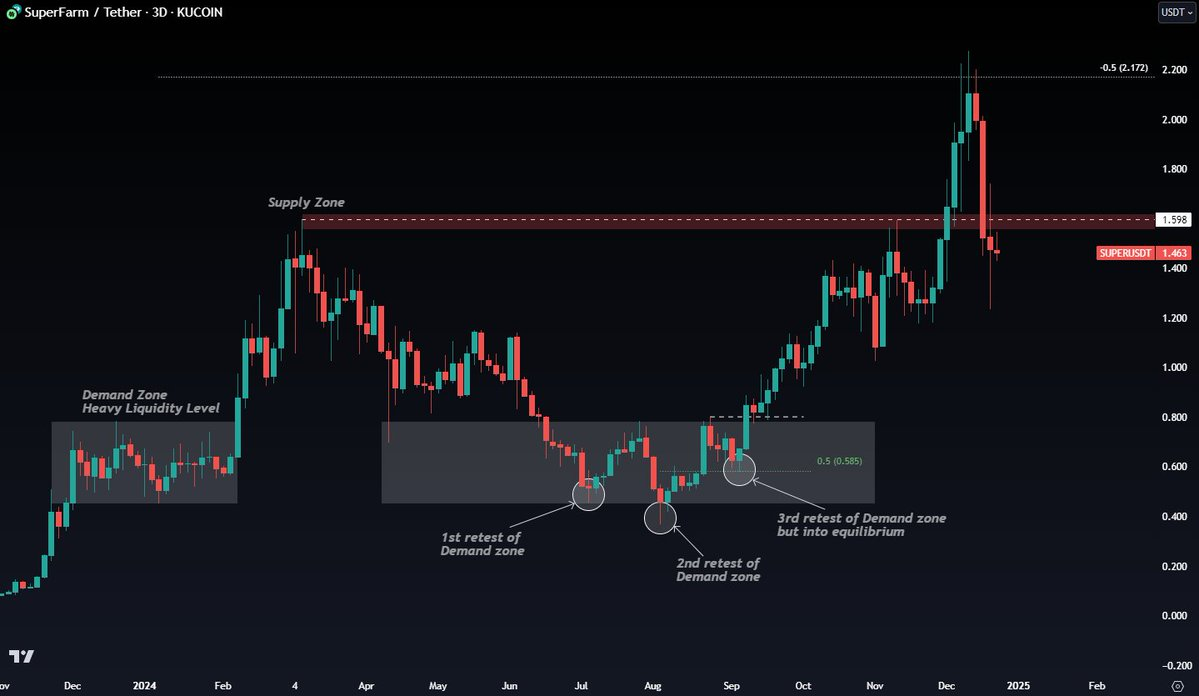
Accumulation Strategy
-20241230125502501.webp)
-20241230125532446.webp)
Distribution Strategy
-20241230125652154.webp)
-20241230125712606.webp)
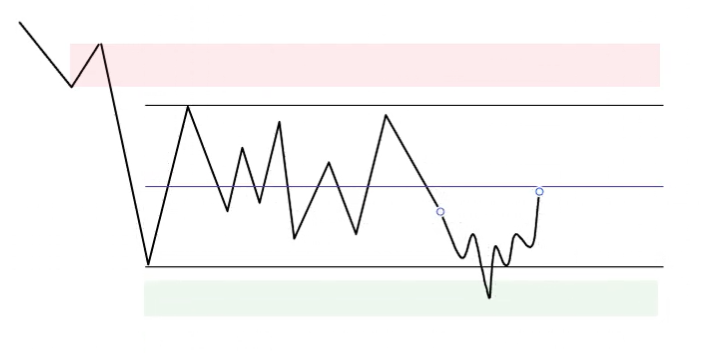
Re-Accumulation and Re-Distribution
During an uptrend, you'll have a pullback to a demand zone — if price reacts through sideways movement, this is re-accumulation. Re-distribution is the same, flipped.
-20241230131037182.webp)
-20241230131148087.webp)
The big boys aren't going to add to winning positions at any random place. They still look for demand zones and areas of value within a moving trend to add heavily.
-20241230131324439.webp)
-20241230131549064.webp)
-20241230131612799.webp)
-20241230131712002.webp)
-20241230131748458.webp)
-20241230131905833.webp)
-20241230132107413.webp)
Even when news fueled a drastic move (banking crisis on Goldman Sachs), price action already showed what was occurring weeks before the banking crisis actually happened. Price action is a reflection of what the big guys are doing behind-the-scenes. They knew what was coming and started moving money accordingly — reflected in the trend change weeks before the crash.
News and Manipulation
MMs always use FOMC as an excuse to make their moves. That's not retail moves — they can't be that fast, and they can't have such impact on price. It always goes and scoops key demand level and key supply level. Stop above/below those is wise.
News events, economic announcements, and market trends tend to occur in these zones, engaging traders and adding fluctuation:
- Bad news tends to flourish in demand zones.
- Good news tends to flourish in supply zones.
Significant shifts in supply and demand are driven by the actions of large institutions and major traders. Whale Manipulation🐋 Only large institutions with great buying and selling power can influence price movements, not retail. They have the power, money, and leverage to manipulate the market.
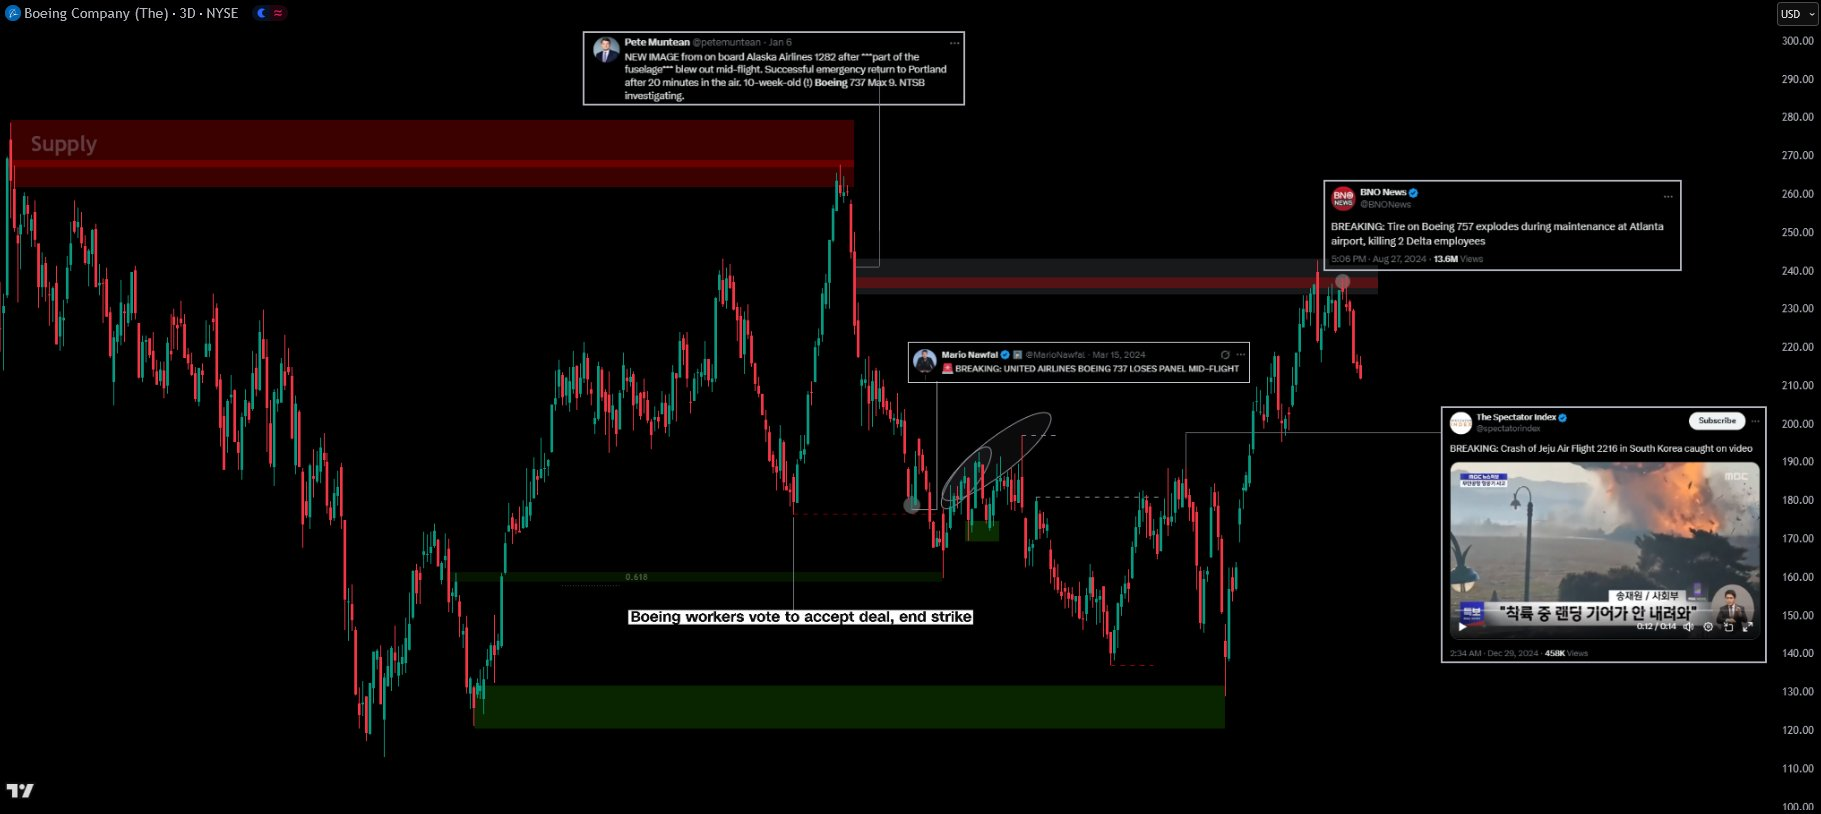
Institutions often time news releases with supply and demand zone pricing. You'll often notice big news about companies or assets being suspiciously released or unearthed exactly when price is at very key supply or demand zones. This is not an accident.
-20241230124823876.webp)
The big guys leverage price being at supply (premium) and intentionally time bad news as additional confluence to more easily sway the asset bearish (FUD). They leverage price being at demand (discount) and time great news to sway it bullish (FOMO).
Hacks are the excuse to send price after HTF Demand levels, IF there's PA showing liquidity at lower levels. The same happens for HTF Supply levels when sudden FOMO news is released, IF there's PA showing liquidity at higher levels. 🌊Liquidity (+Wicks)
Be smarter than the herd. They will FOMO at key levels, and whales will release max FOMO (not FUD — the typo correction matters): mainstream media shills, TV commercials, ETF approval and so on become accurate counter-indicators precisely at the top. Don't Be the Herd🐑
The simplest cheat-code: get to those higher levels and FOMO just like most fools in this space — and you'll be cryin' shortly after. In other words, when herd consensus is loudest, that's max FOMO.
Macro Supply and the Real Tests
Macro supply is always a level that gets tested multiple times until either a BO or a crash confirming a top.
Whales buy at extreme discount while deploying bearish news, and unload at extreme premium while deploying bullish news. The playbook is the same every time. When they want retail to absorb their bags, they flood the channel with hopium designed to squeeze retail into buying more alts — while macro structure says distribution.
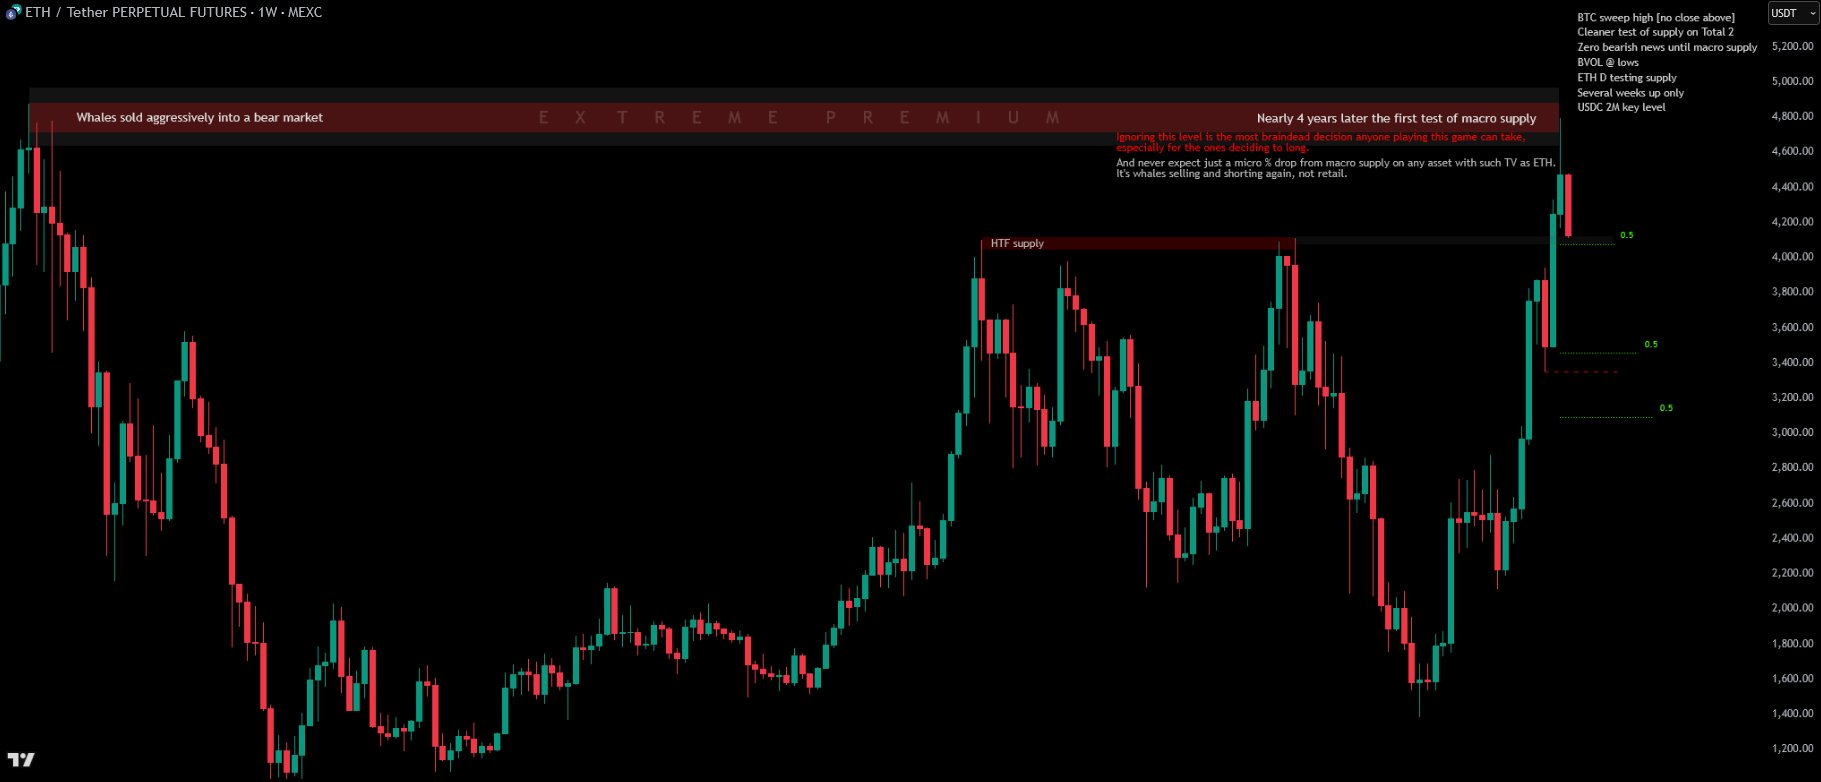
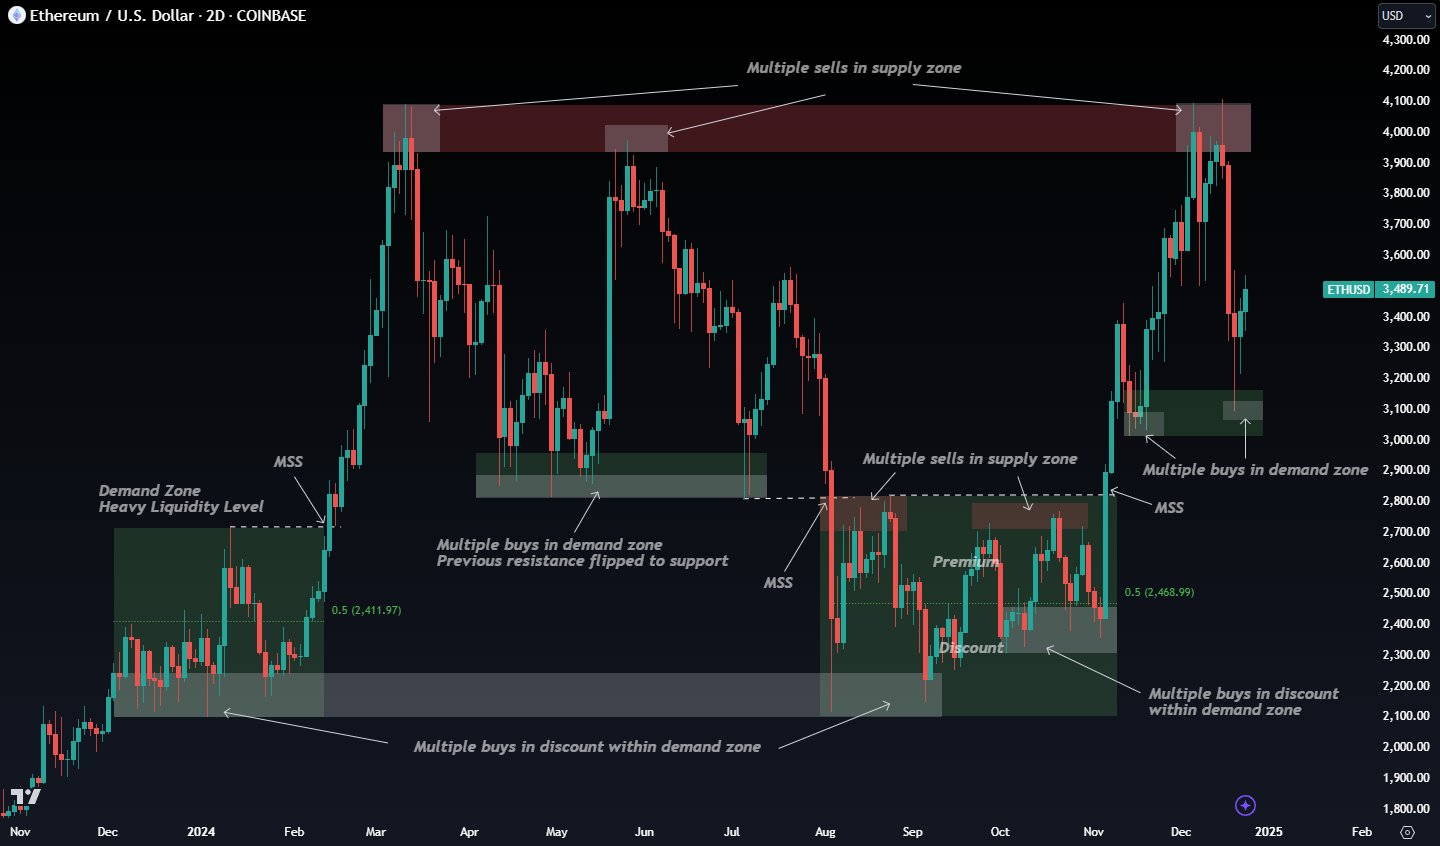
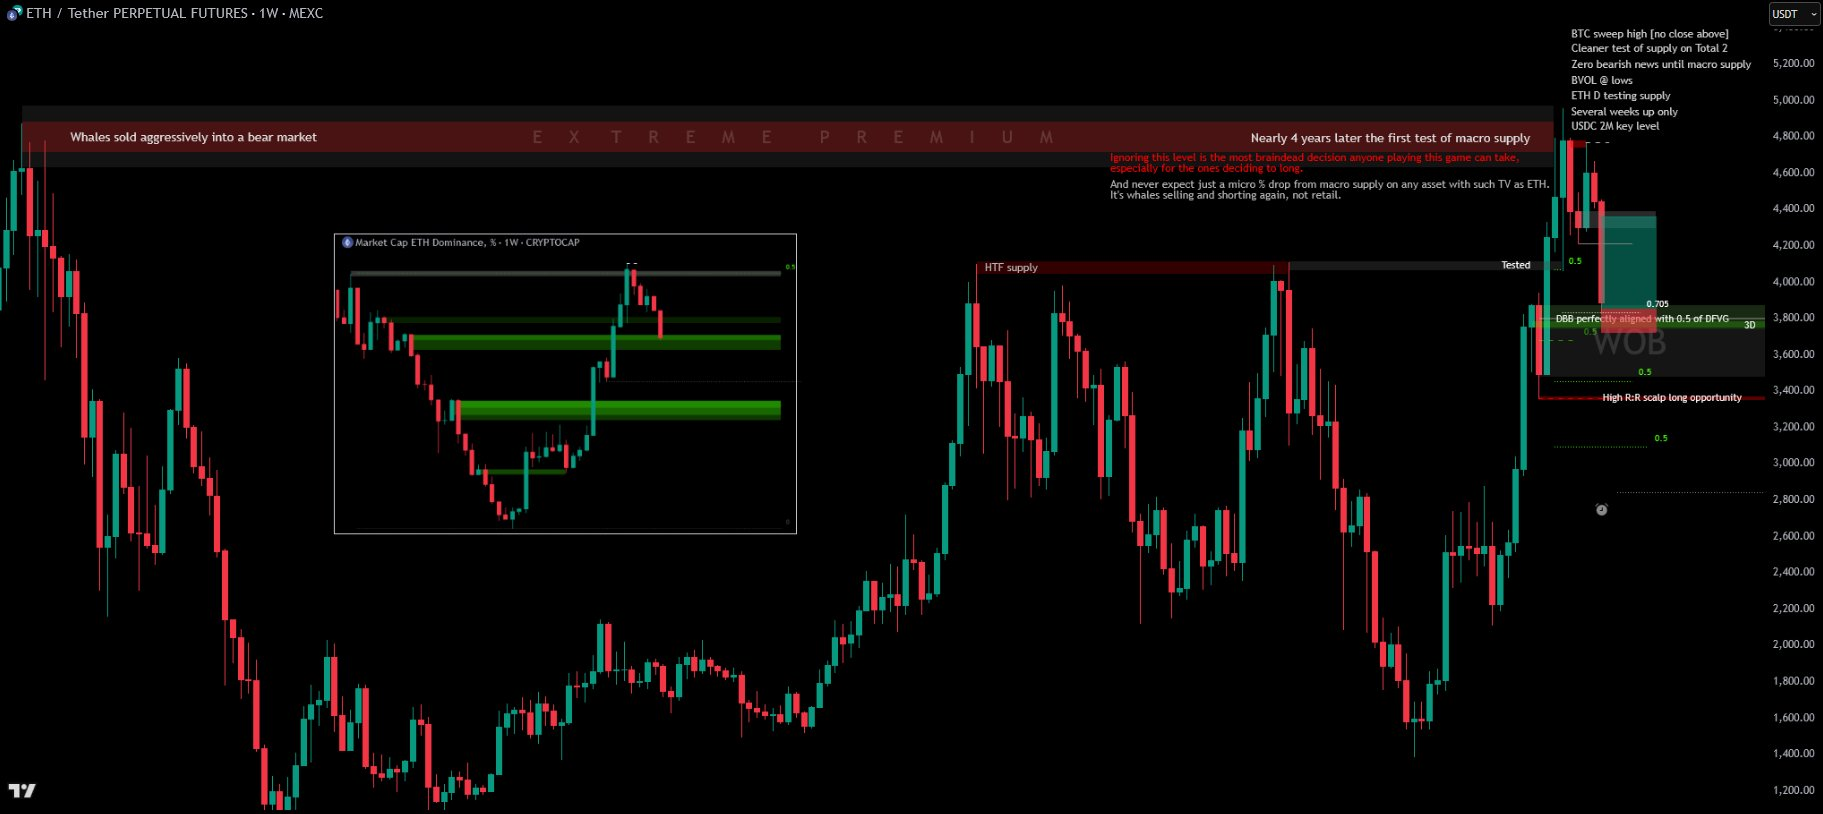
Nearly four years later, the first test of macro supply on ETH. Ignoring this level is the most braindead decision anyone playing this game can take, especially for those deciding to long. Never expect just a micro % drop from macro supply on any asset with such TV as ETH. It's whales selling and shorting again, not retail.
The full confluence stack with hit to extreme premium:
- BTC sweep high (no close above)
- Cleaner test of supply on Total 2
- Zero bearish news until macro supply
- BVOL at lows
- ETH D testing supply
- Several weeks up only
- USDC 2M key level
Total Crypto Market Cap & Etc
Find, wait, play, win, repeat.
Don't fly blind when at key levels:

There's far more behind a chart and past PA than meets the eye. Whales engineer everything. Markets, narratives, even 'random' events if profit is on the line.
Examples: Supply Side
ALICE — similar setup to TSLA HTF bullish reversal, but at an HTF supply level instead of demand:
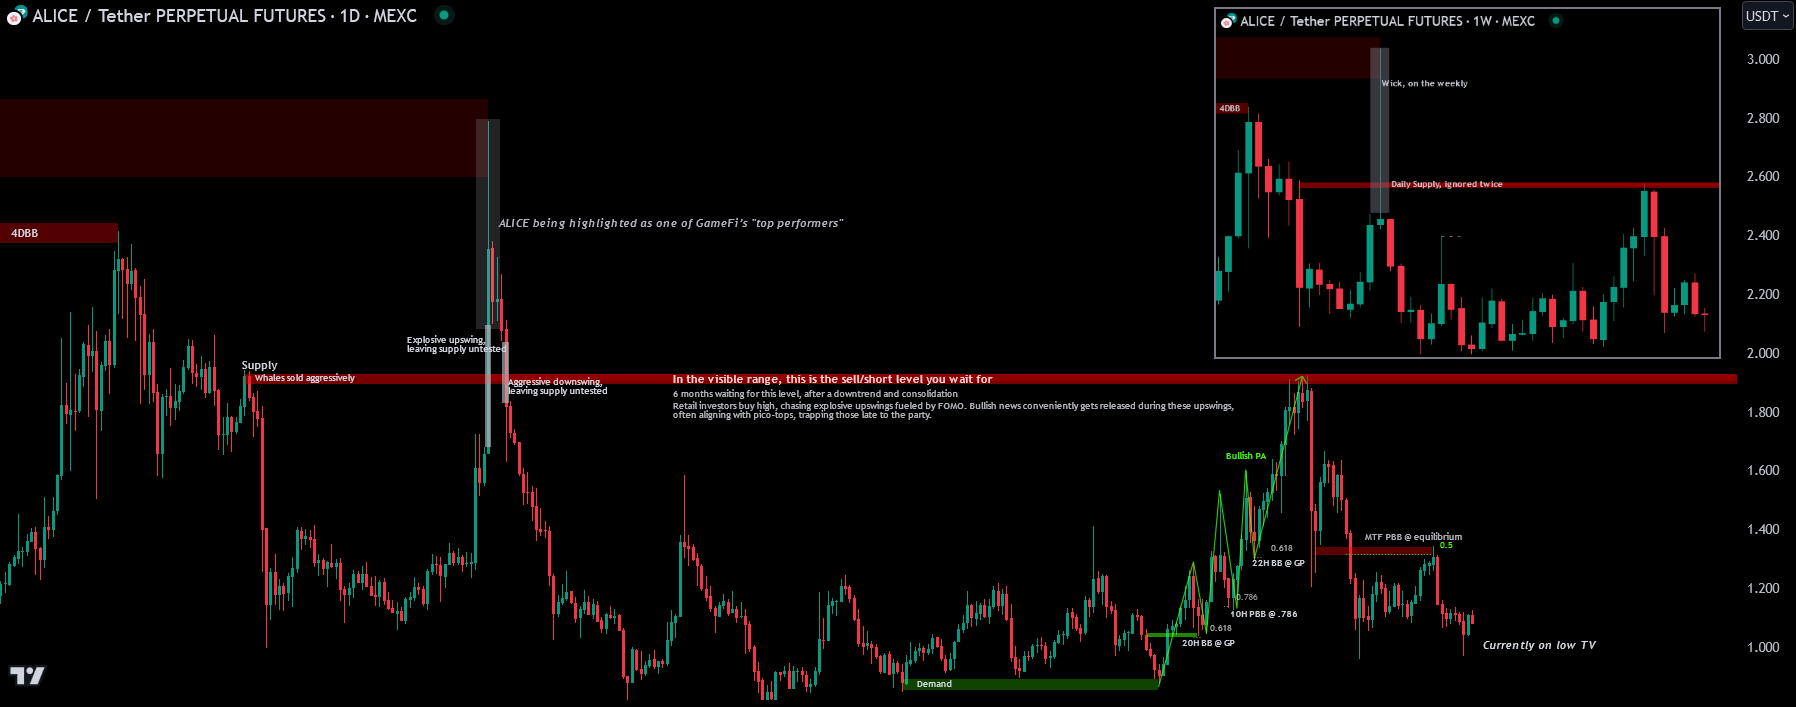
You won't encounter these every day, but they appear. Plan ahead and be ready to sell/short when they hit. Six months waiting for this level after a downtrend and consolidation. Retail buys high, chasing explosive upswings fueled by FOMO; bullish news conveniently gets released during these upswings, often aligning with pico-tops, trapping those late.
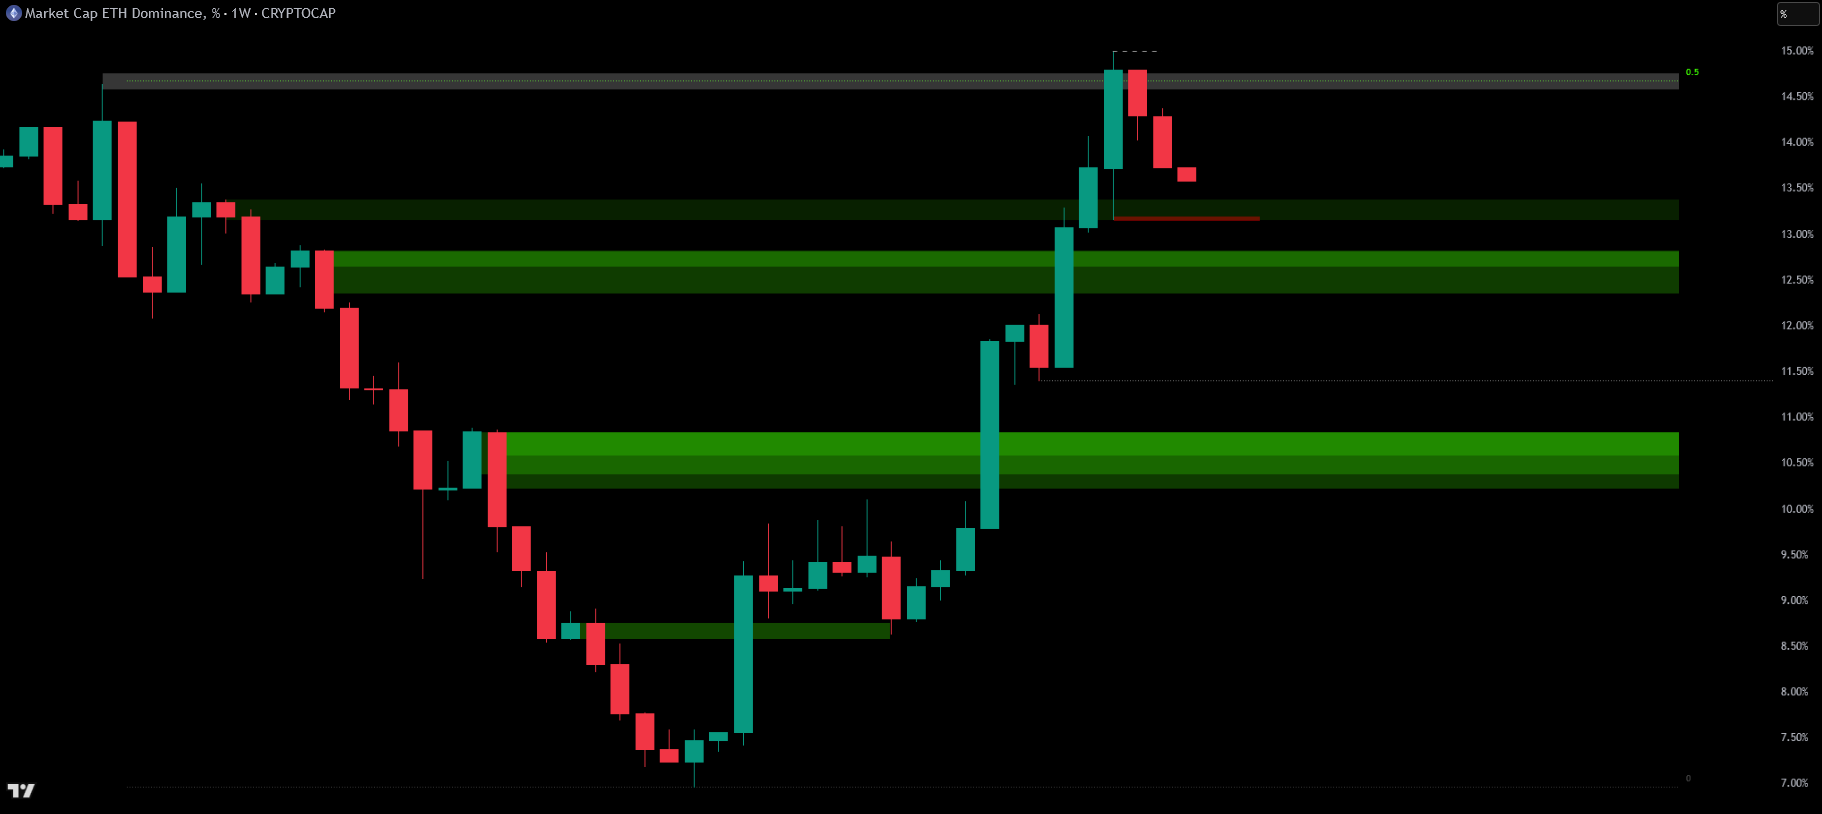
ETH dominance — supply + HTF 0.5:
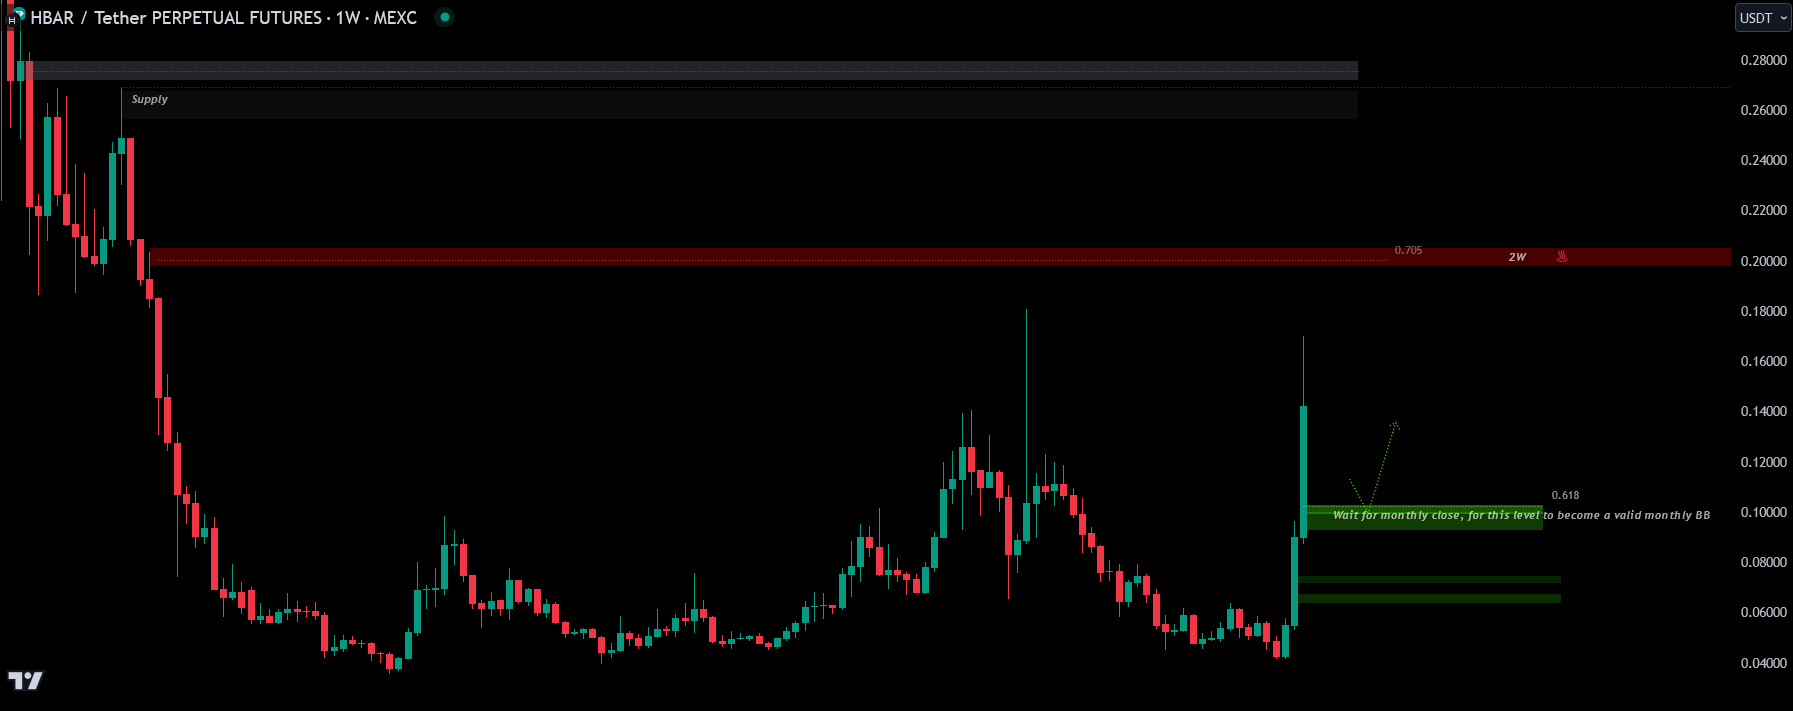
HBAR:
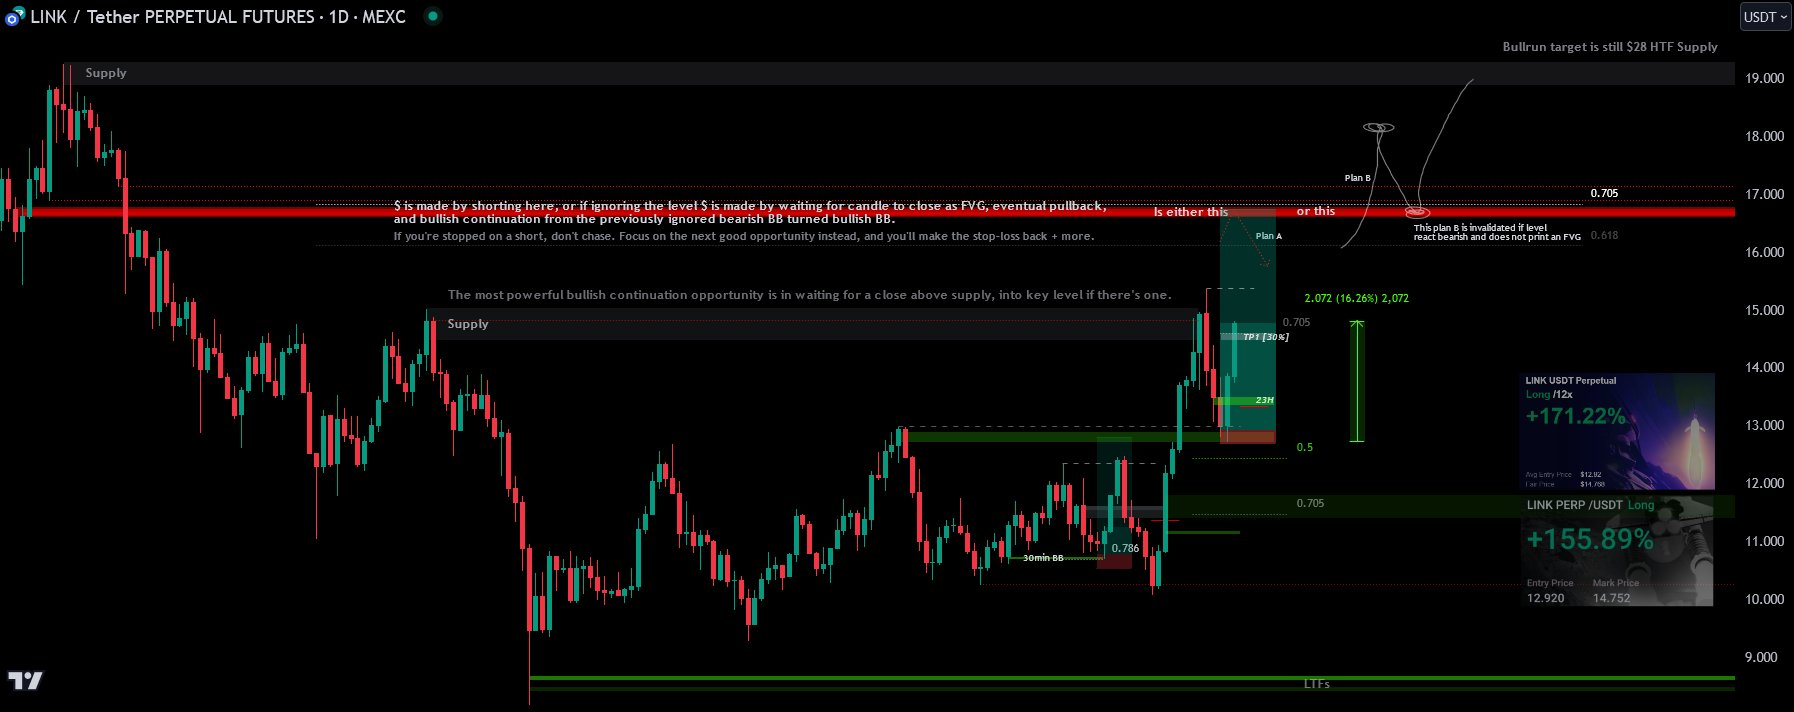
LINK:
They are watching:
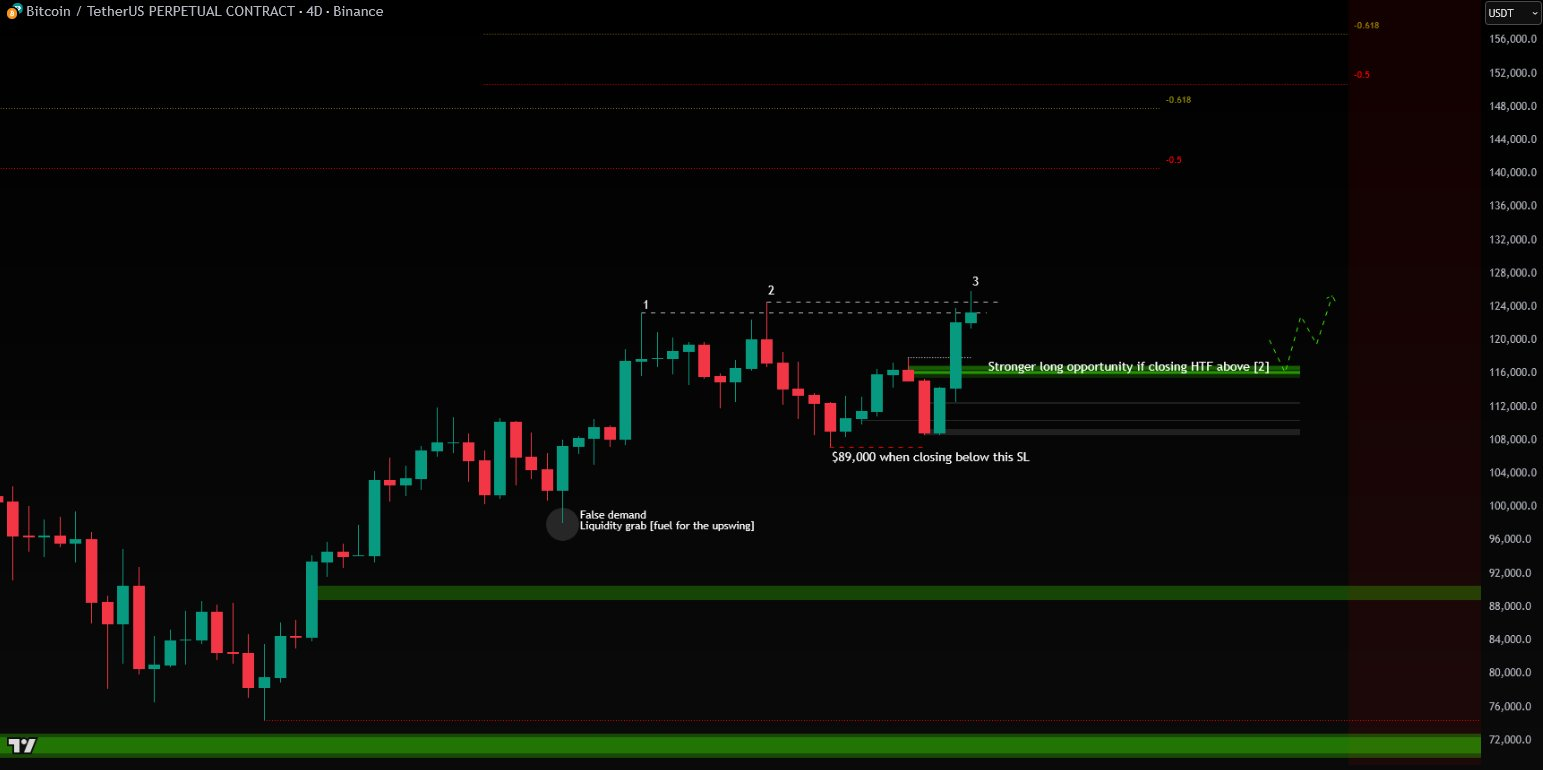
Scalp call from a $104,000-ish level on Bitcoin — what target?
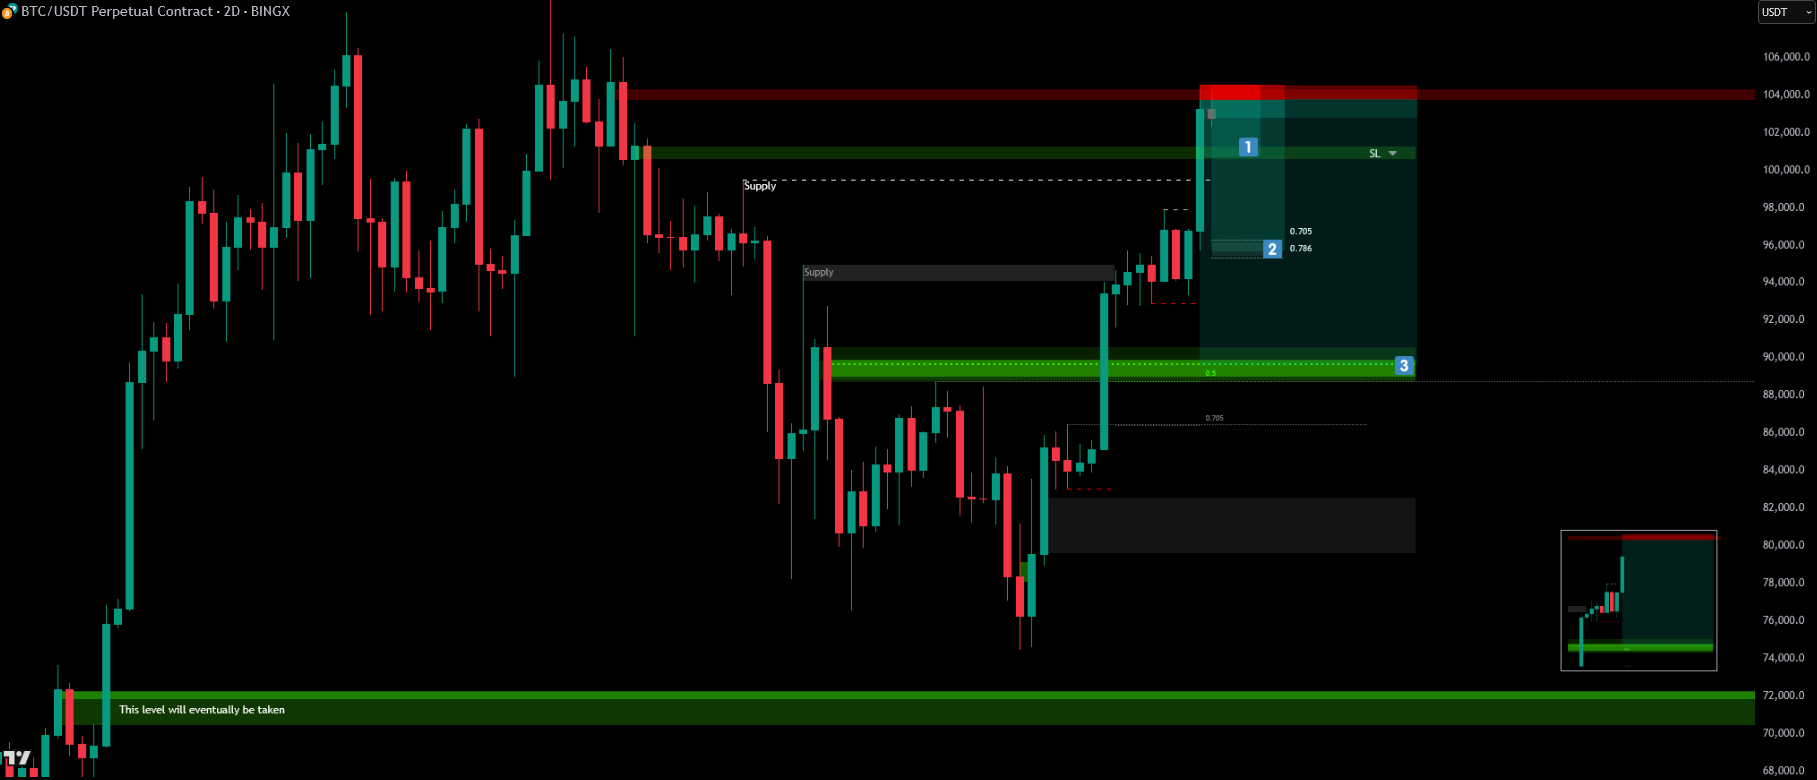
All targets are valid, but the best answer is target 1 (scalp), because the trigger is a tight level on a single, odd timeframe, allowing for a < 1% stop-loss, which makes a 30–50X leverage short (isolated) not just viable but calculated. That's how a precision entry turns into 90–160% profit in a short window.
⚠️ Don't project wishful thinking onto PA. Trade what's realistically there, not what you hope to see just because it's more profitable.
Examples: Demand Side
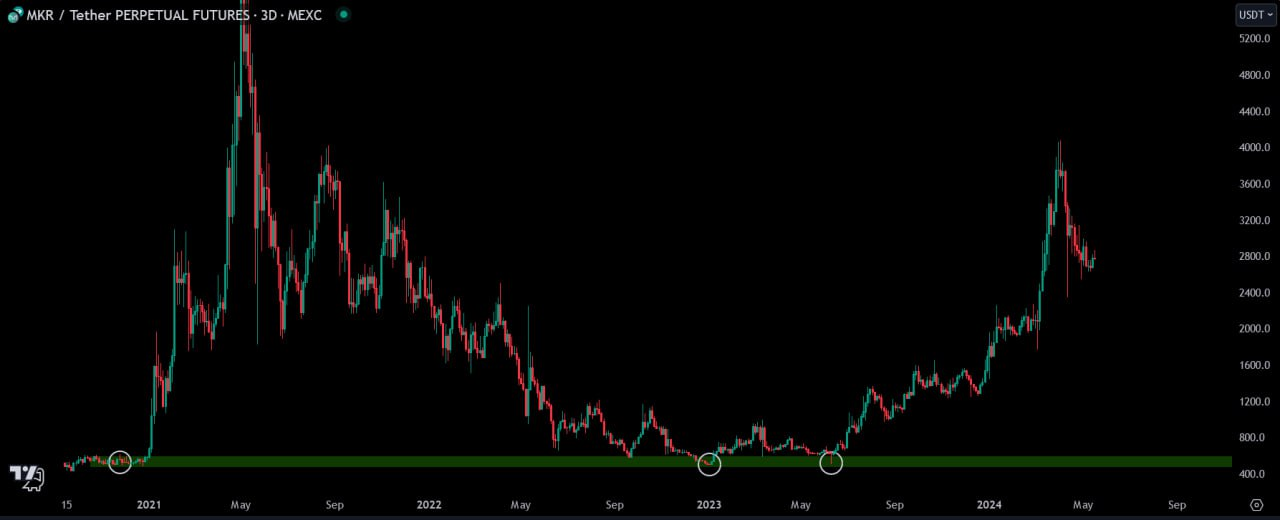
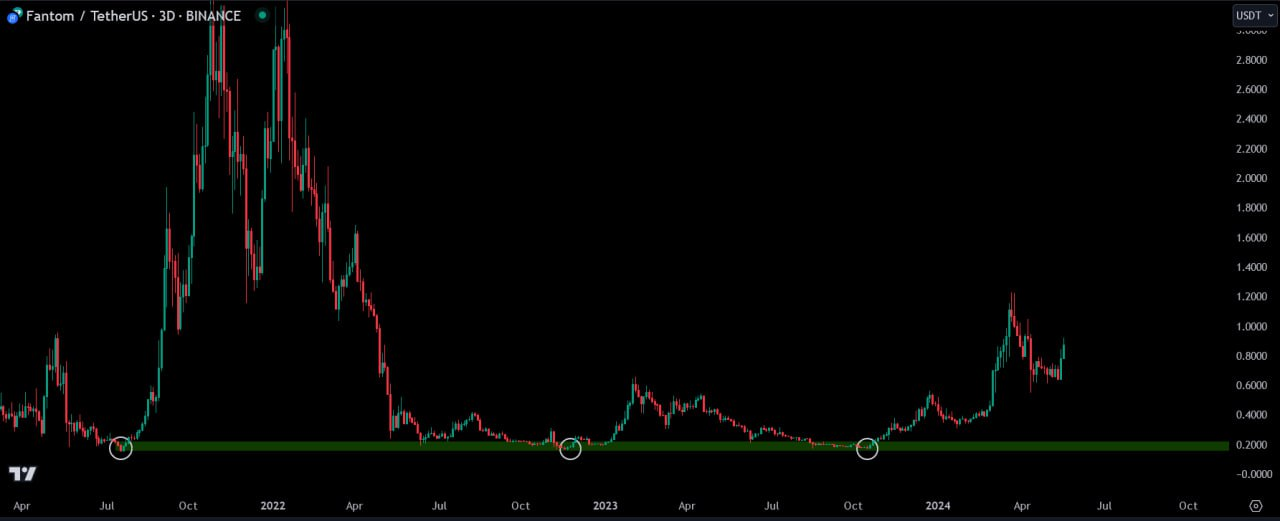
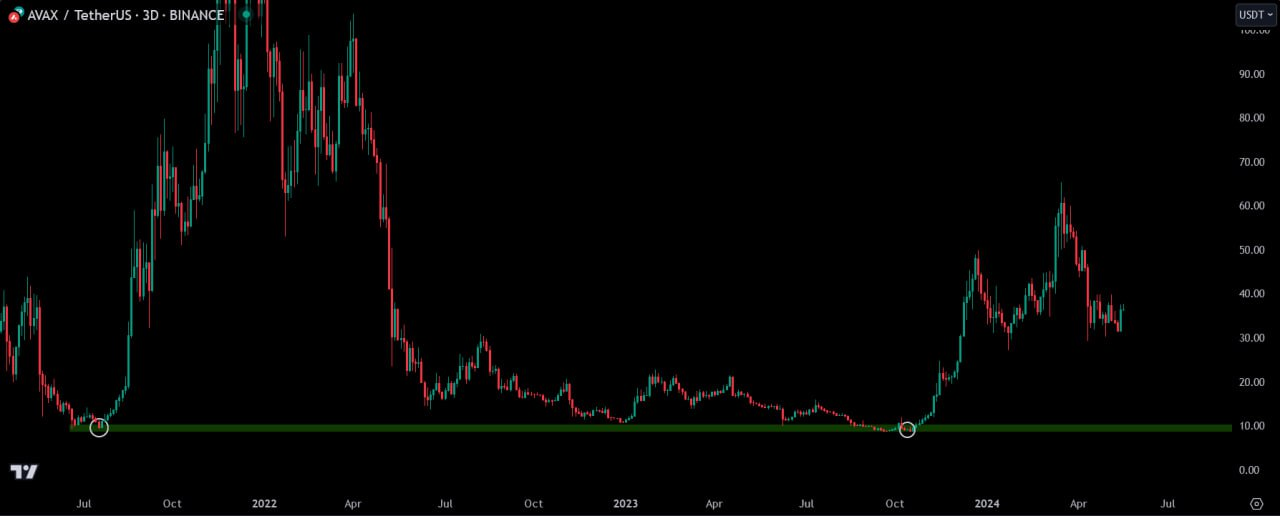
Retail🧠 gets rekt all the time. Whenever price approaches HTF demand, the move is institutional, not retail.
Check high-liquidity cryptos on Daily and Weekly. Whales cannot fill all their orders at once — that's why you'll see several double or triple tops/bottoms. They fill remaining orders once price returns to the level where they entered/exited in the past.
The lows: breaking below is "price discovery" paying only shorts.
If they are unable to find sufficient liquidity, they may need to adjust strategies. They must let price move away and then return to get the rest of their position entered:
Focus on ♨️Key Levels🗝️ at HTF Demand, lows of HTF range. Best R: R is there. 🔷Risk Reward
Demand in price discovery? Go study Trading 101/Supply & Demand. For potential supply (sell zones) for assets in Price Discovery, use negative fibs and trail positions below MTF/HTF key levels.
GALA 🎁 — no bodies at this Demand level, thus weaker than a demand with bodies:
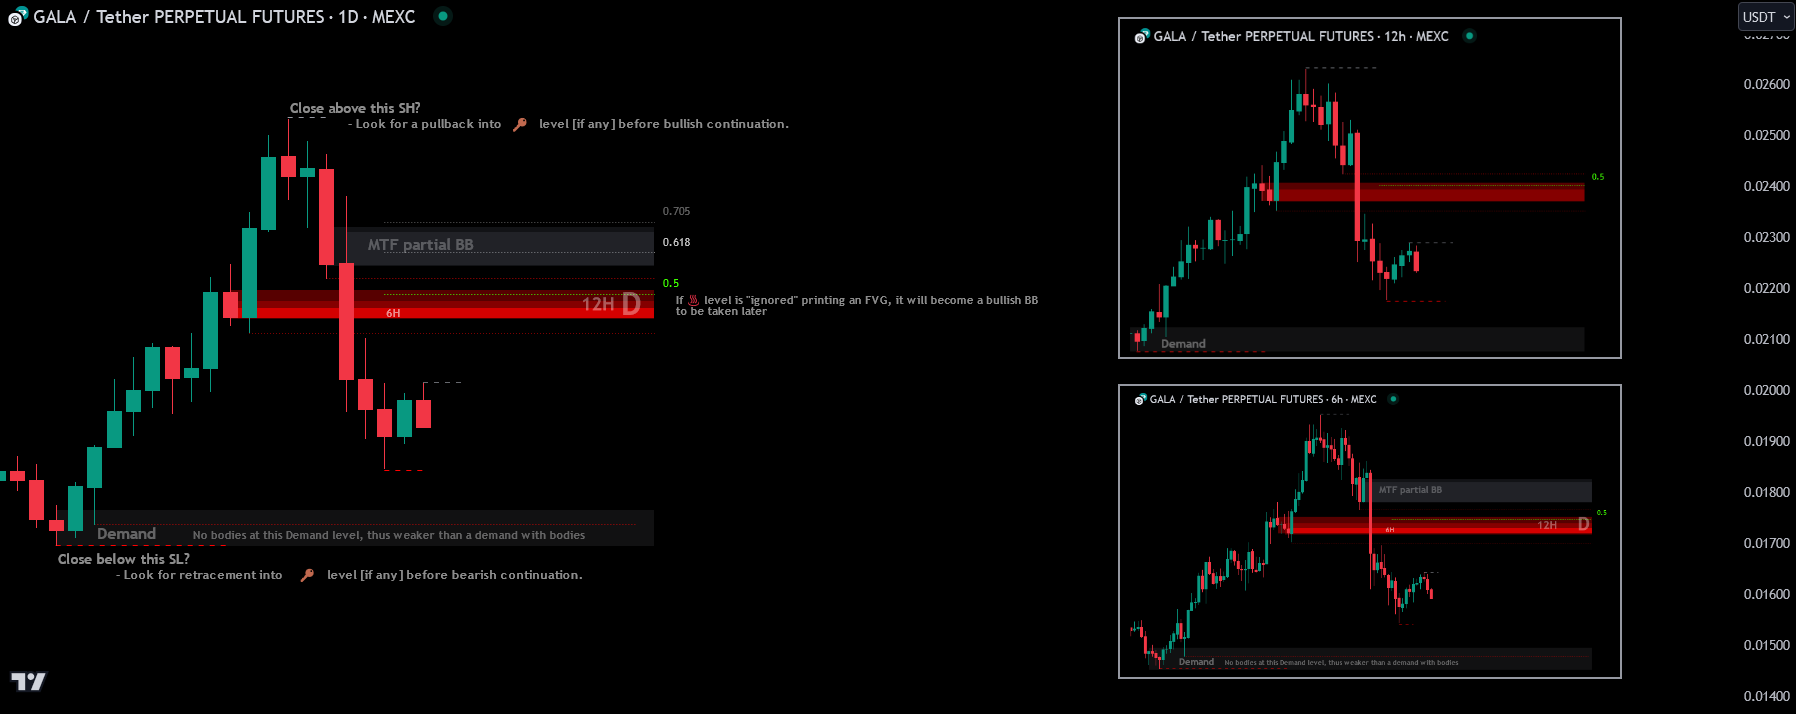
Whenever you see a Distribution / H&S formation + a Demand base below, you'll be right more often than not if bullish on the coin. Classic Market Maker Distribution pattern, hit to a very significant liquidity level, then 🚀:
Test and learn to spot these patterns by backtesting. These are clear MMs footprints — in some plays they have no chance to hide their intentions. The R: R is extremely good for spot traders as well.
Swing Low Demand
False demand — liquidity grab, fuel for the upswing:
ROSE AR at extreme discount of range — a buy if major charts MS isn't wrecked:
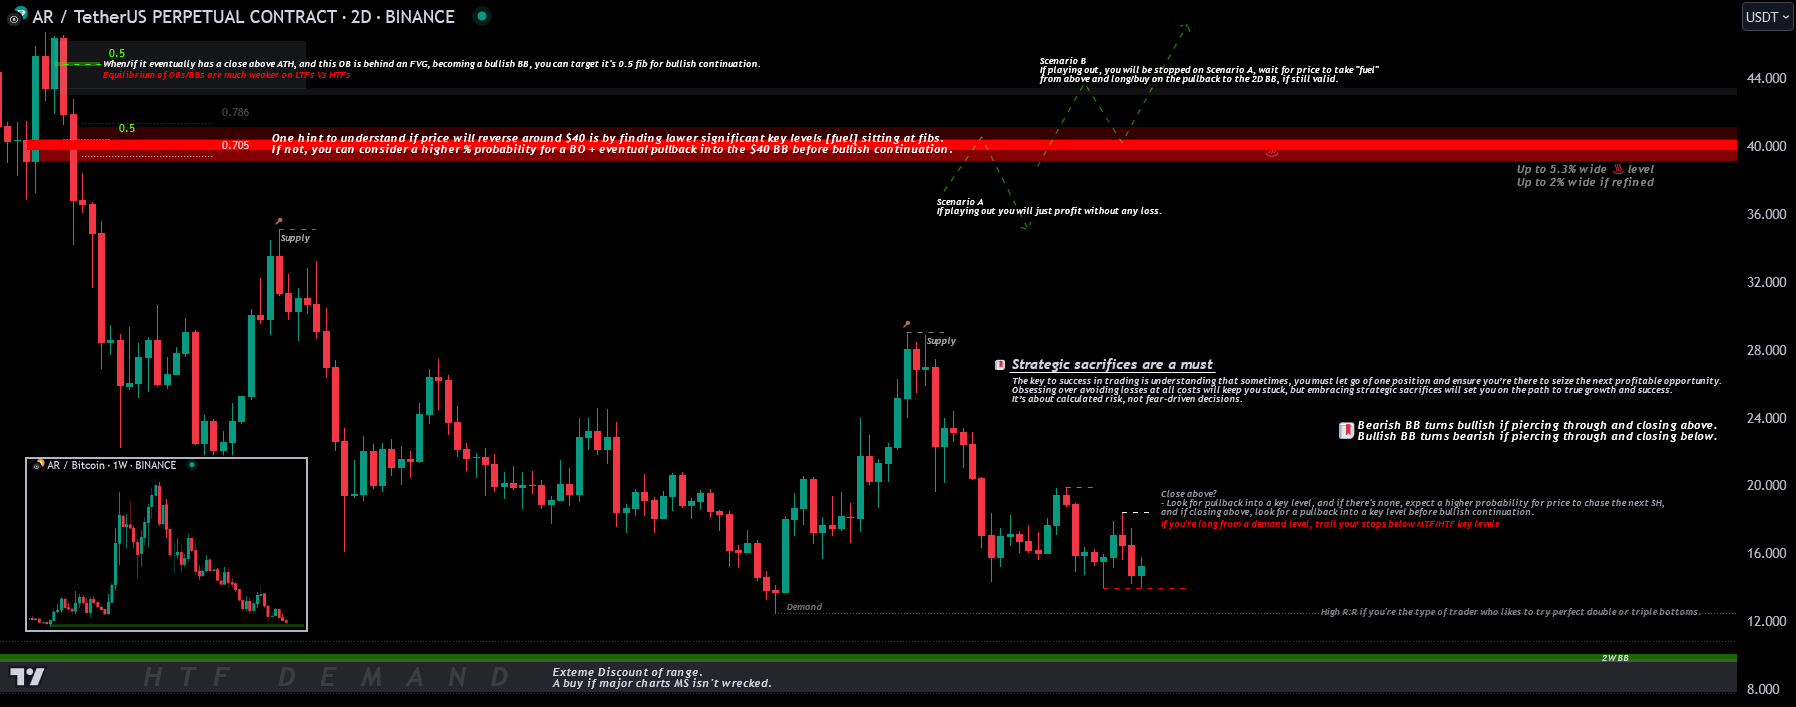

High RR if you're the type of trader who likes to try perfect double or triple bottoms. If you're long from a demand level, trail your stops below MTF / HTF ♨️Key Levels🗝️ — Trail Your SL.
Real demand level to look at:
Real demand level (later example):
Examples of Swing Low Demand levels:
- SNX Feb 26, 2024
- BTC Mar 16, 2024
- BTC Dom Mar 7, 2024
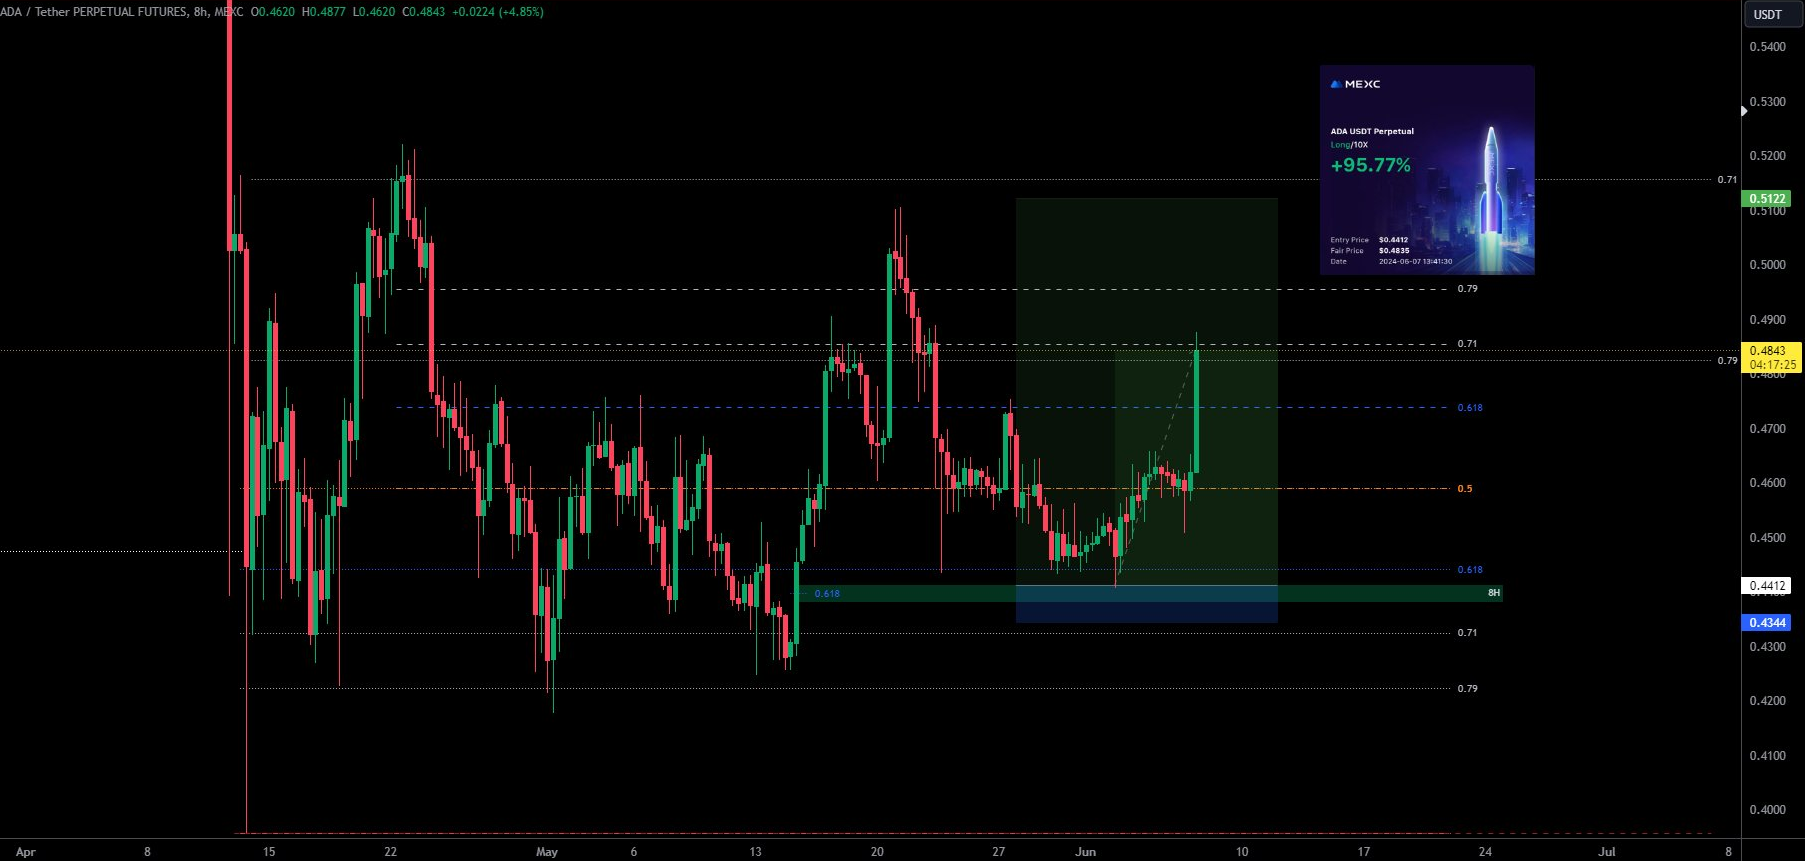
- ADA Jun 7, 2024
Double bottom at demand:
WBB and ETH double-bottom queue:
It will eventually take the whole WOB, then double-bottom. Any ⚡️ with bodies closing above WOB is a nice confirmation price's likely to go up.
More #demand Examples
Key demand level:
CRV at $0.50, long re-entry context:

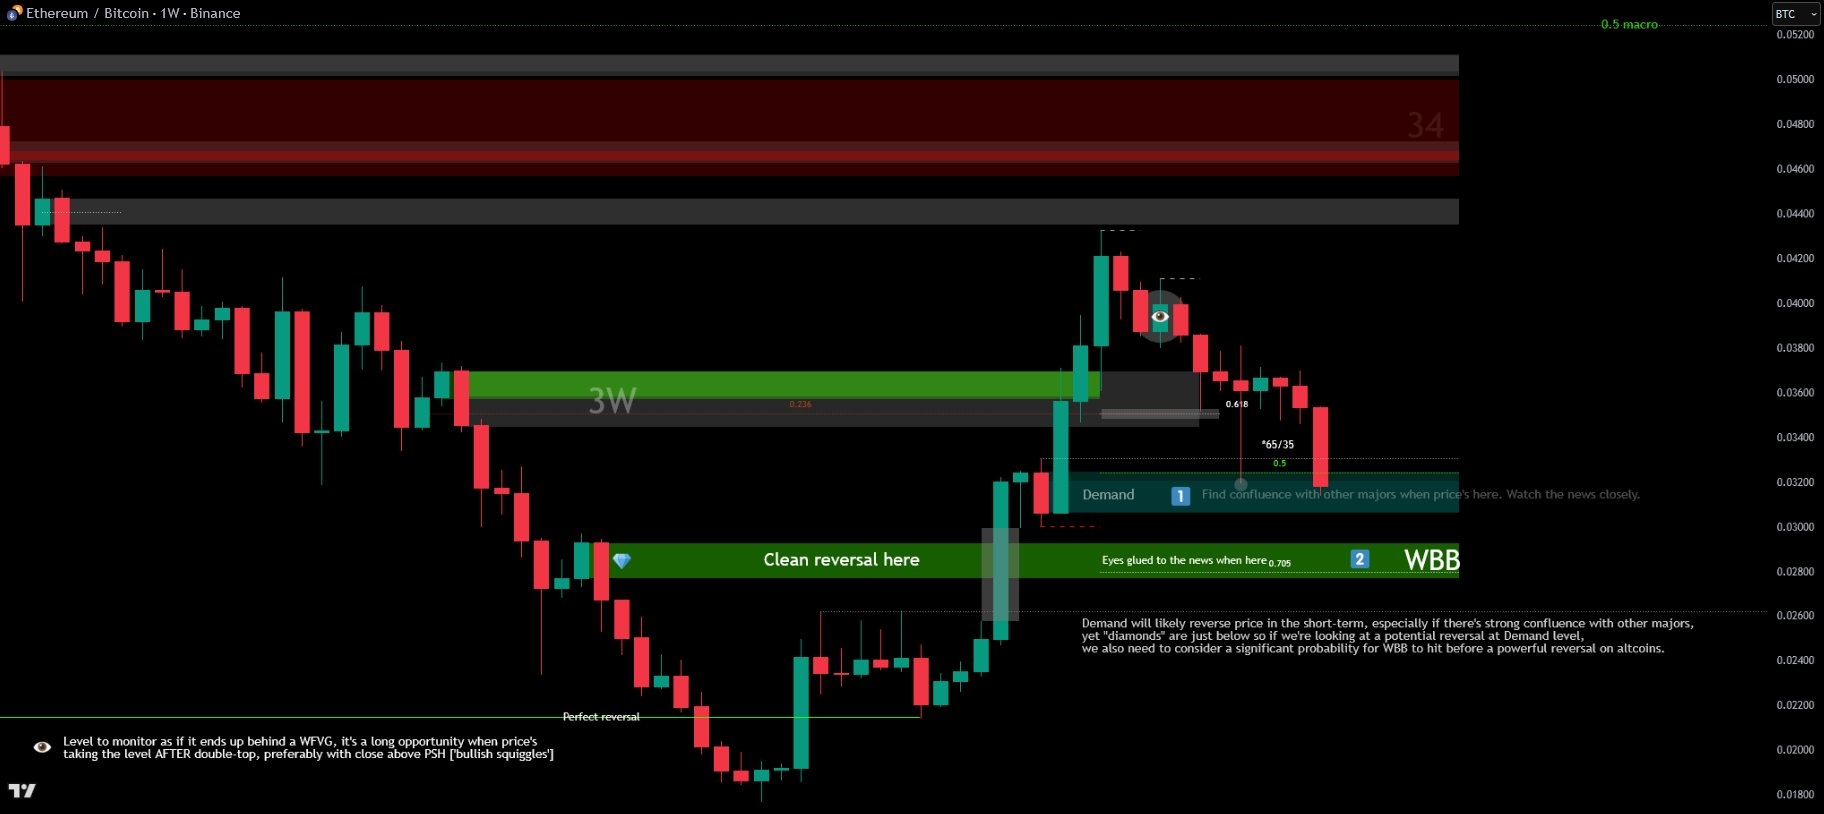
ETH/BTC — demand will likely reverse price in the short-term, especially with strong confluence with other majors. Yet 'diamonds' are just below, so consider significant probability for WBB to hit before a powerful reversal on altcoins:
TSLA Decoded — Why Whales Take Years
The setup shared on April 21st:
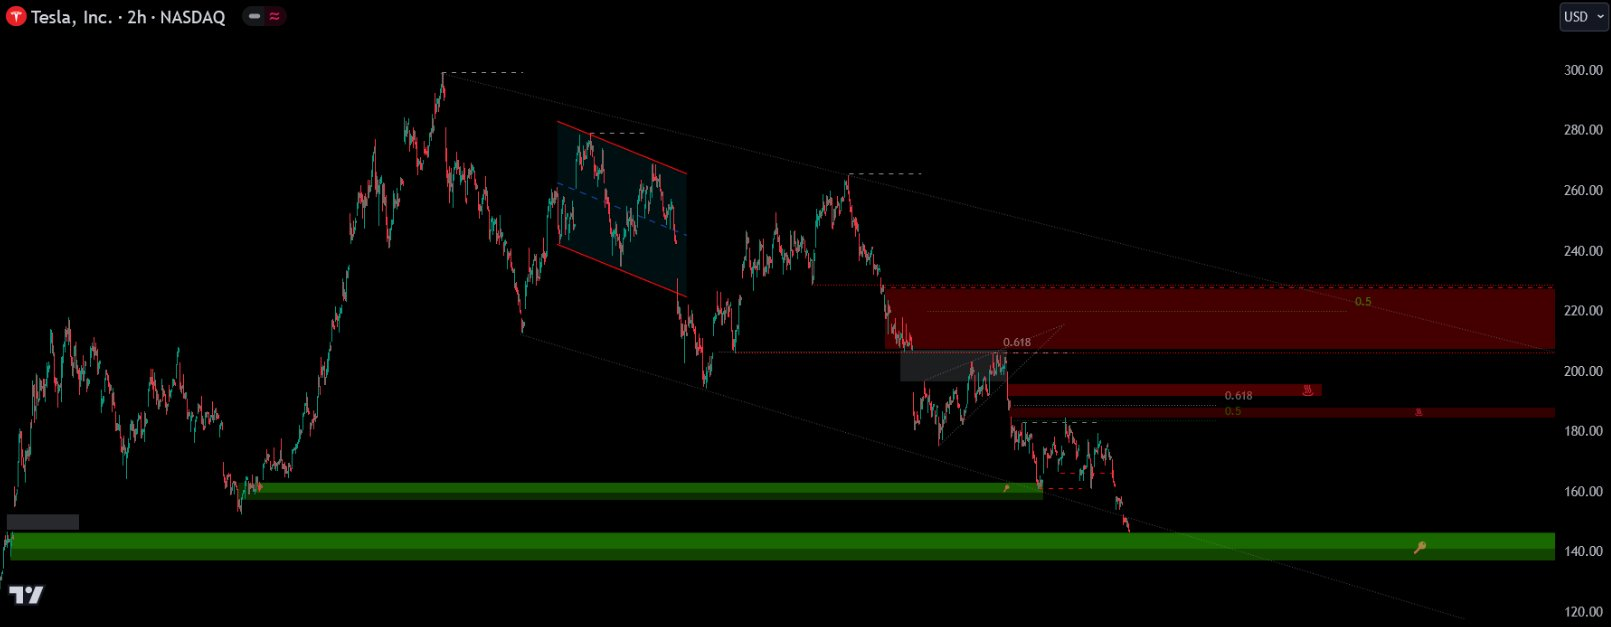
Waiting for a November 2020 weekly demand level hidden through 2 weekly FVGs that hadn't been tested for nearly 4 years:
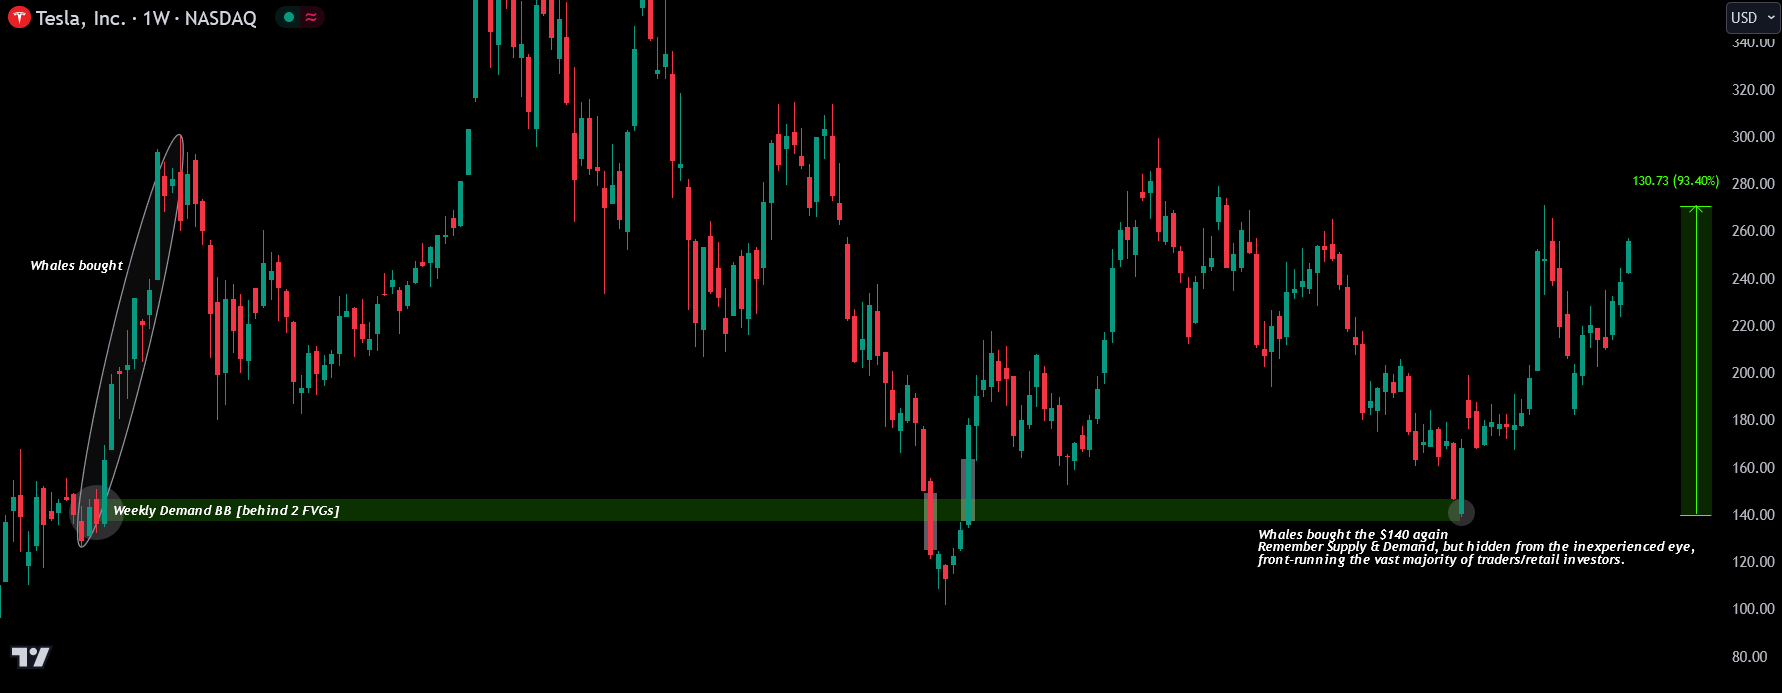
Remember 💎Supply & Demand Trading principles. Whales always buy or sell at major reversal levels where they've previously placed orders, filling any remaining ones. If you look at FX markets, it can take as much as 10 years for major supply or demand levels to be reached before a powerful reversal occurs.
The outcome:
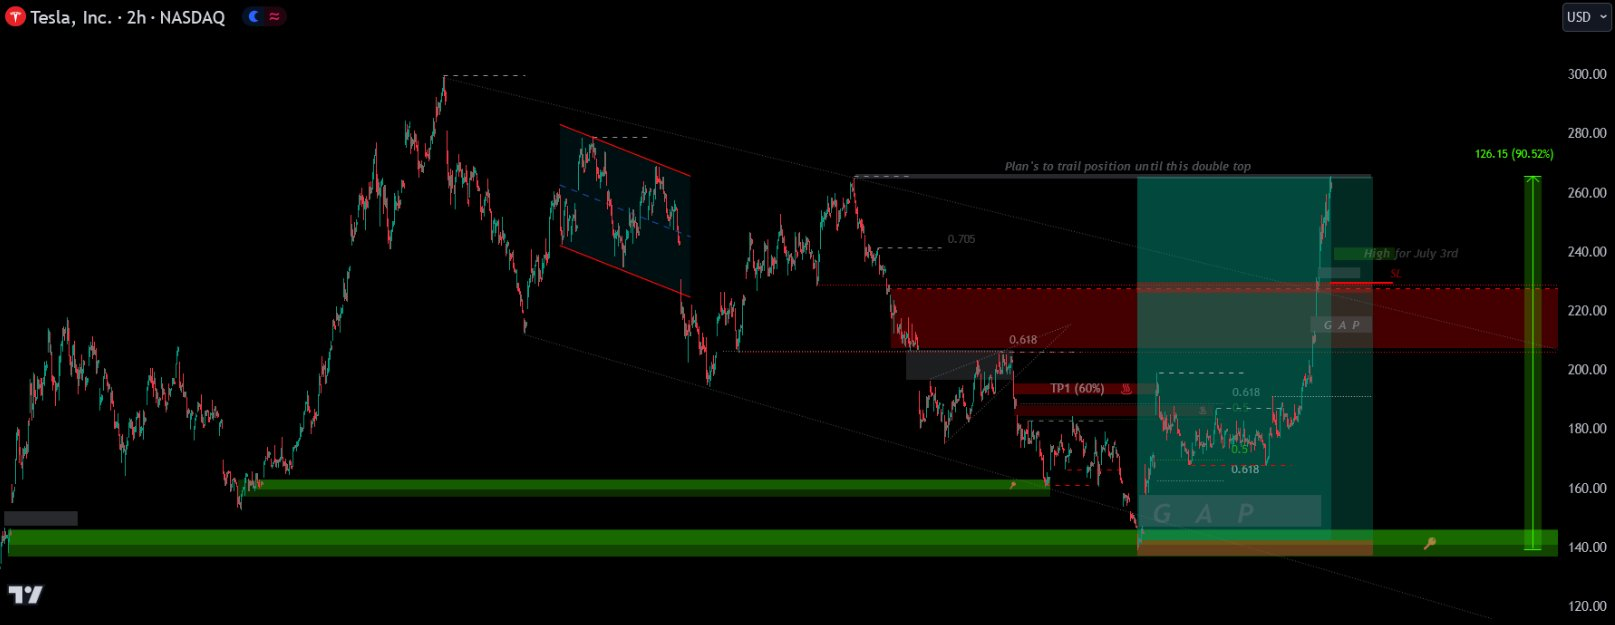
These FVGs aren't "later gaps" — they're marked imbalances, and the move is whale-driven because retail can't print such large moves in fat instruments. There are hundreds of similar opportunities still to play out.
TRB and Block Validity
TRB — is it better to mark this on Weekly TF rather than 4D since there's not a single body on the weekly block?
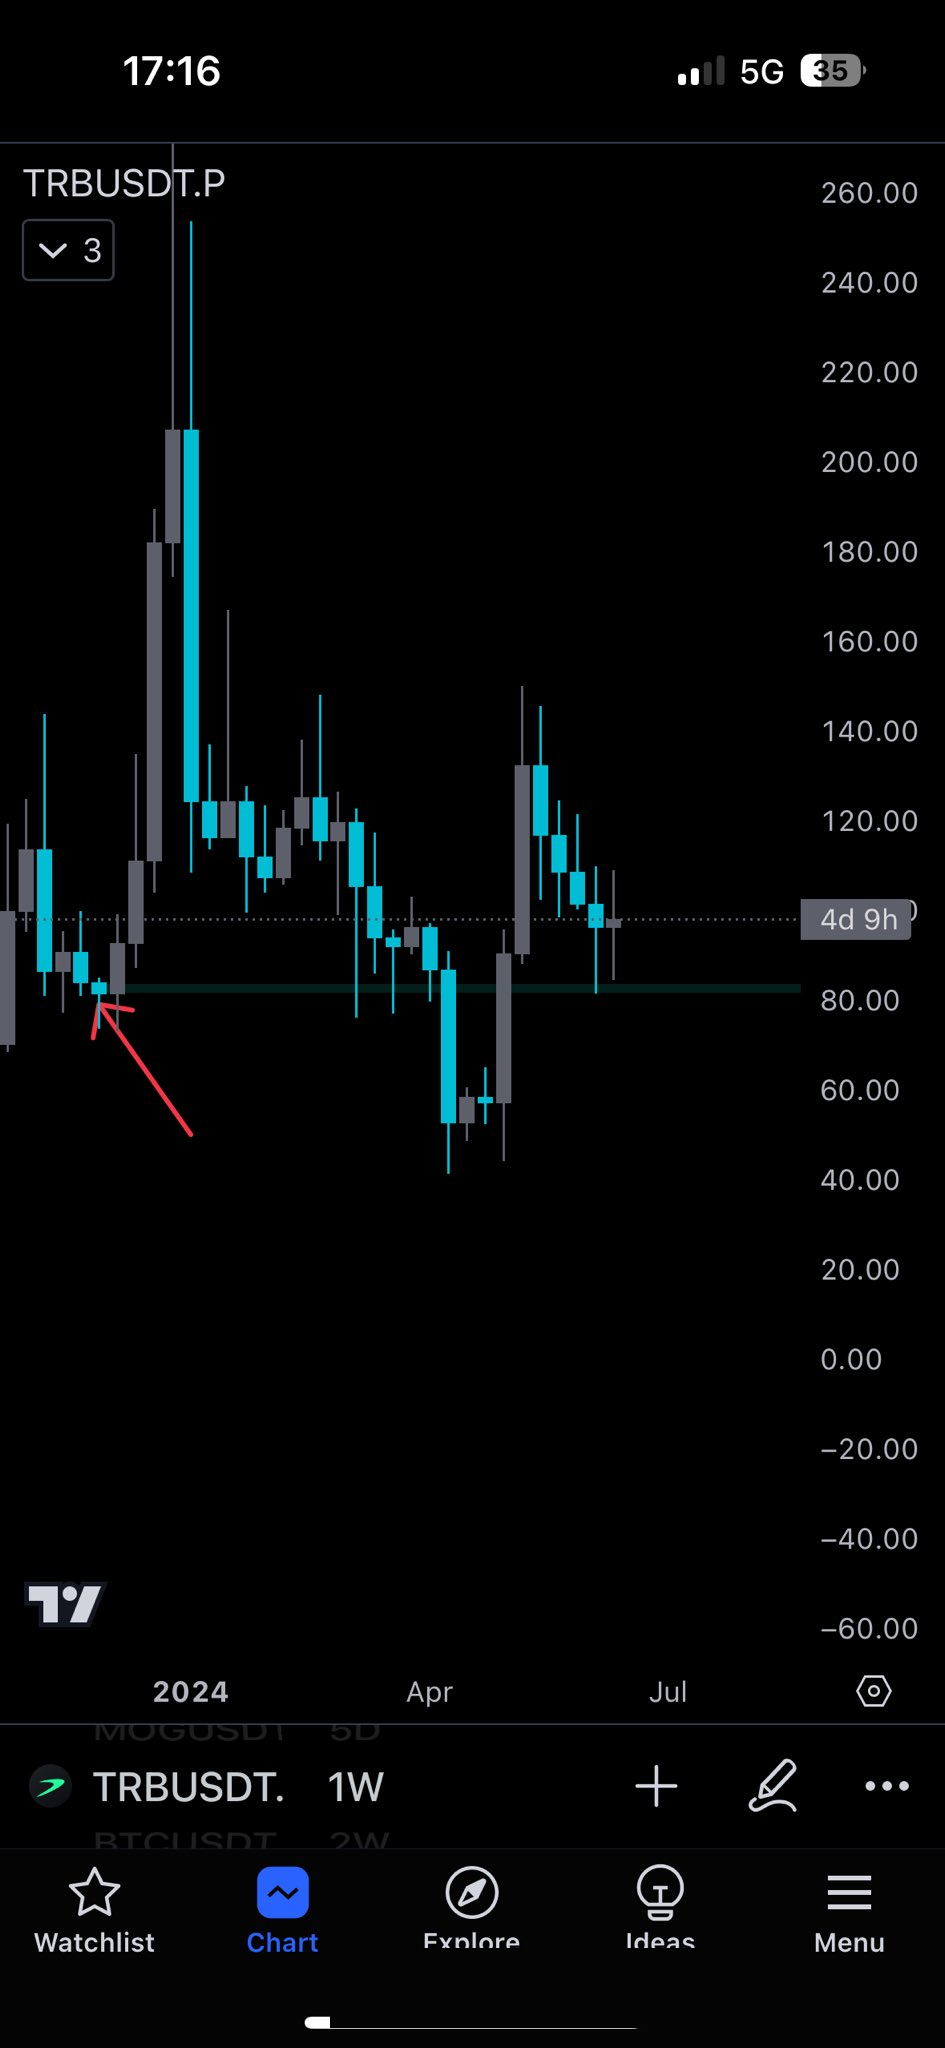
No. Weekly block taken — there are wicks taking it. Body closes matter when closing above or below an SH or SL. Lower TF candle bodies can take liquidity even when HTF bodies haven't.
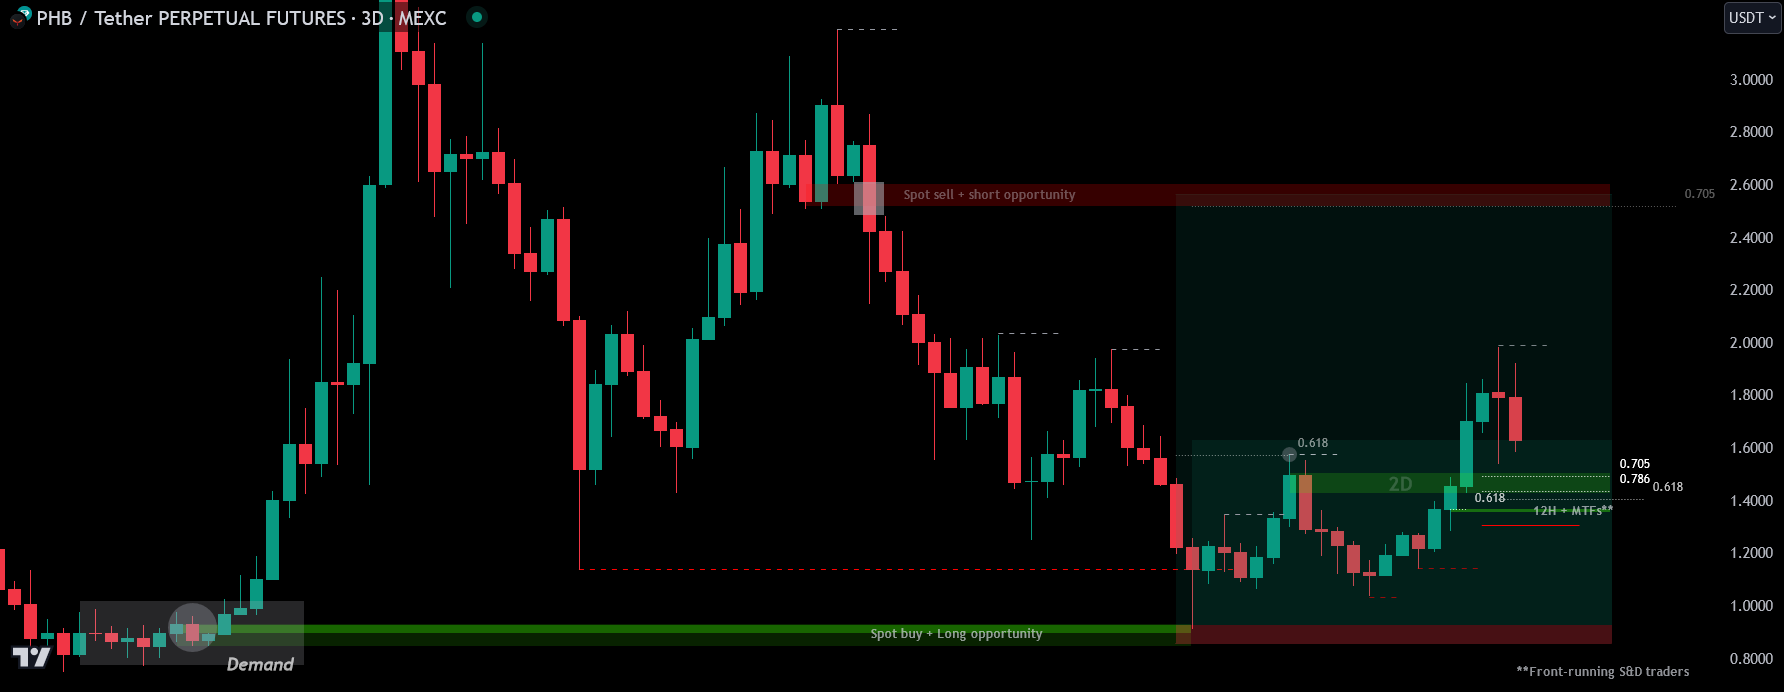
PHB — couple of key levels should hold if BTC's above $57,500:
ADA at $0.44ish was a powerful key reversal level — why?
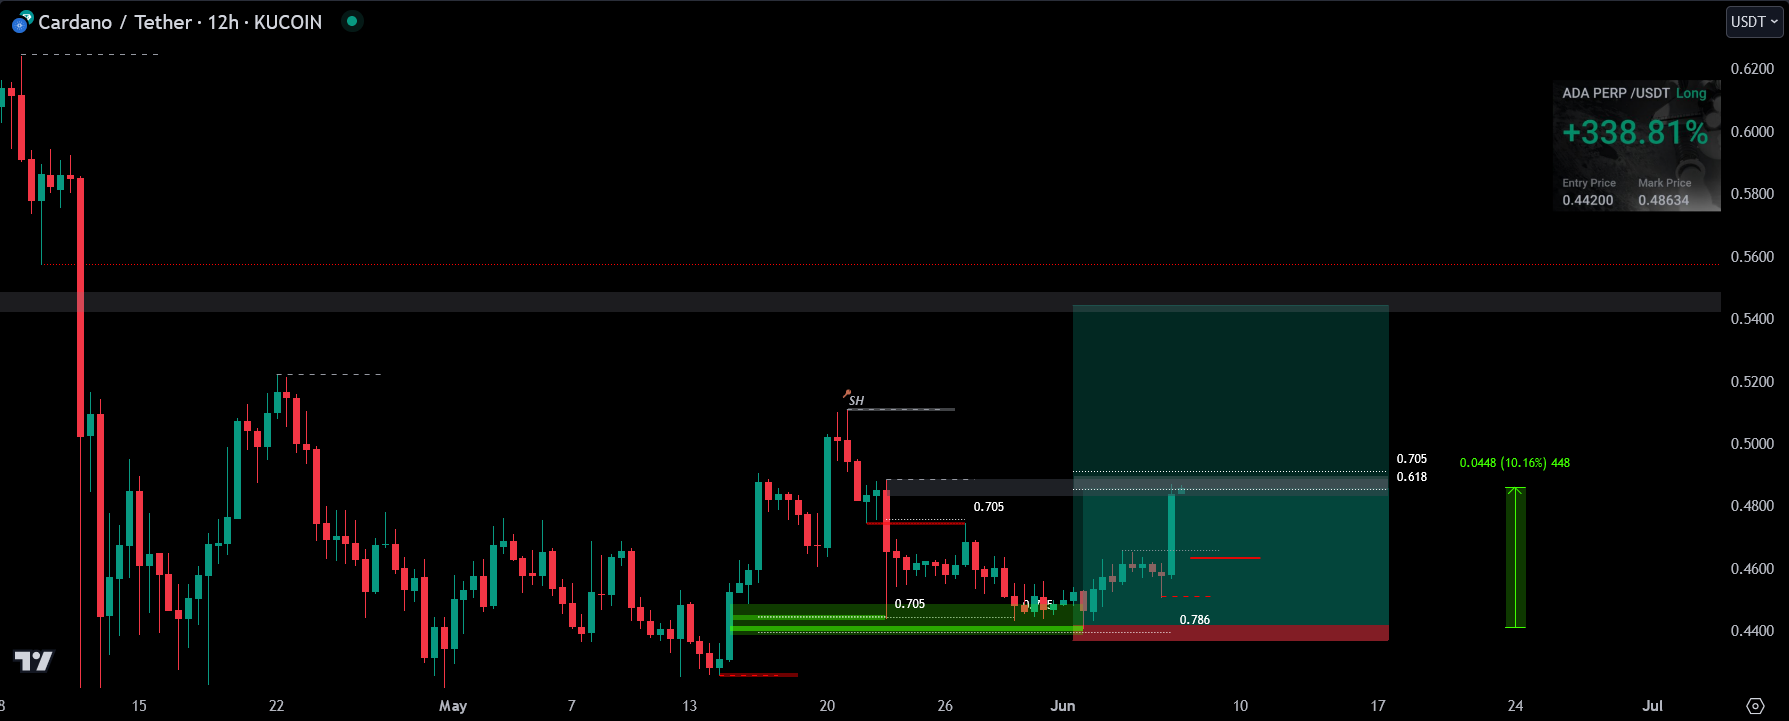
HL behind two FVG + 0.618 fib:
Forget Doji, hammers, shooting stars, hanging man, marubozu, dragonfly. Learn the real craft. There's a FVG on several TFs. Demand wasn't taken because it's where retail traders place buy/long orders and get front-run — now chasing on horrible R: R. S&D traders front-run.
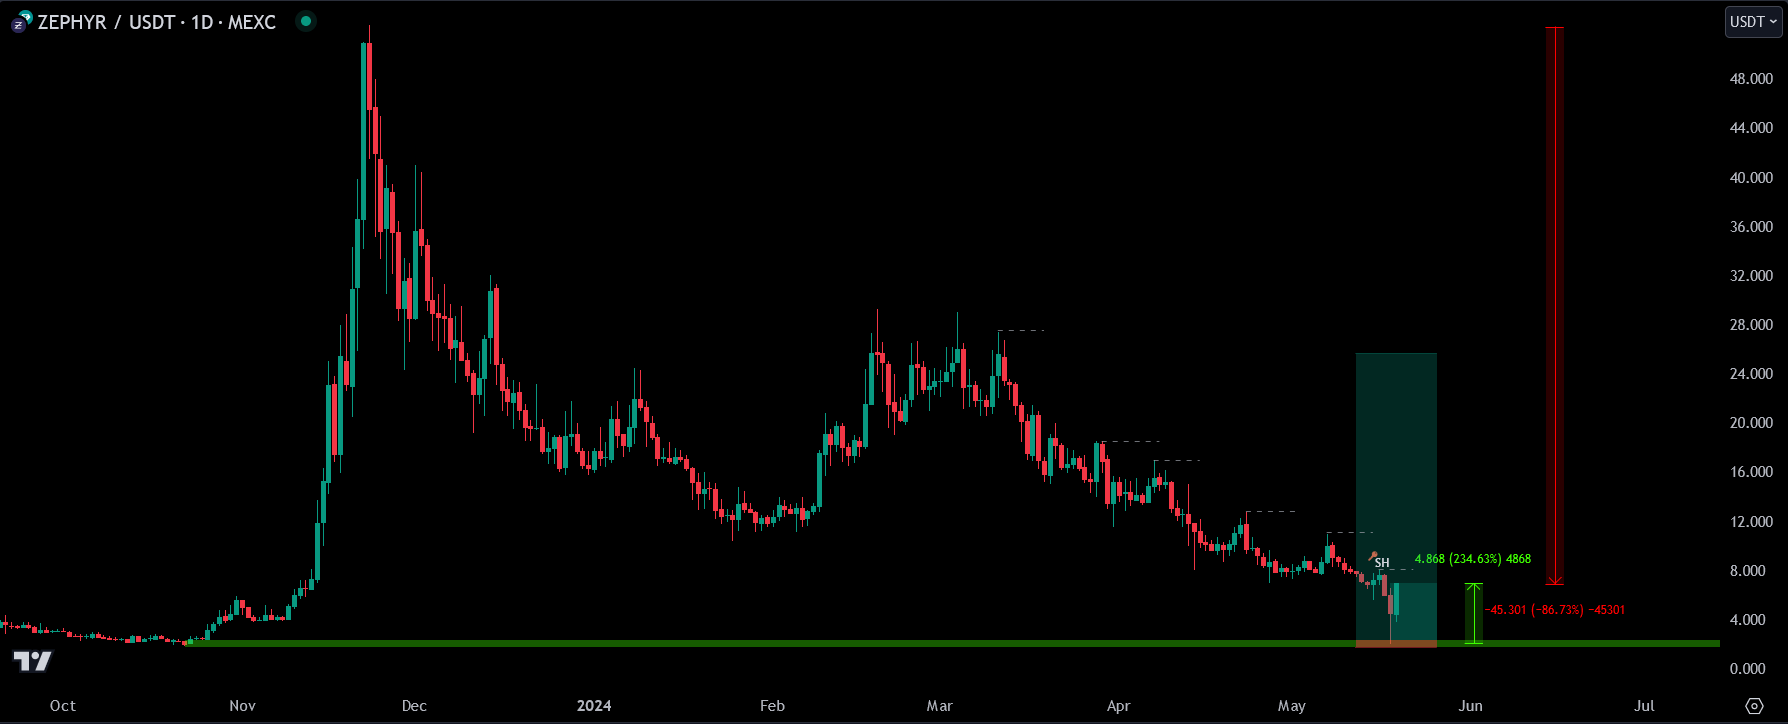
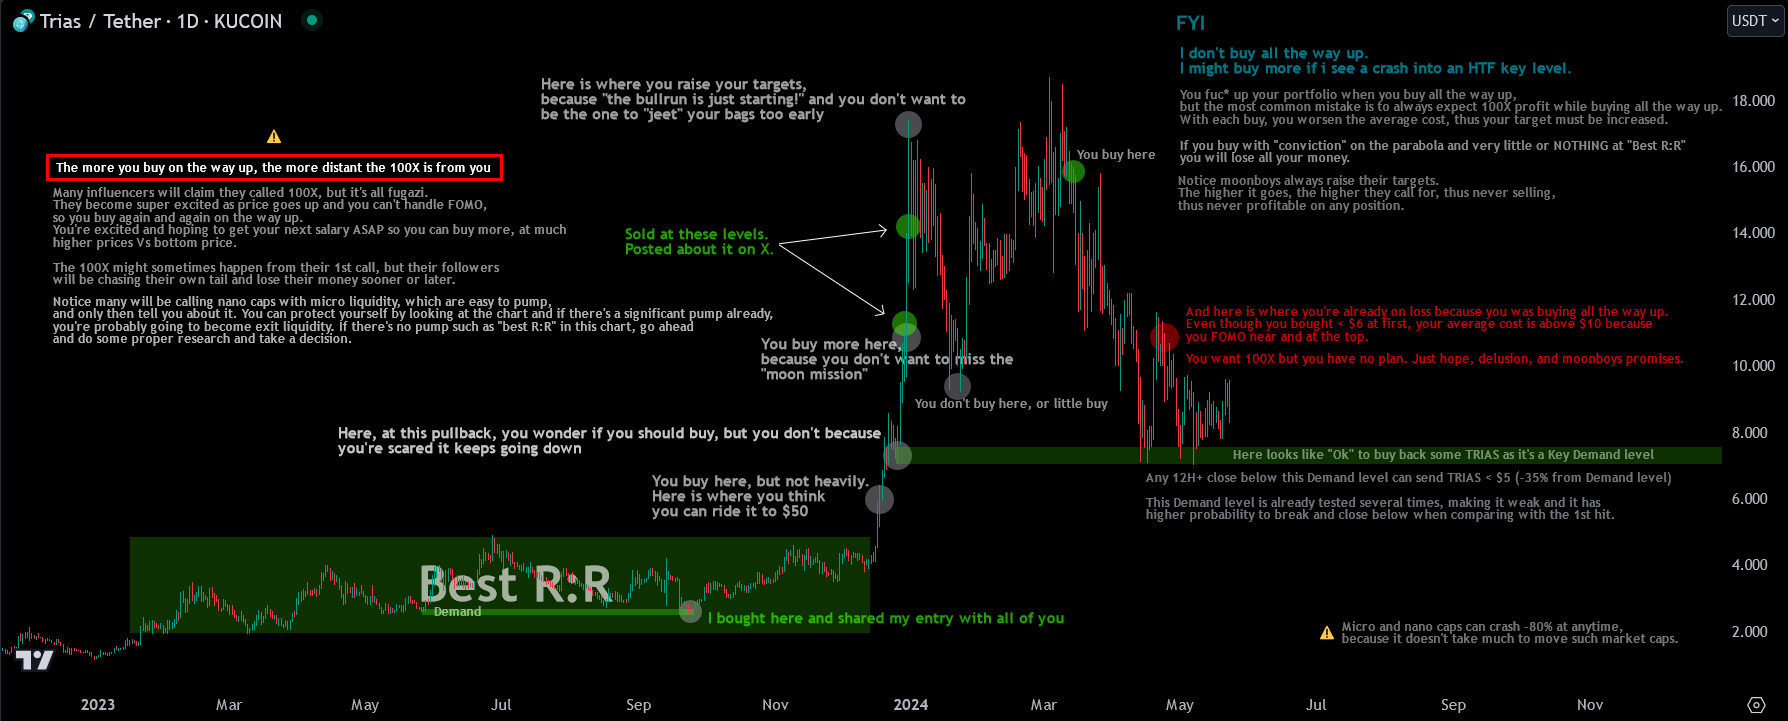
ZEPH HTF demand reversal into 200%+ pump — anyone equipped with 🎁Supply & Demand knowledge was on the right side. You find the opportunity, profit, then run as far as you can with the profit, otherwise you might just round-trip as all 💎🙌 do.
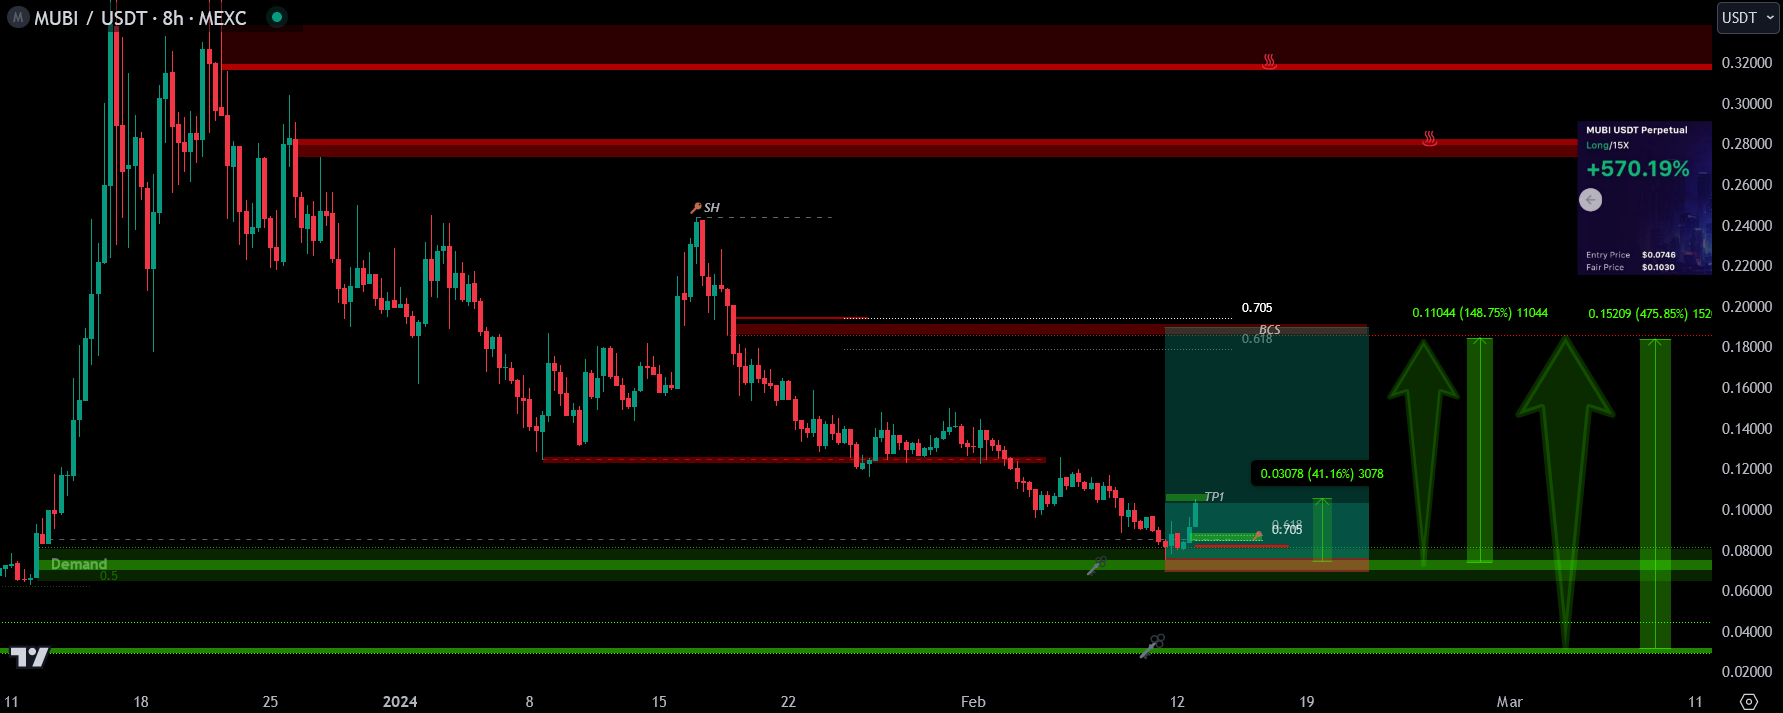
$MUBI — TP1 (35%) ✅, SL above BE and below key level:
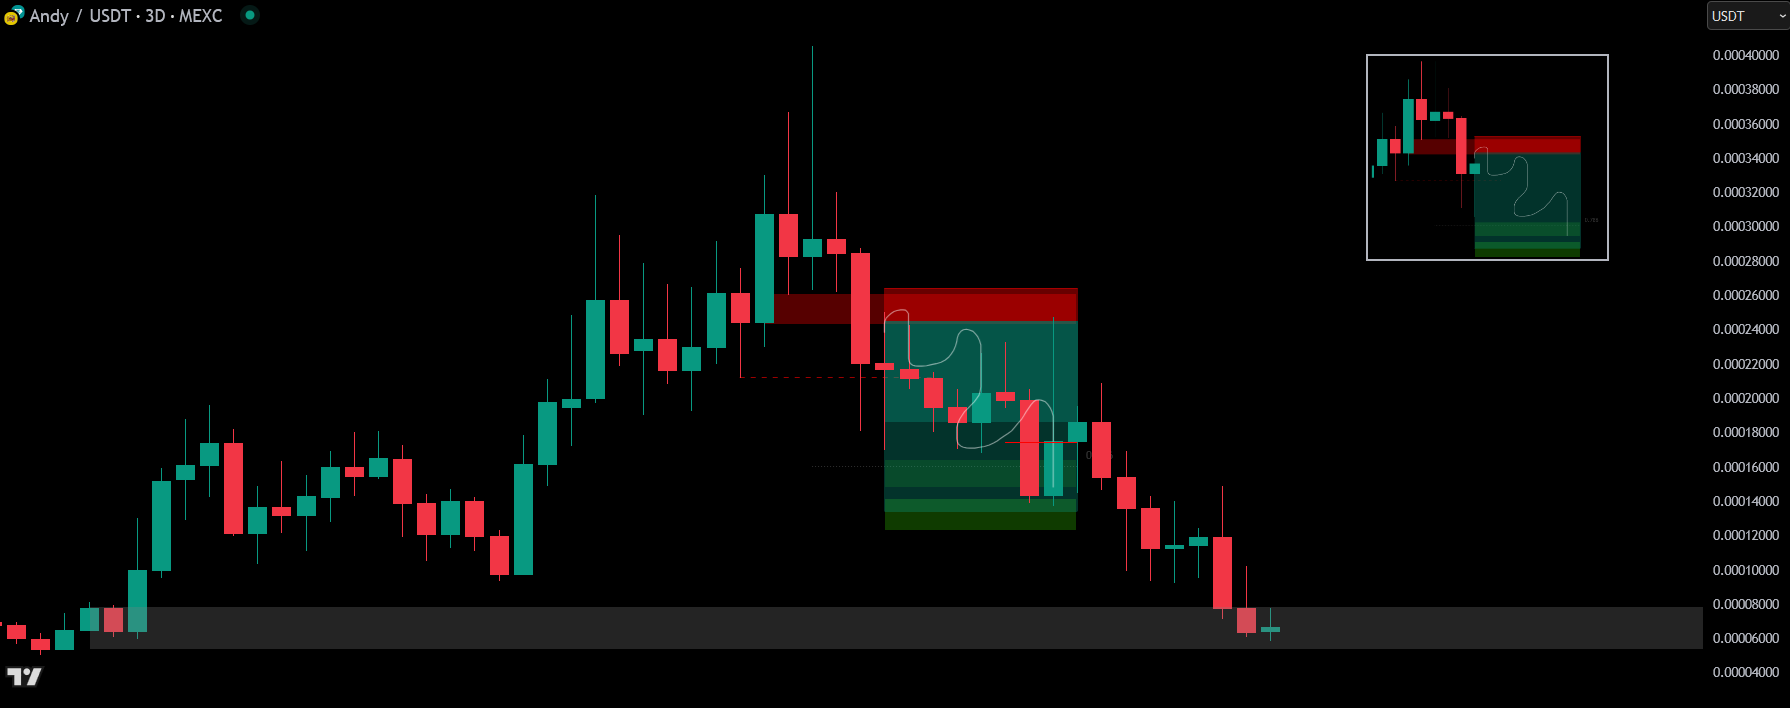
ANDY example — spotted that 3D BB targeting the green levels (PBBs above HTF demand). It hit the 3D BB, dropped into the weekly PBB & 3D BB, retested the 3D bearish BB, went no higher. Result: another -85% crash in two months. At HTF demand, if you believe in the project, this is the kind of level where buying makes sense — but not with a "moon" target, rather for liquidity in HTF premium, if any exists.
You can apply the same analysis to any coin using 🎁Supply & Demand principles, though nano caps, micro caps, and small caps come with added risks: more erratic PA, easier manipulation, higher risk of exploits. With micro caps, the blueprint exists but execution risk is significantly higher.
The market doesn't care about promises, narratives, or hype. TA remains King.
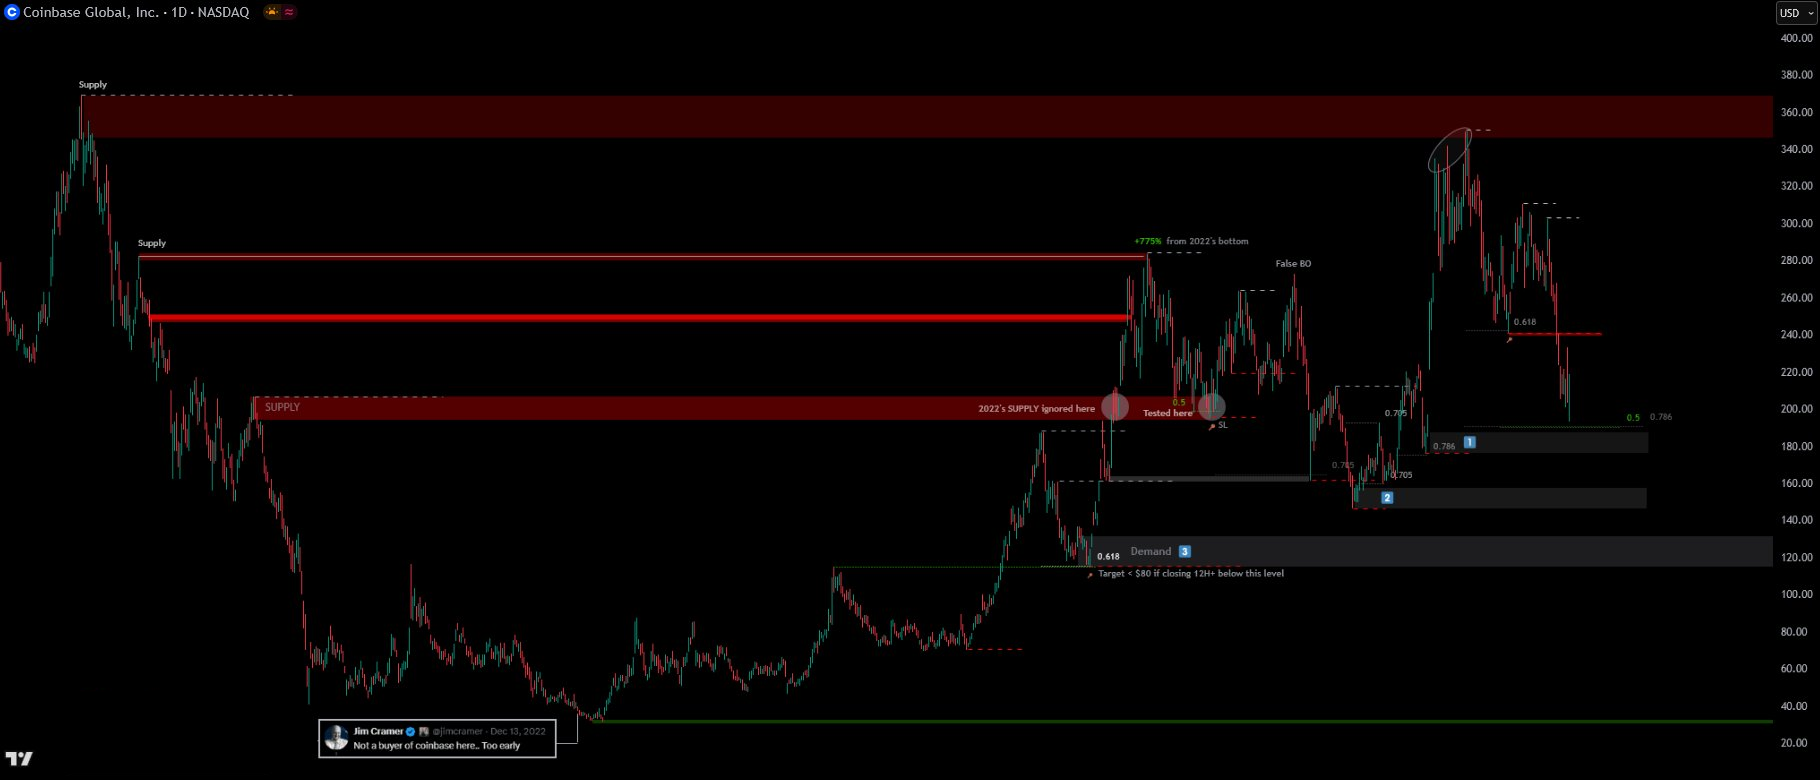
COIN — pay attention to levels 1, 2, and 3. Each represents Demand, but not of the same magnitude. The impact of news will vary depending on which level price interacts with:
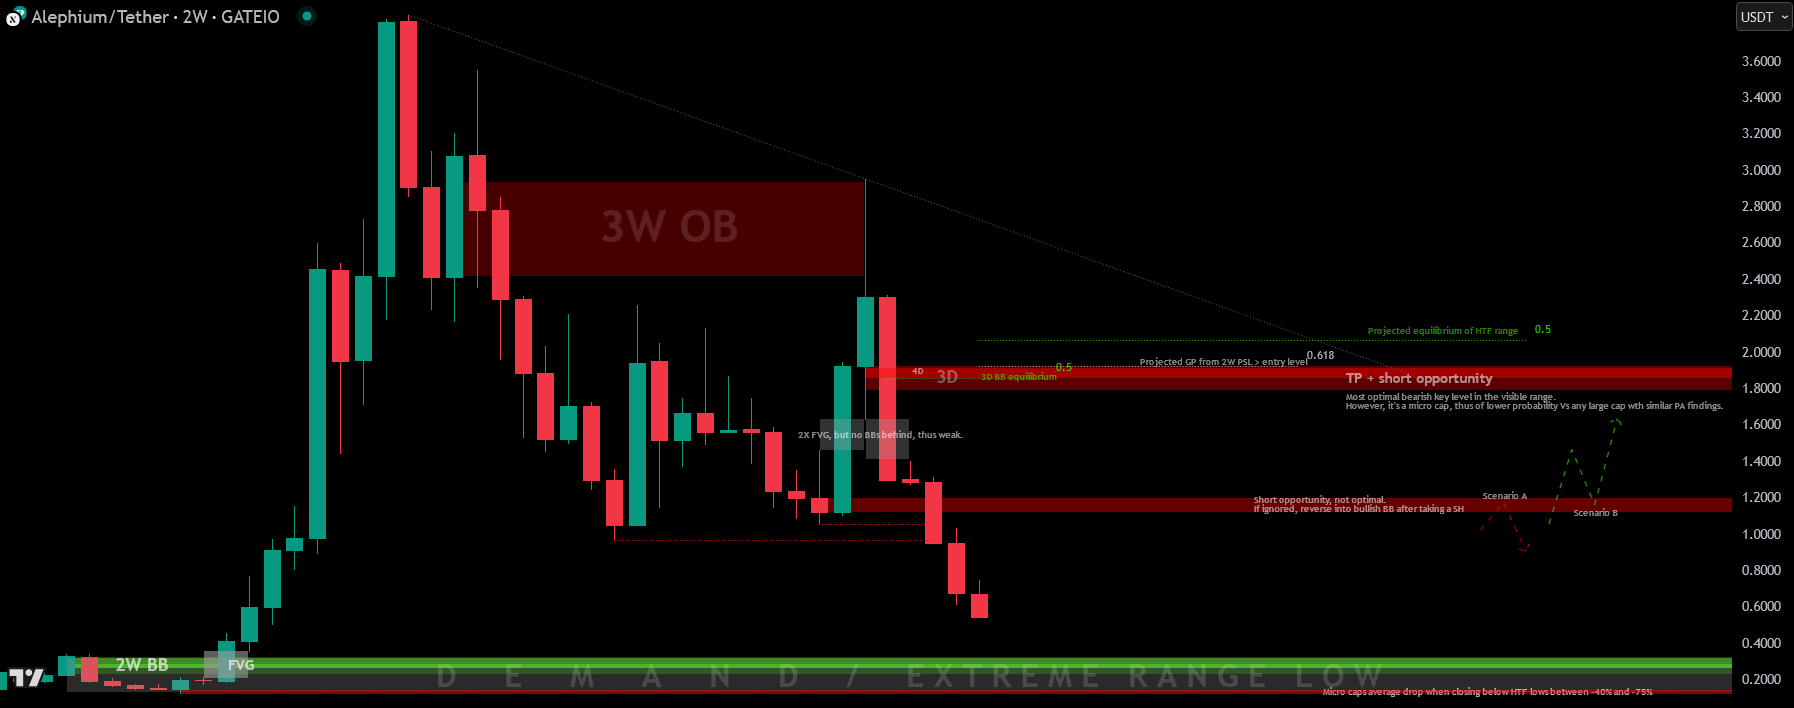
ALPH:
ORDI:
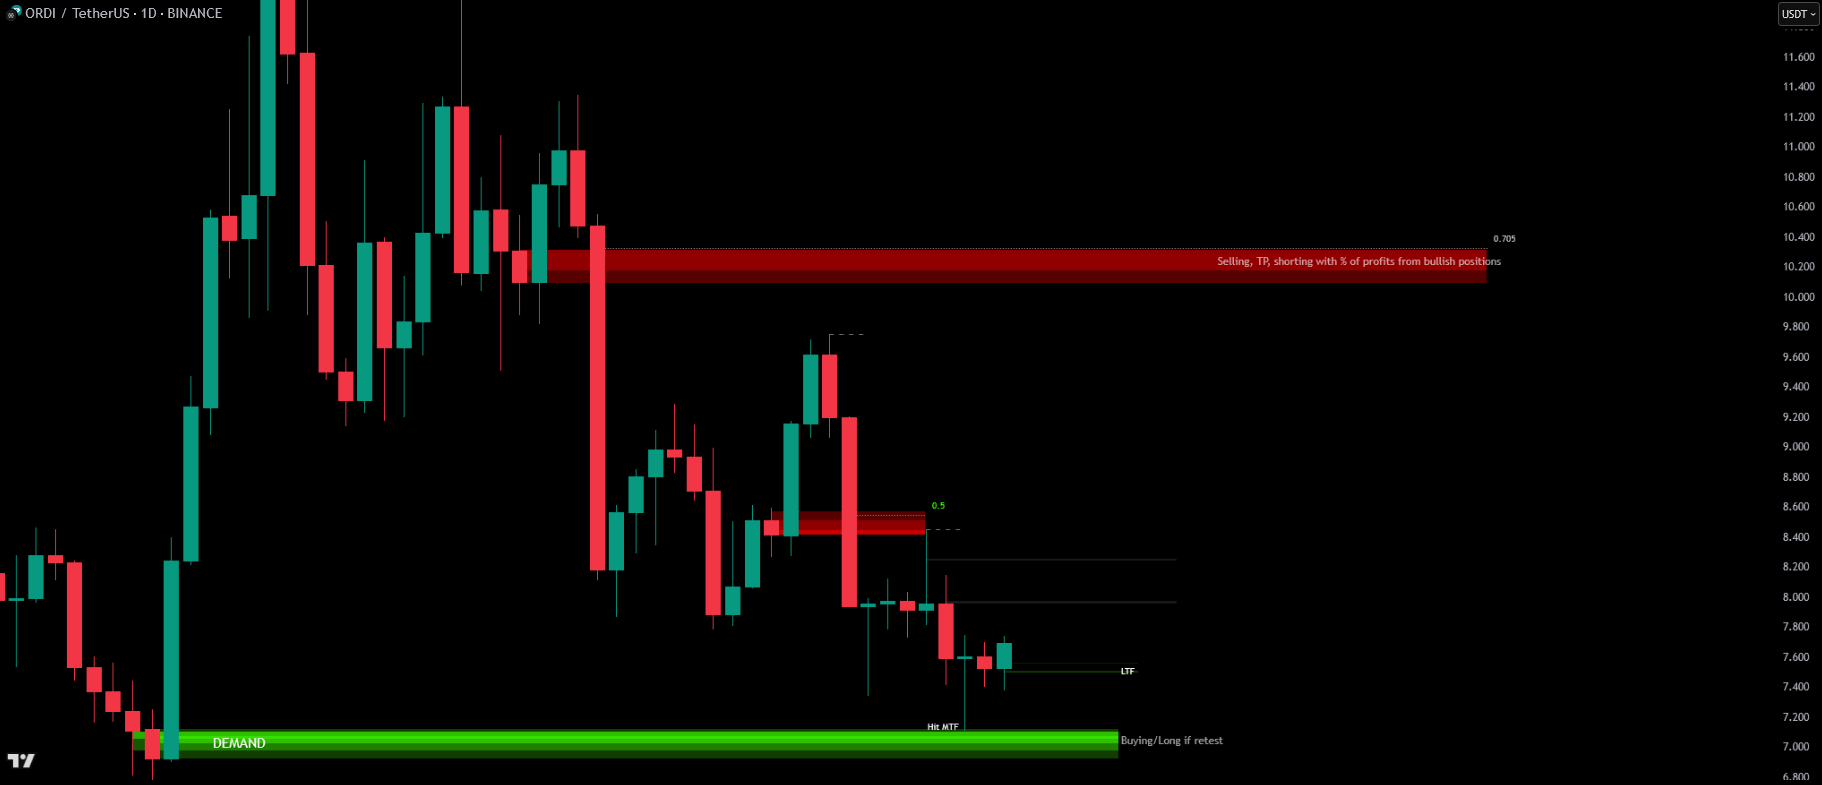
Key level for a new ATH — ideally closing above + pullback into liquidity before continuation:
Don't fly blind:
Another viewpoint to really solidify this
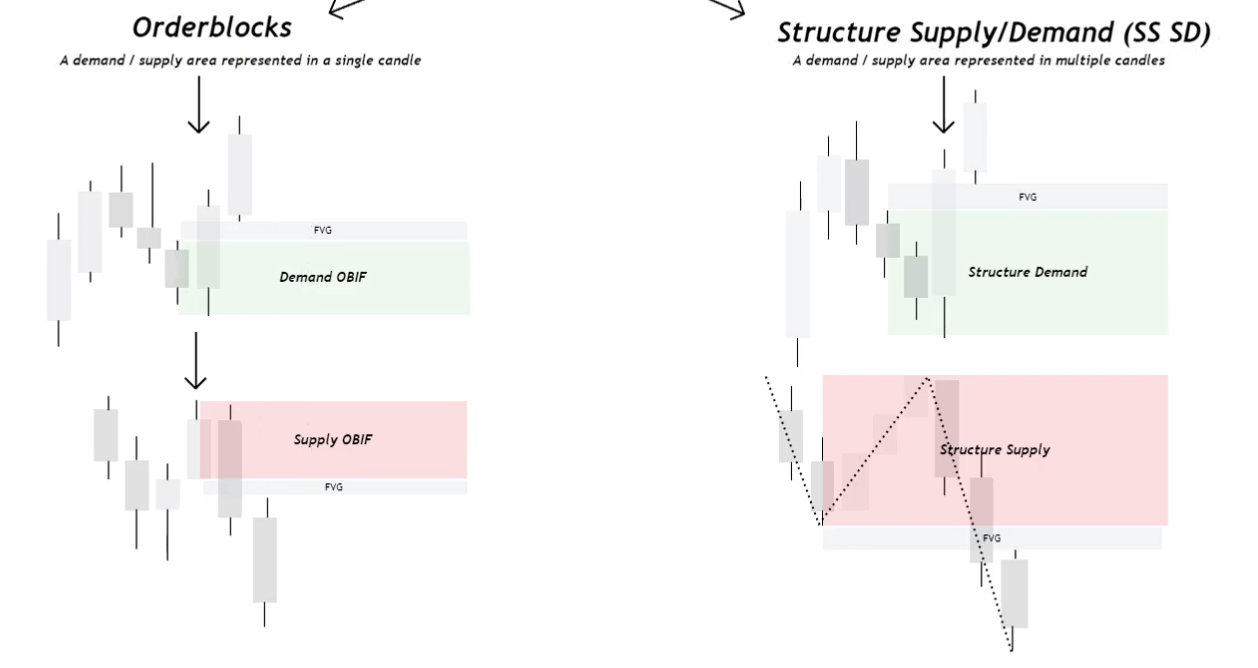
There are two main types of S&D zones:
- Order Blocks (OB)
- Structure Supply & Demand
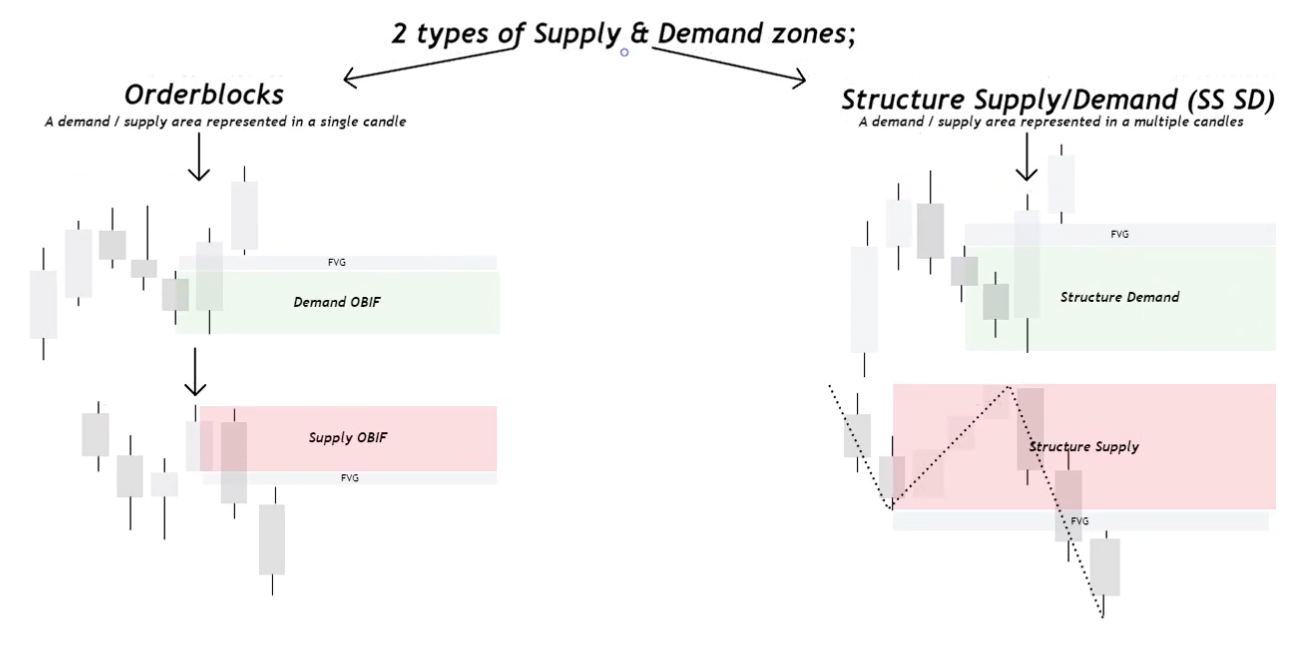
Order Blocks (OB)
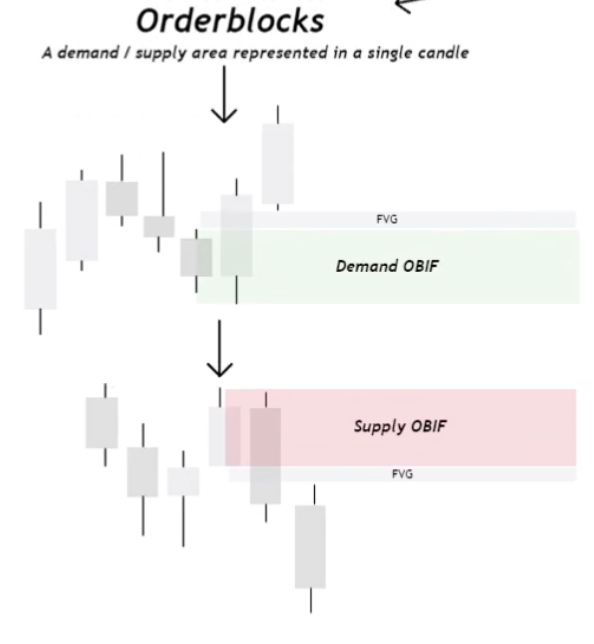
Represented by a single candle:
- Bullish OB: the last bearish candle before an expansion upward.
- Bearish OB: the last bullish candle before a bearish expansion.
To be a valid OB, it must:
- Be followed by a strong expansion.
- Leave behind a Fair Value Gap (FVG).
- FVG definition: a price imbalance where the wick high of the 1st candle and the wick low of the 3rd candle don't overlap, creating a gap (inefficiency).
- The OB itself includes wick high and wick low of the qualifying candle.
- If there's no FVG, there's no order block.
Why it works: the market seeks to fill inefficiencies. Once filled, price often reacts sharply away from that zone, making OBs highly effective. Only OBs that leave behind a FVG are drawn — call this OBIF (Order Block with Inefficiency).
Structure-Based Supply & Demand
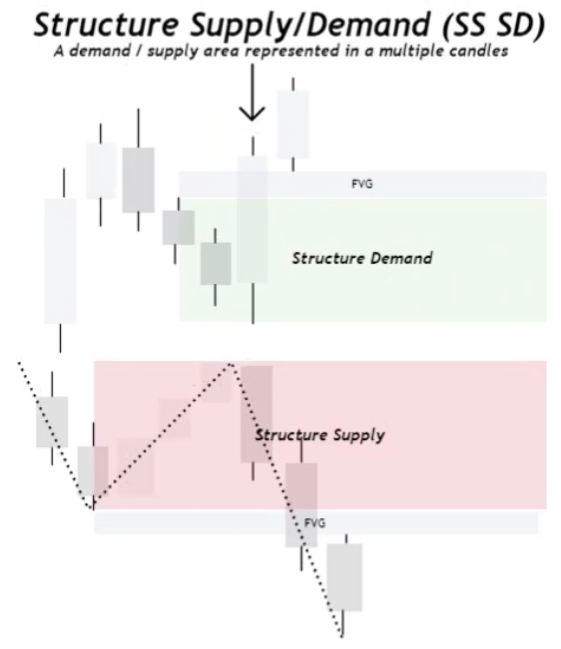
Represented by multiple candles, drawn from a structure move (e.g., a pullback before expansion). Still must include an FVG to be valid.
In an uptrend: identify the last down candles before expansion upward — draw from high to low of the range, including FVG. This forms structure demand.
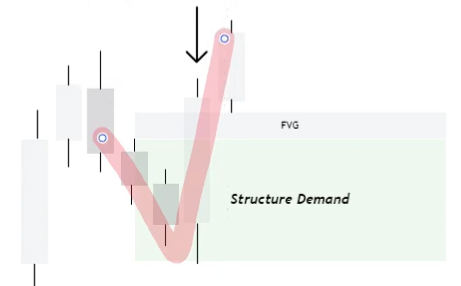
In a downtrend: use the last upward move before the drop — forms structure supply.
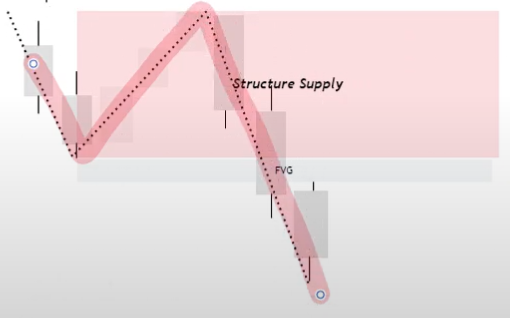
FVG must be included for both. These zones are called structure-based because they follow market structure (LH–LL or HH–HL sequences).
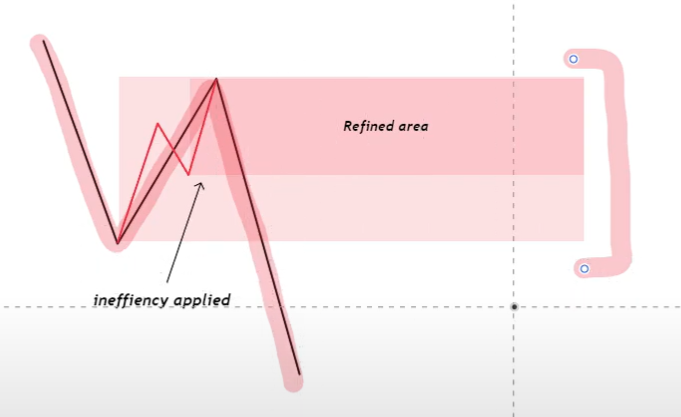
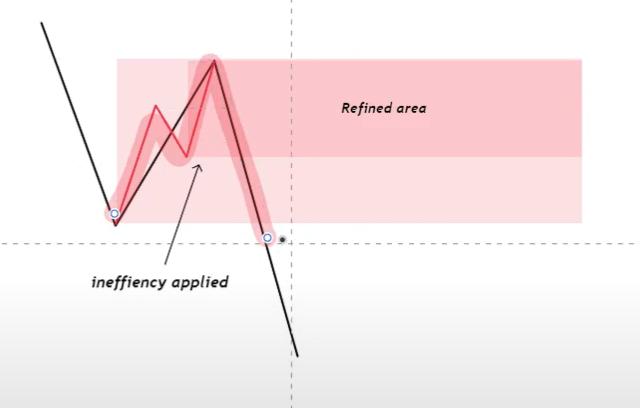
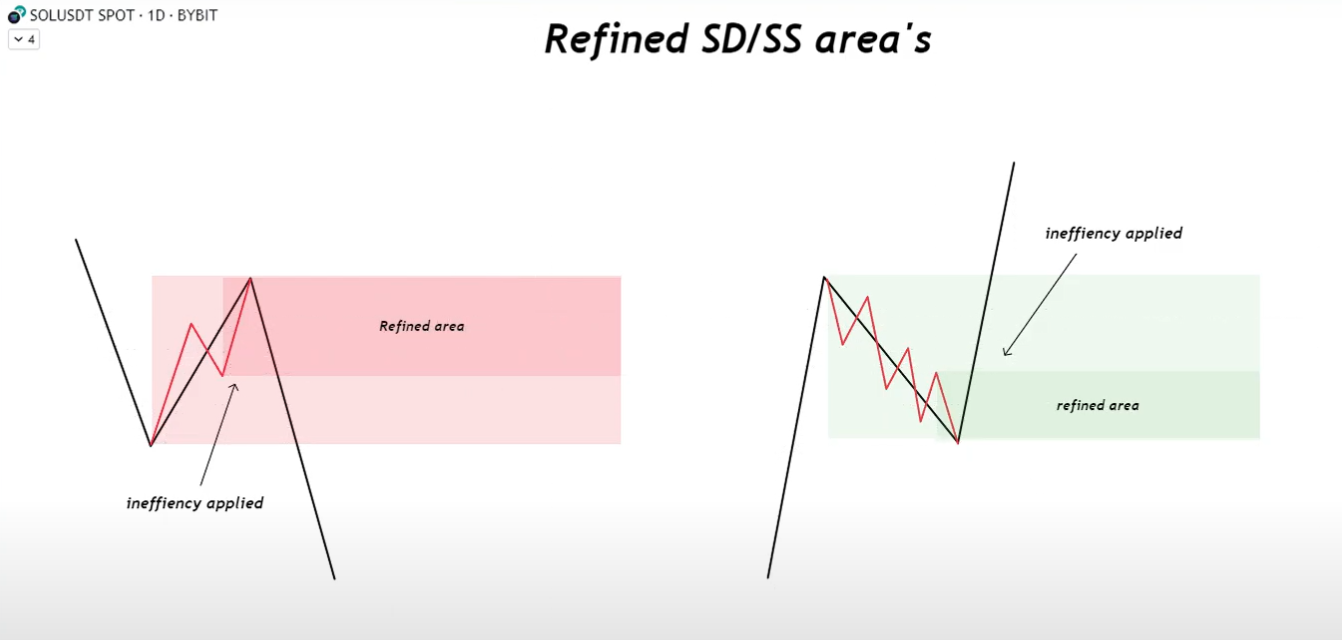
Combining Macro and Refined Zones
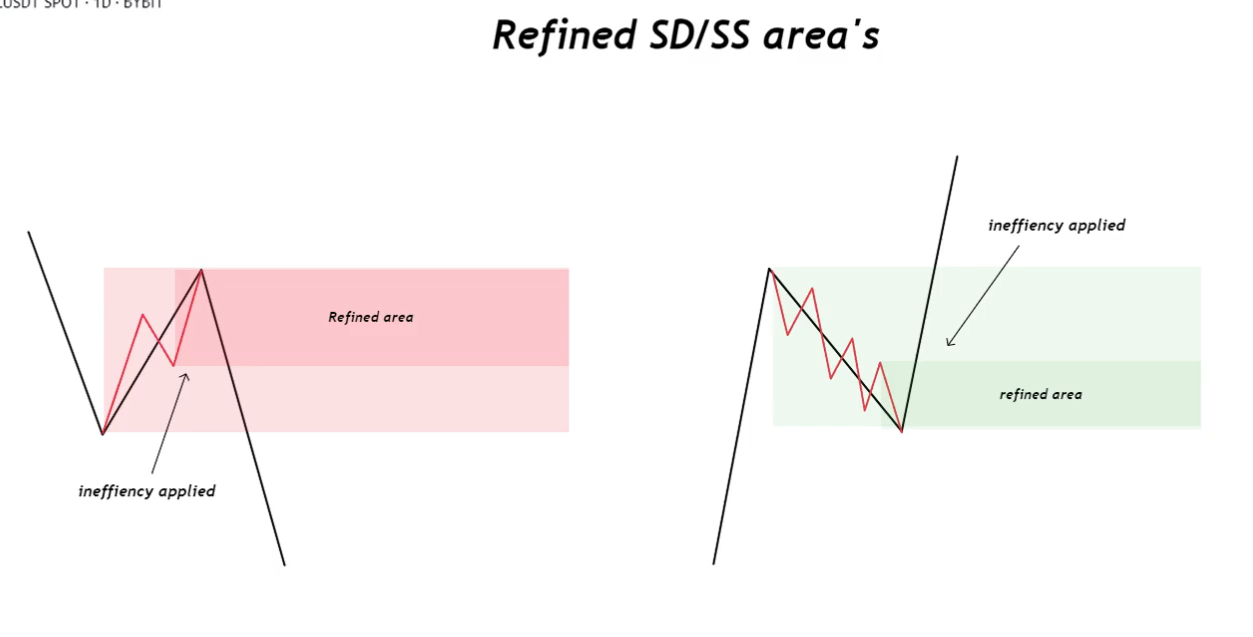
Multiple overlapping zones often coexist:
- One from the macro trend (broader range).
- Another from a lower timeframe structure (more refined).
Both are valid. Wait for confirmations in these zones — don't trade blindly off reaction.
Range supply:
Refined structure from lower TFs:
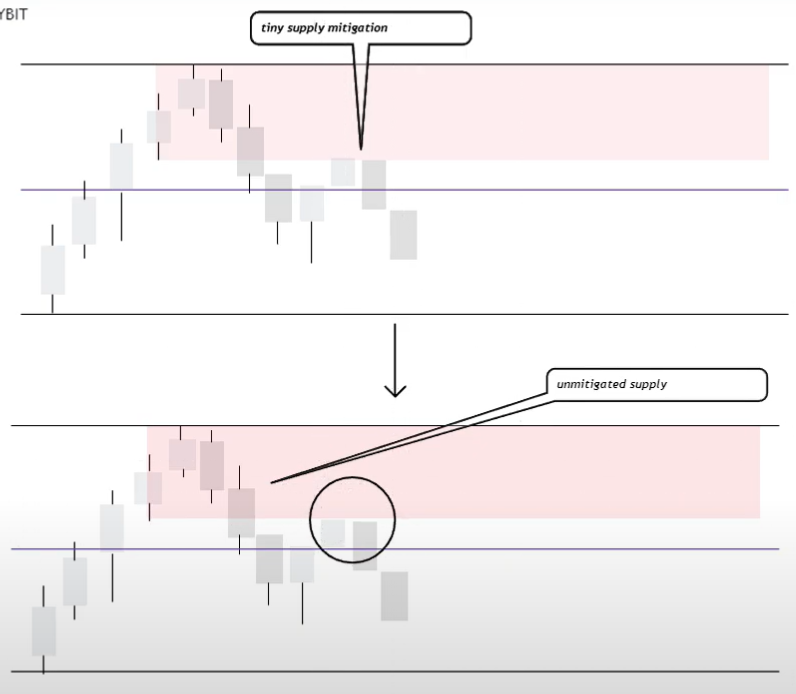
Exception to the FVG Rule
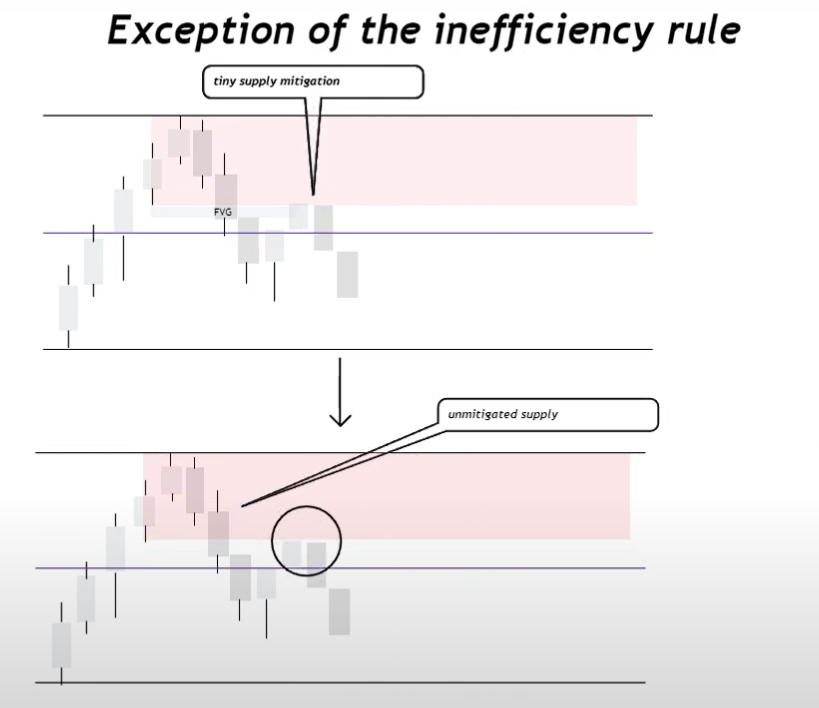
One exception: when it's the only nearby supply or demand zone within a range. If the zone was barely mitigated (slight touch) and it's the only valid POI, treat it as unmitigated by redrawing a new zone just above (supply) or just below (demand) the tiny mitigation. Only if no better POI exists nearby and the mitigation was tiny.
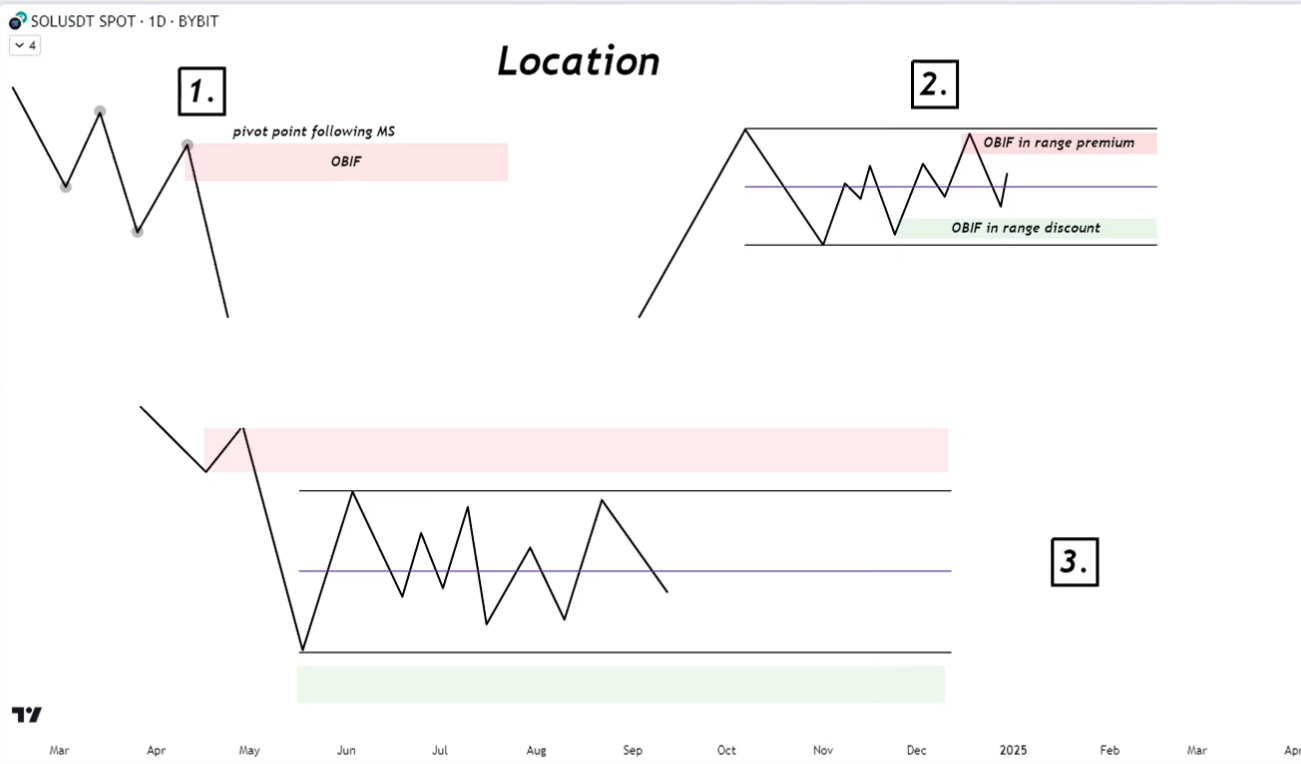
Three Key Locations to Look for Zones
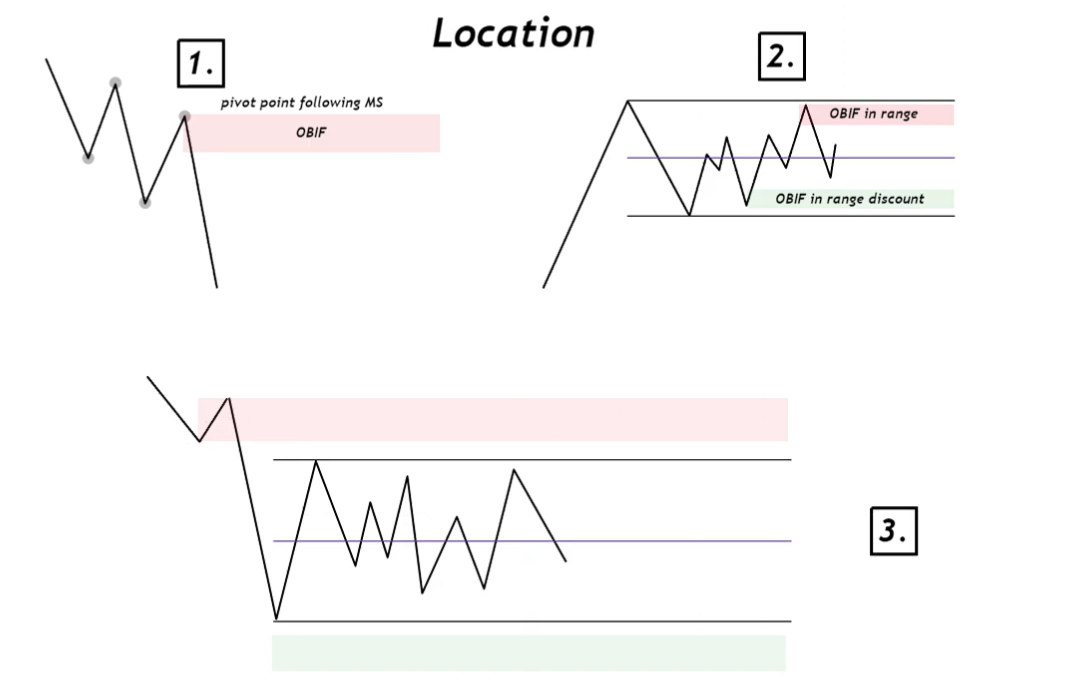
- Pivot Point OBs
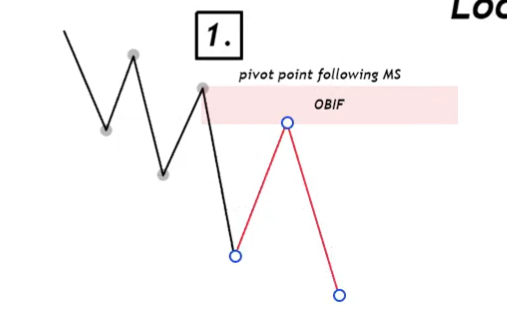
In downtrend: find OBs formed at the pivot of lower highs. In uptrend: same concept, at higher lows.
- Inside a Range
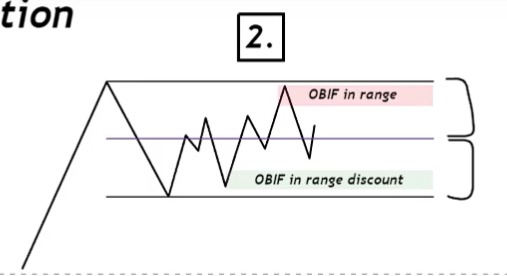
OBs in Demand zones in discount (bottom) of the range. OBs in Supply zones in premium (top) of the range.
- Outside the Range (Deviations)
Watch for supply above the range high or demand below the range low — where price might deviate and return.
Context is always key. Never pull order blocks randomly. Determine structure first (highs, lows, trends), identify ranges (confirmed via structure), then look for supply in upper range / demand in lower range. Only after establishing context, draw OBs or structure zones.
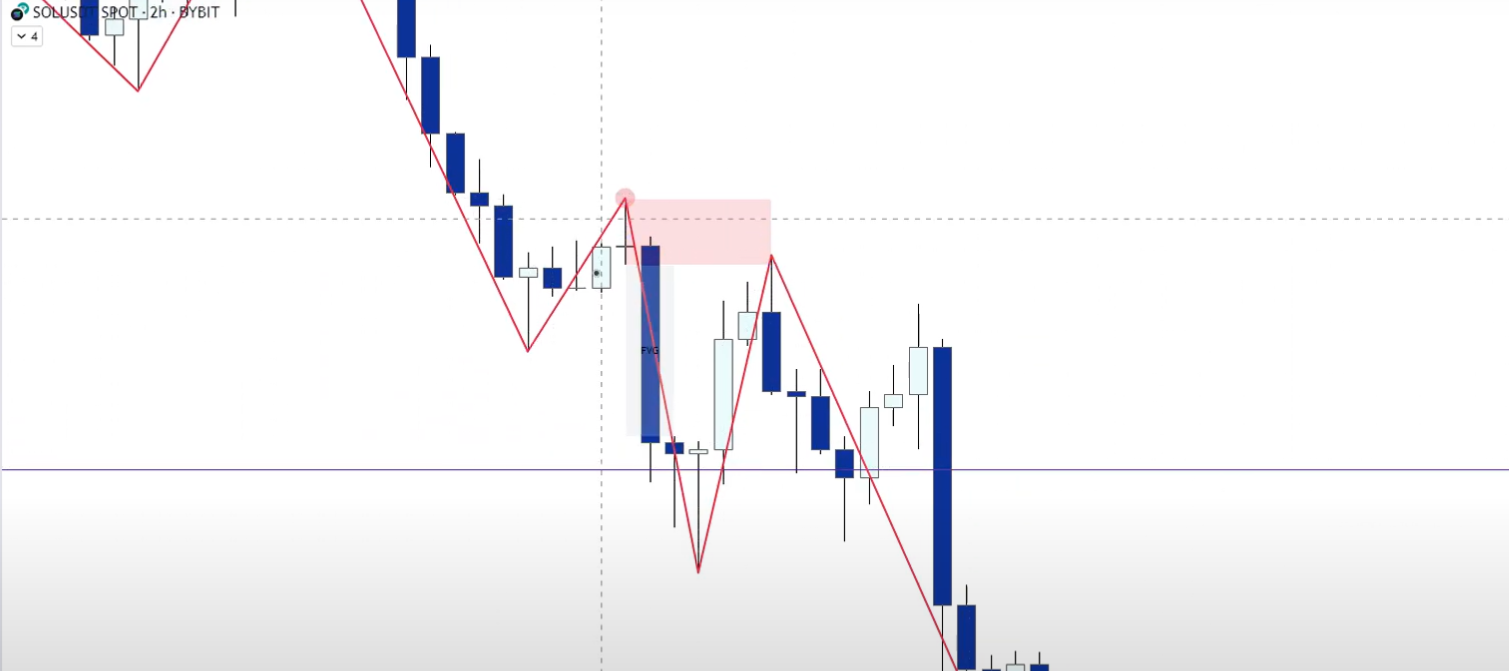
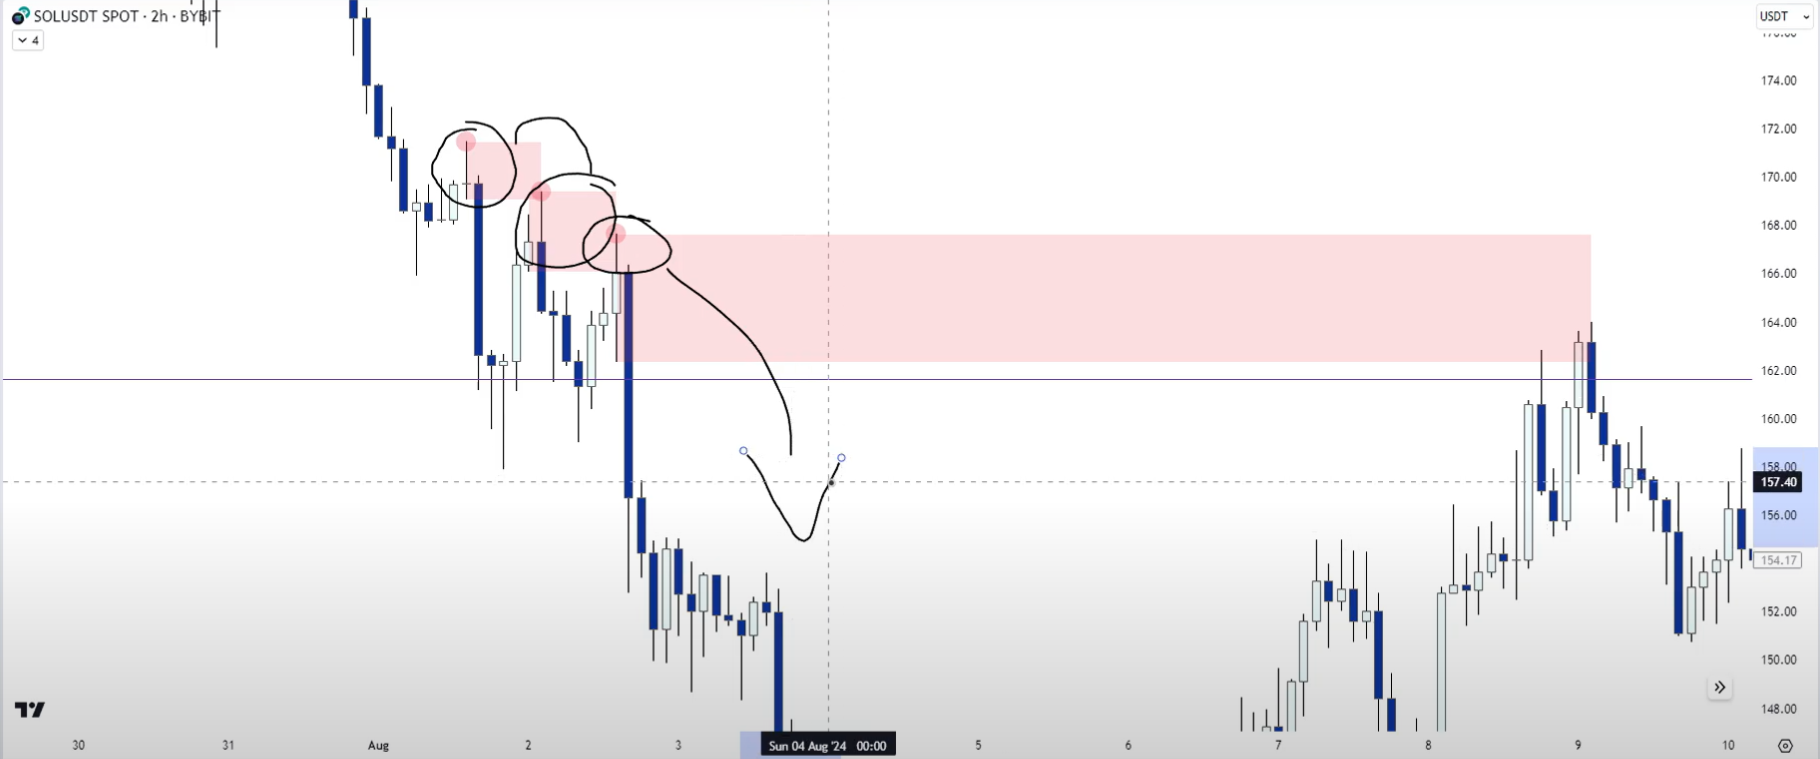
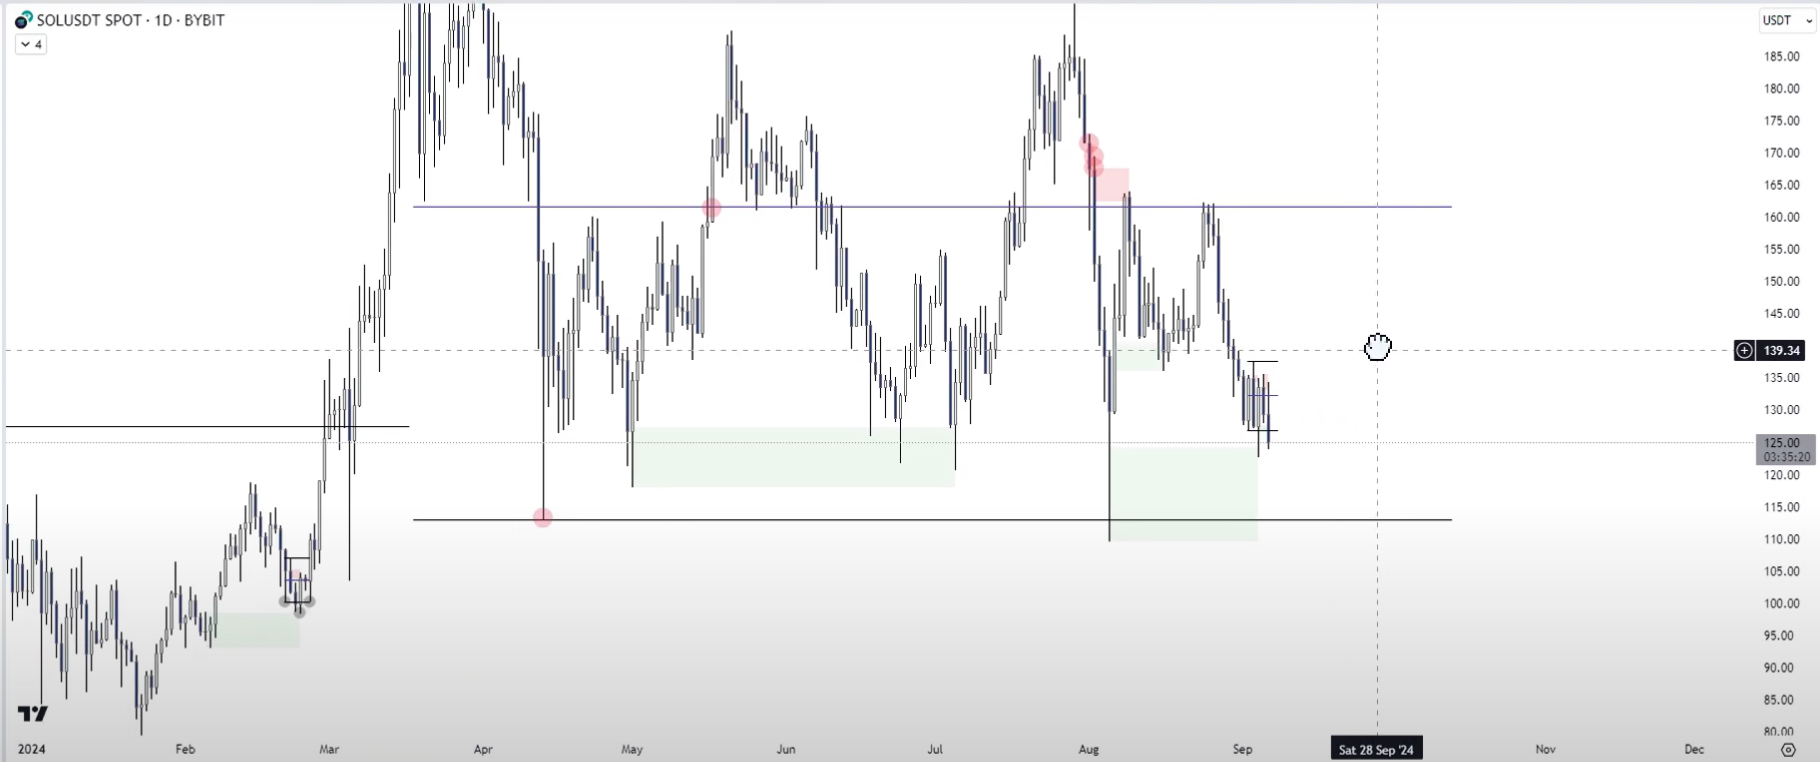
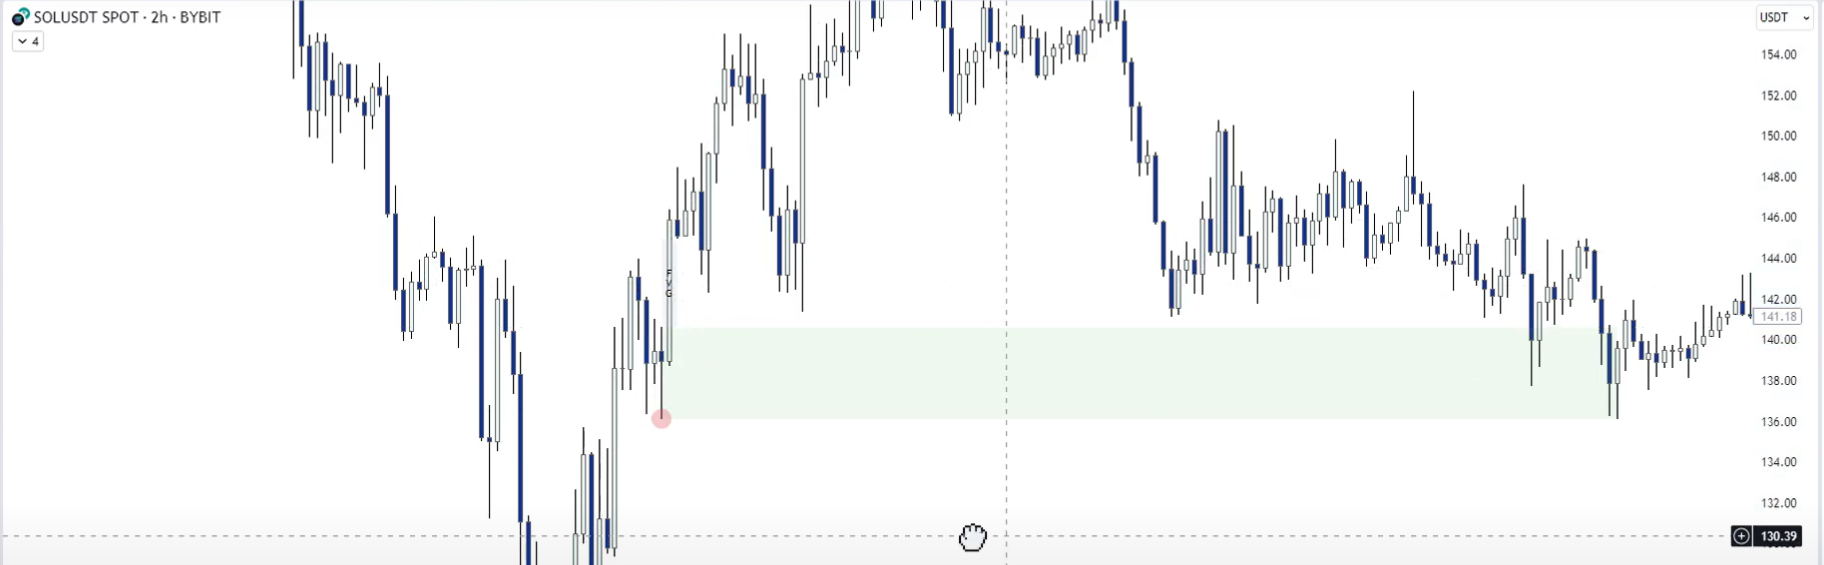
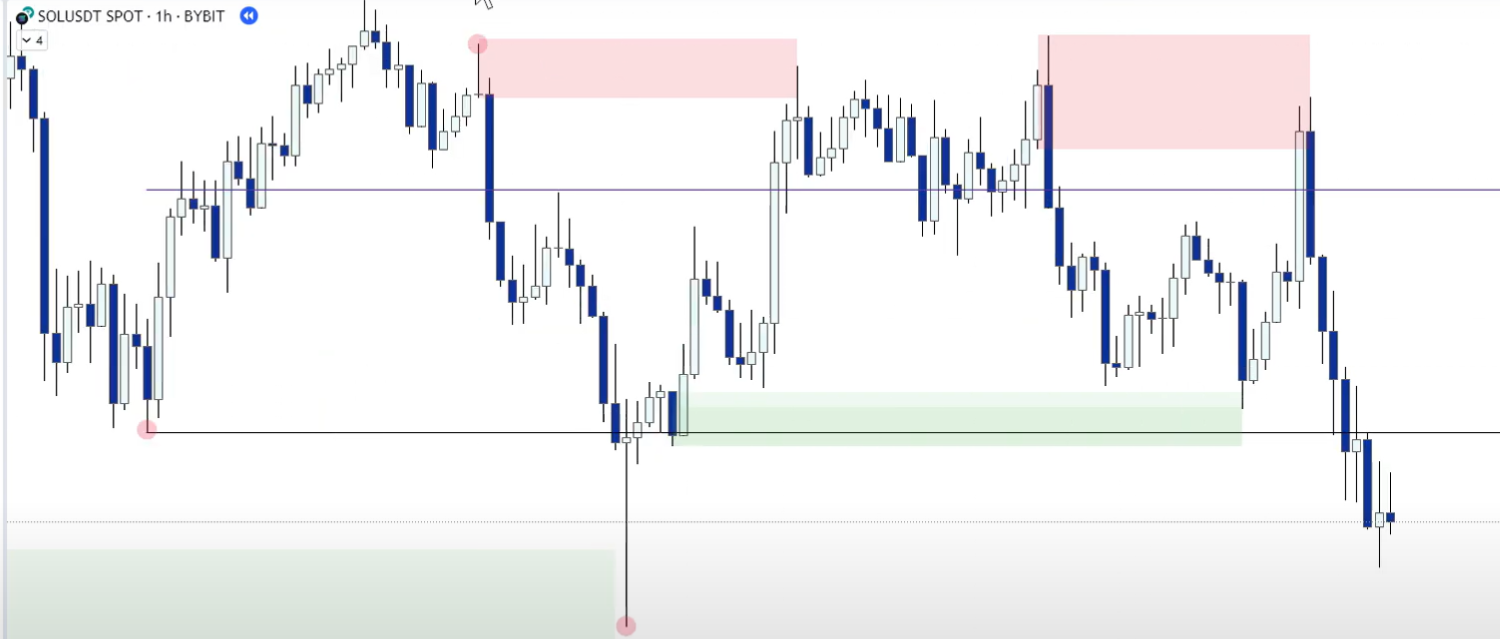
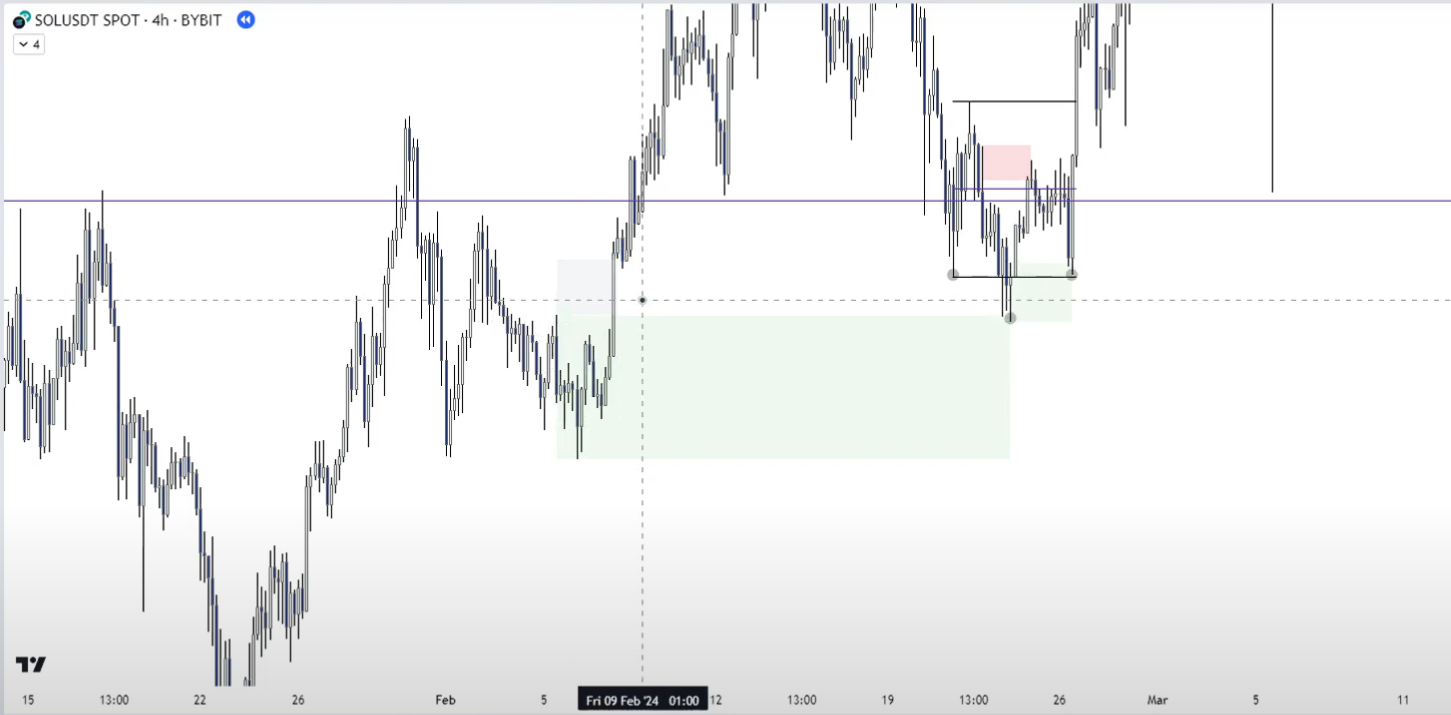
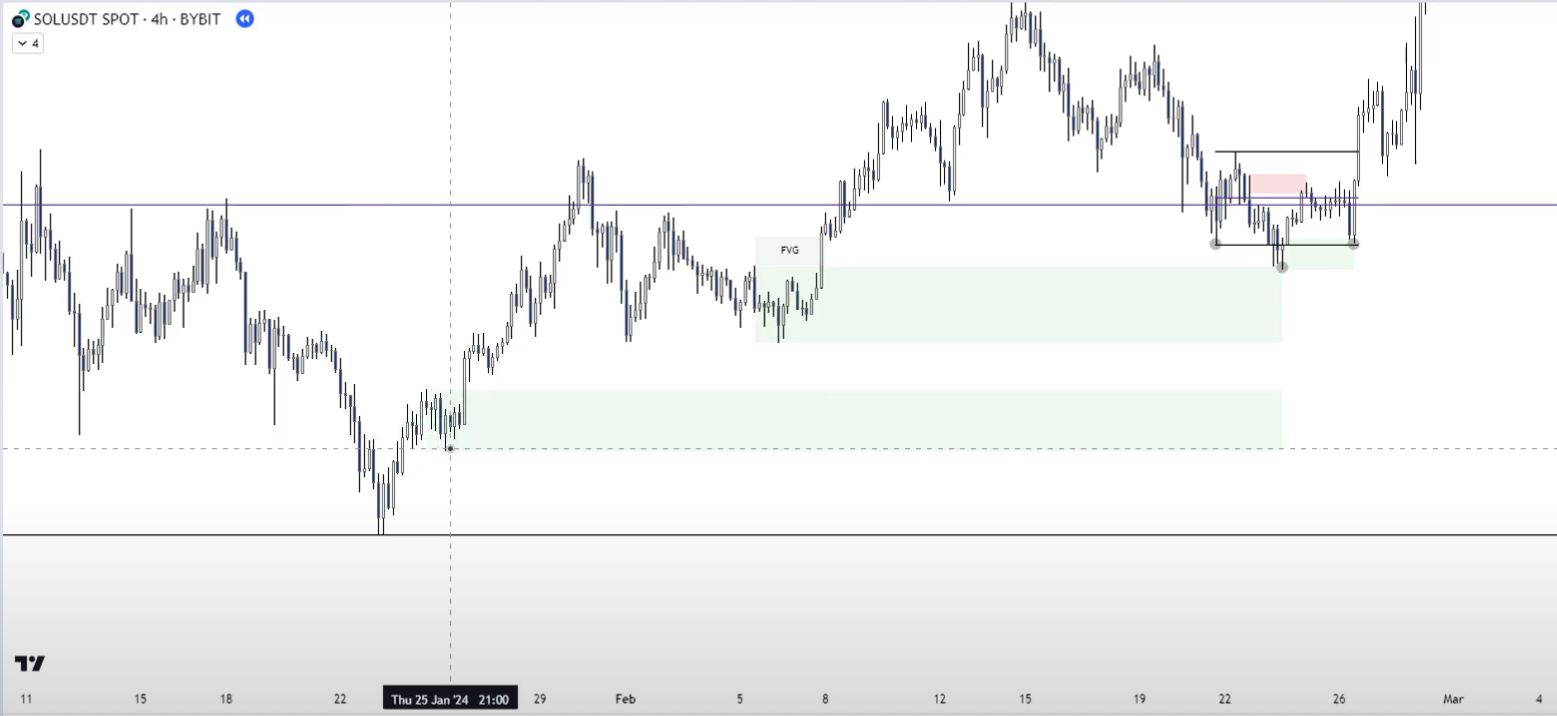
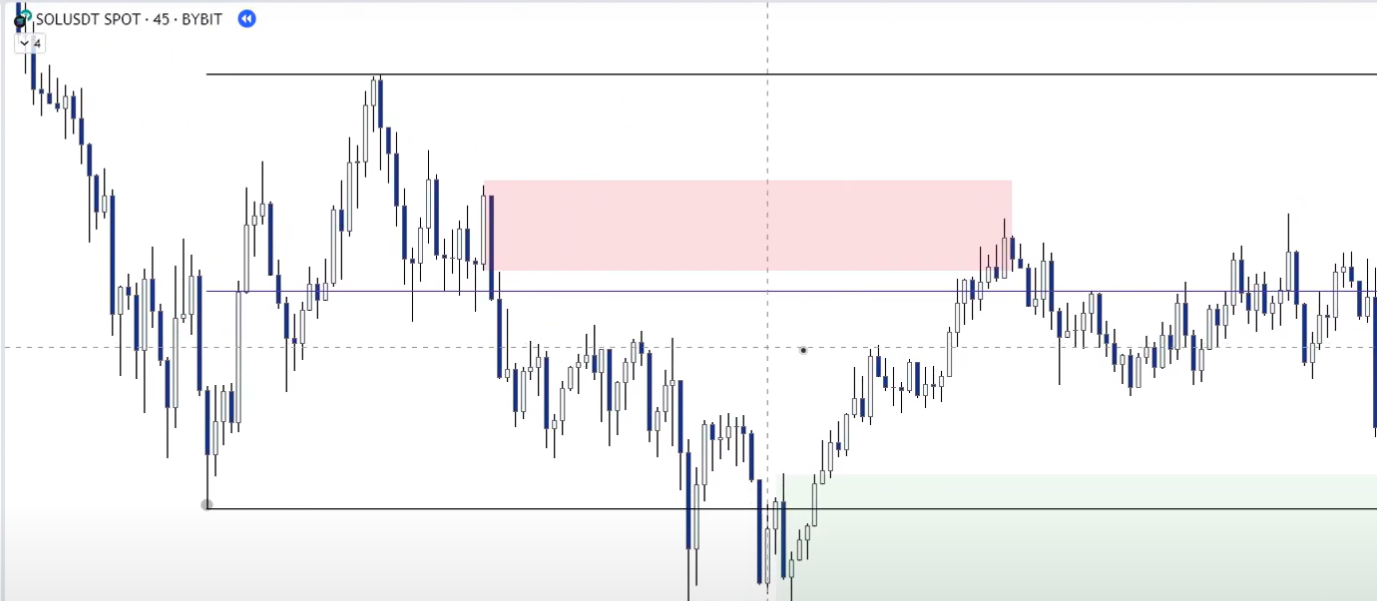
Charting Walkthrough on SOL
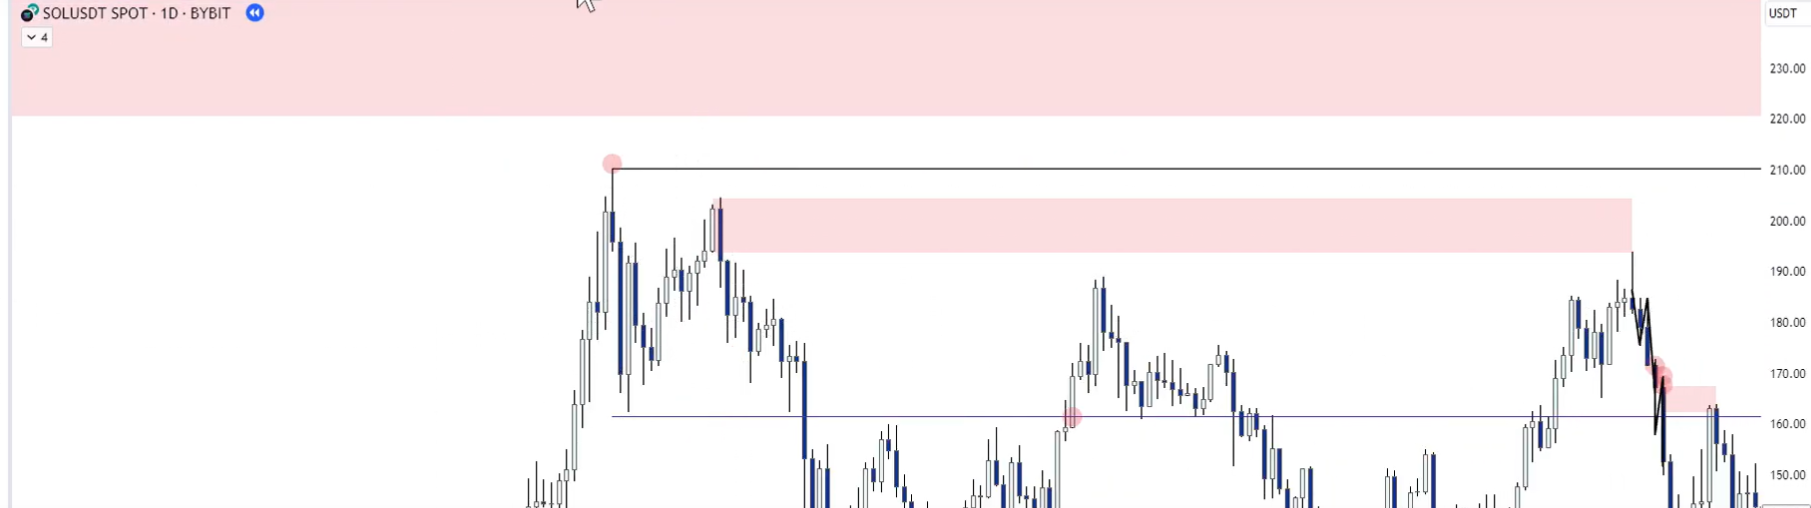
Mark the range high and range low first — macro structure. Always check for demand below range low and supply above range high (deviation areas).
To the left of the range on daily, identify a bearish order block — last up candle before the sharp drop, leaves a clear FVG = valid daily supply zone:
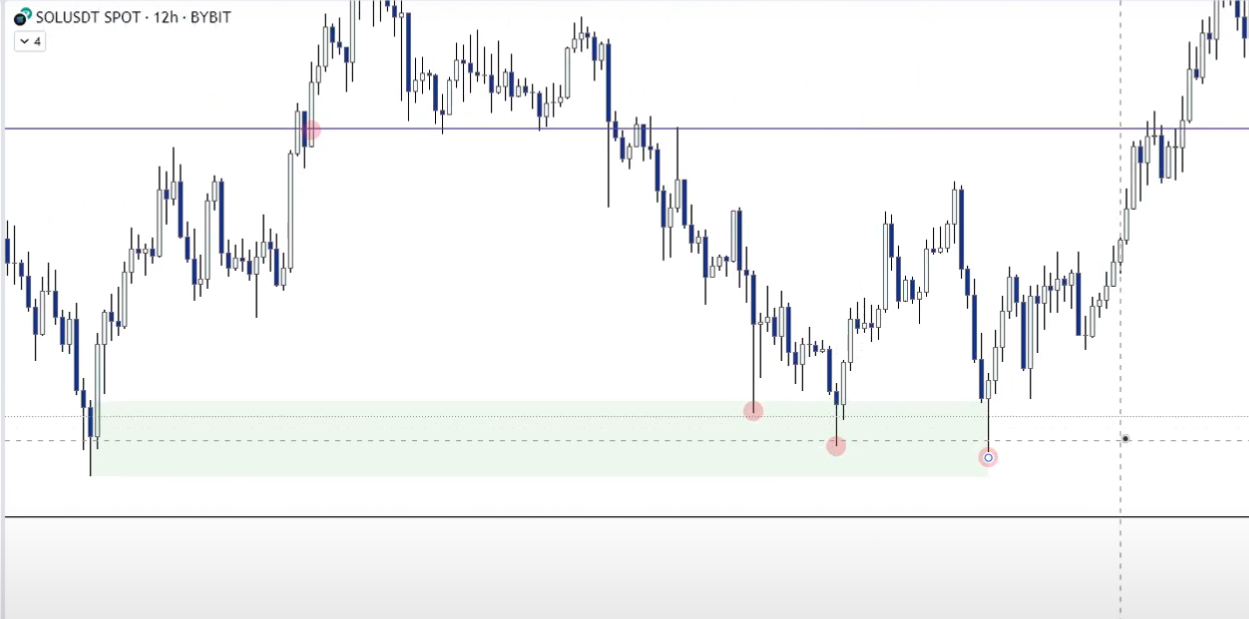
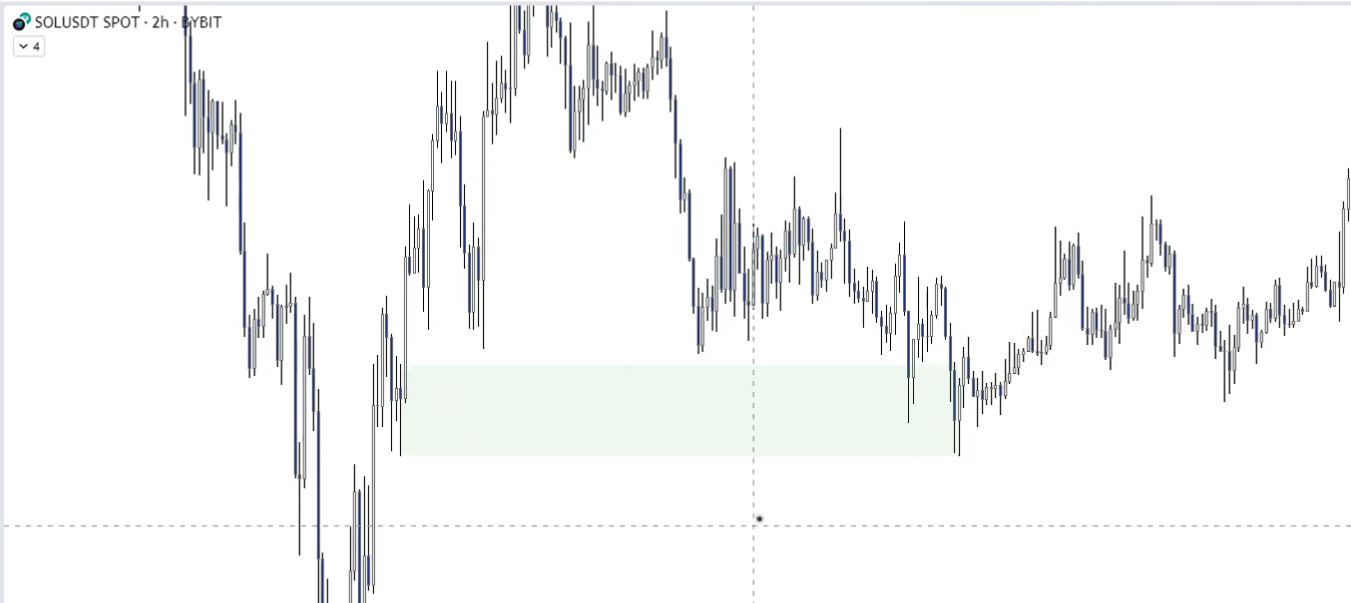
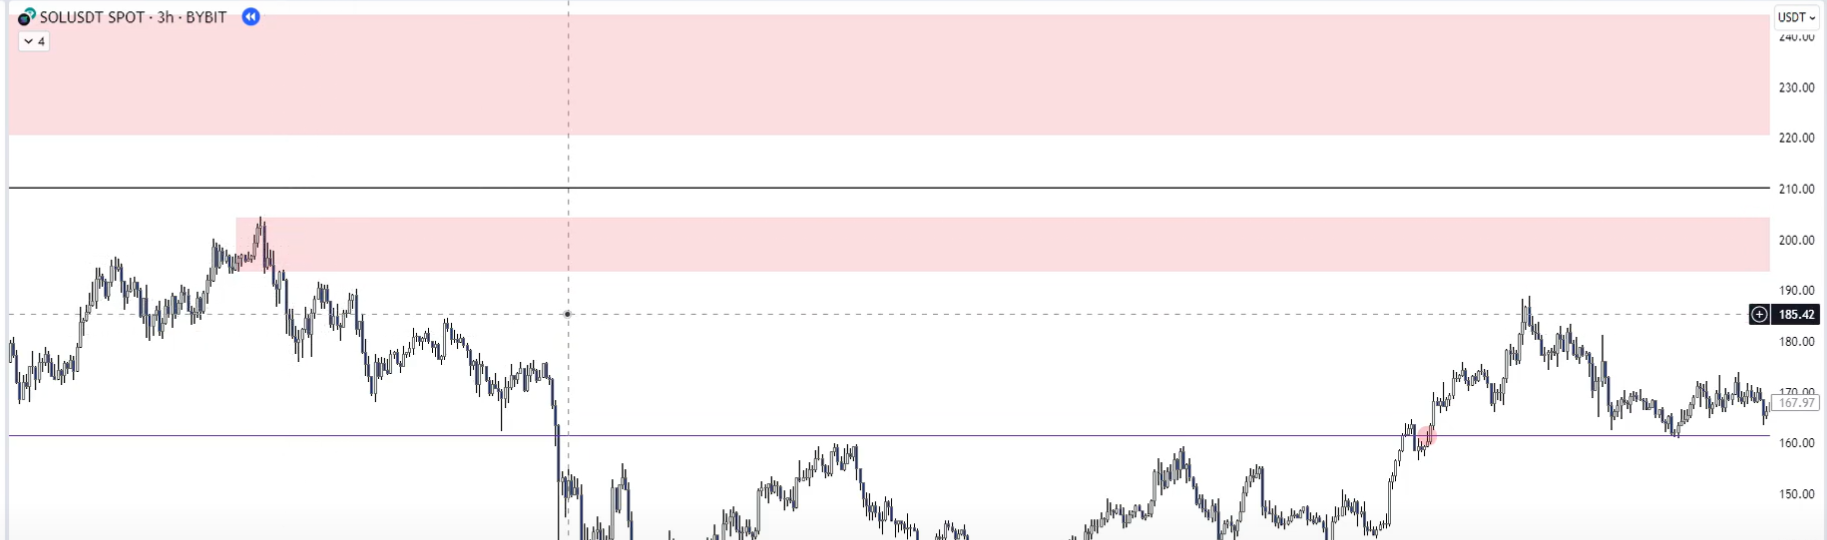
Intra-range analysis (Daily + 12h):
Another bearish OB in the upper section — price tapped into it, strong bearish move followed:
Look for demand in the lower section. Initially unsure on daily, drop to 12-hour:
Find a bullish OB (last down candle before expansion up, with FVG). Price reacts beautifully:
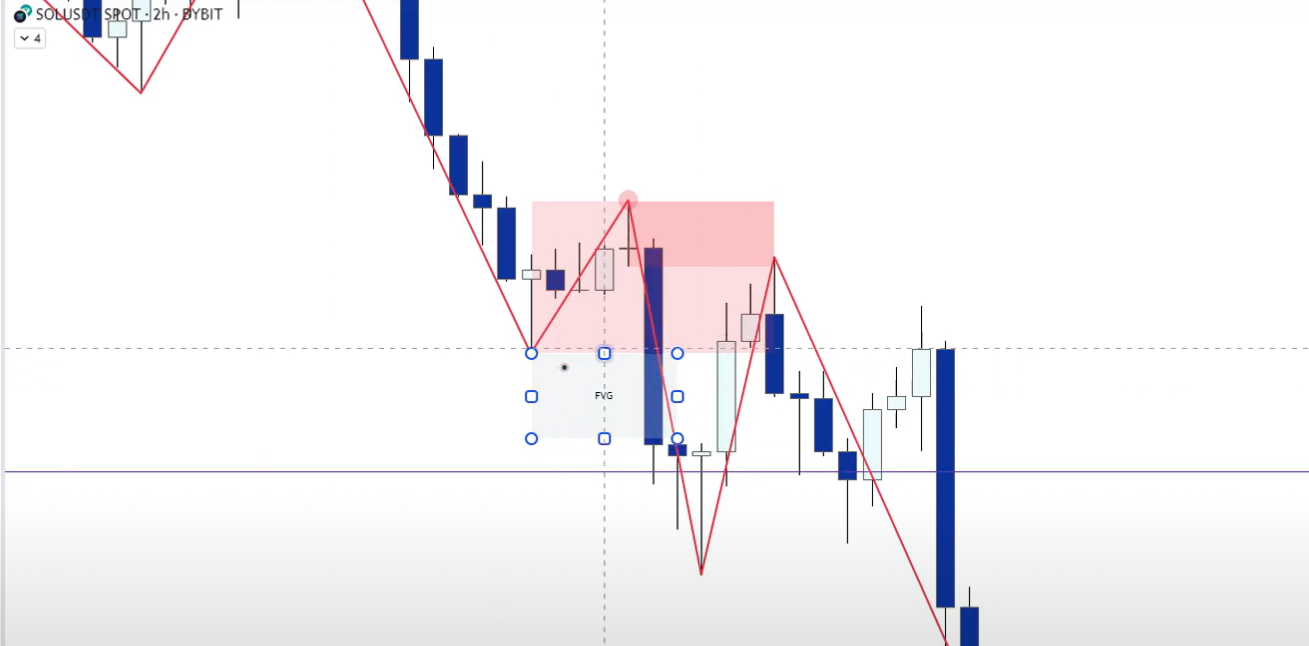
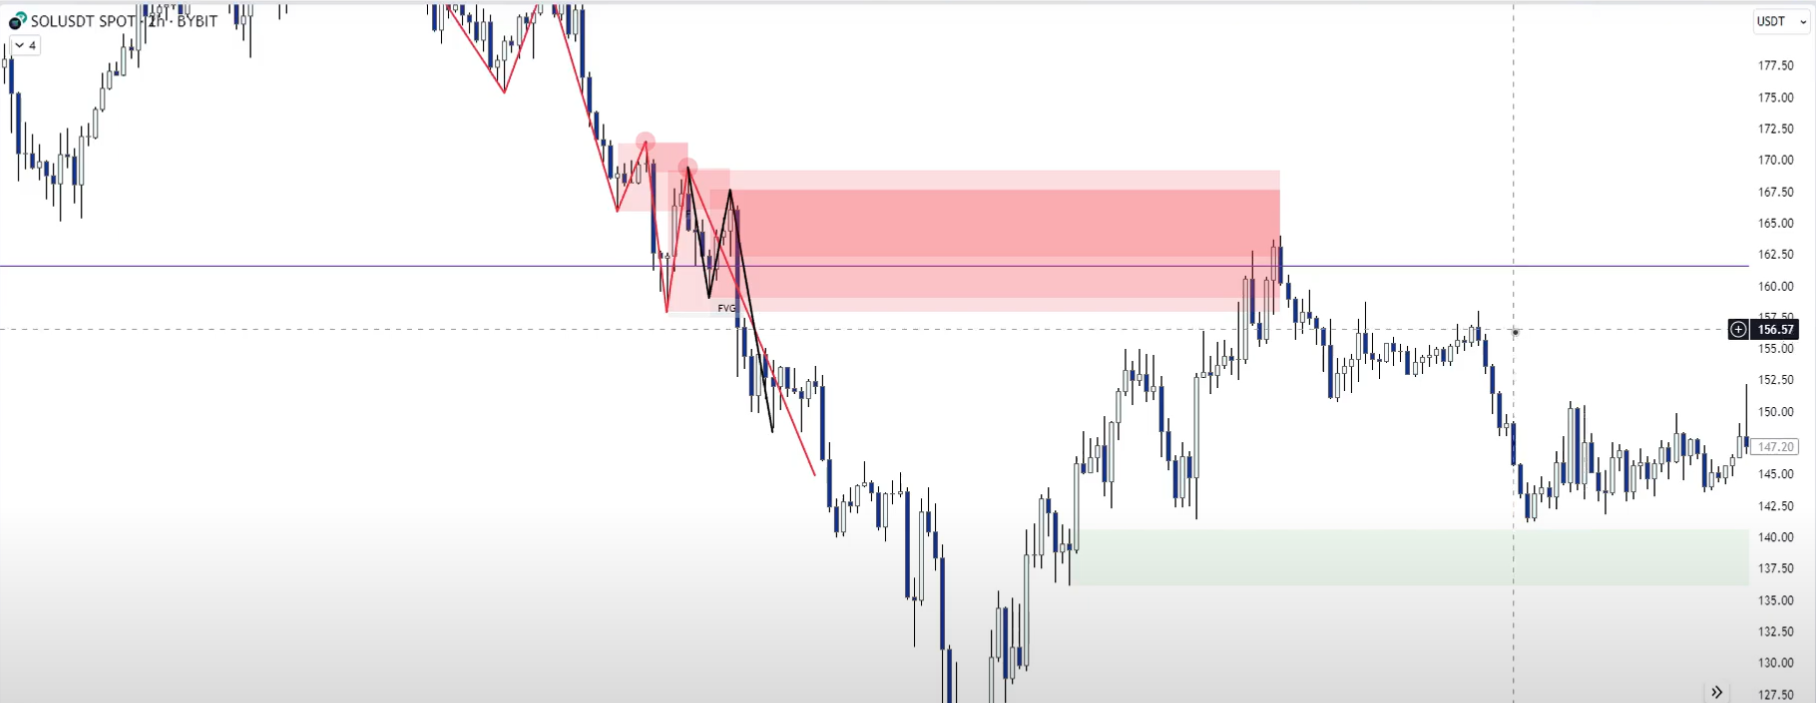
After bullish reaction, price starts trending down — forms lower highs and lower lows (textbook downtrend):
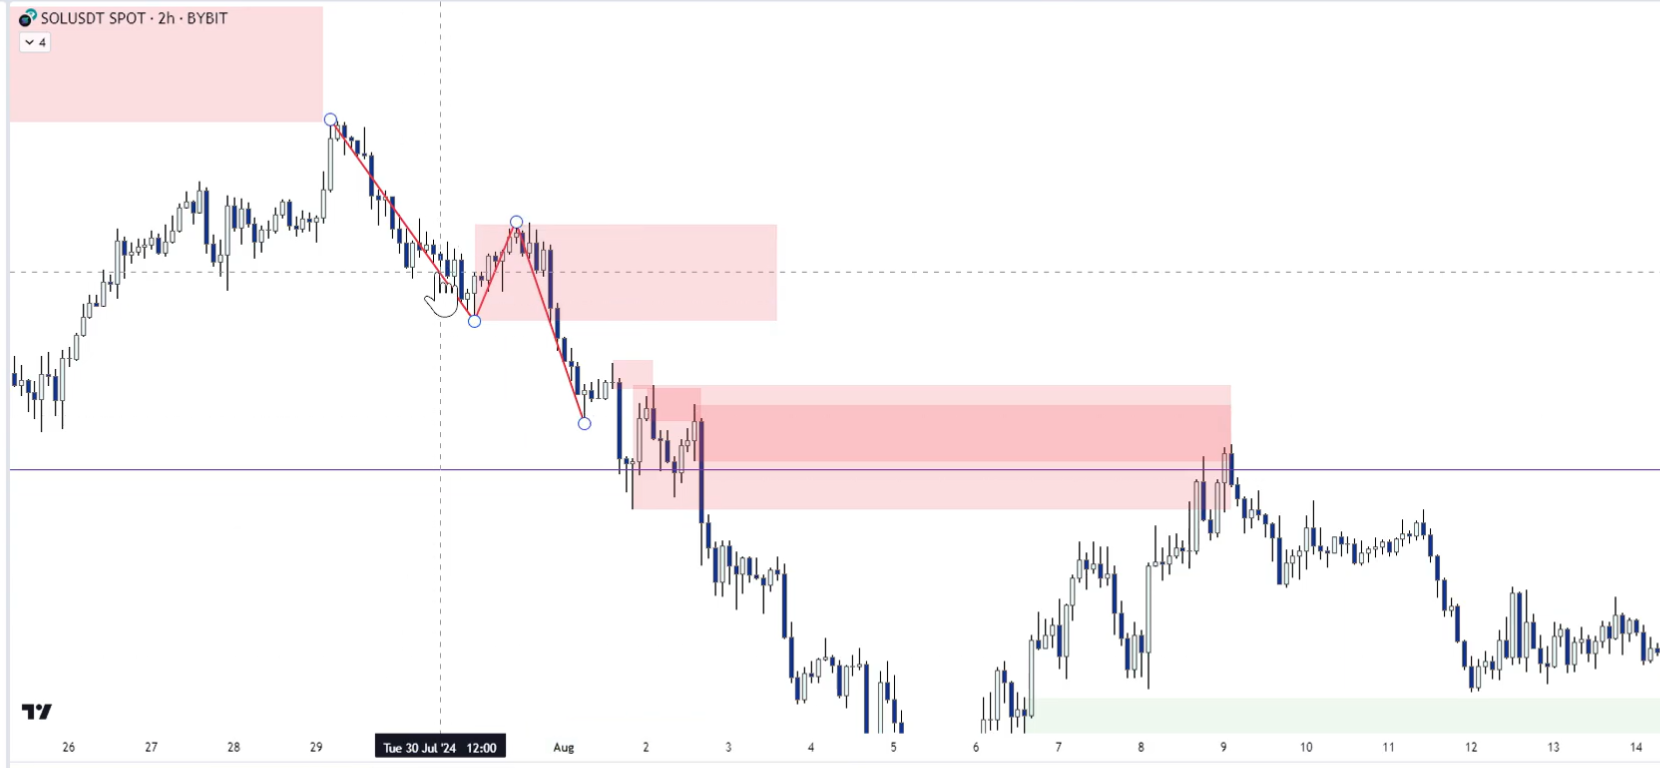
Pull structure supply: from the pivot lower high using the last up candle before expansion down. Ensure FVG = valid:
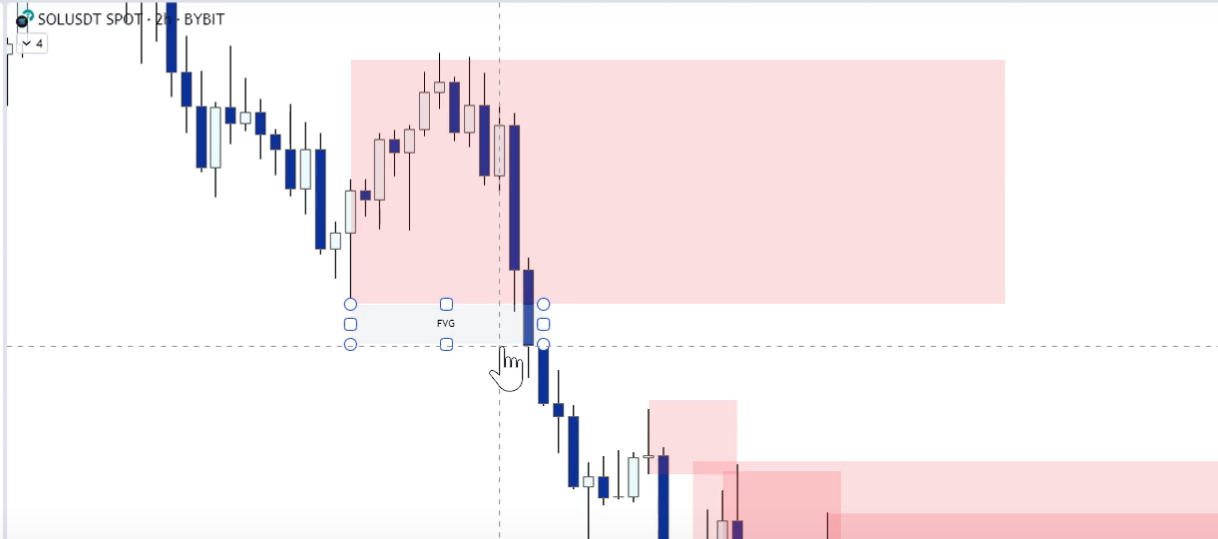
This FVG was mitigated from the top down — not ideal. Look for a better one.
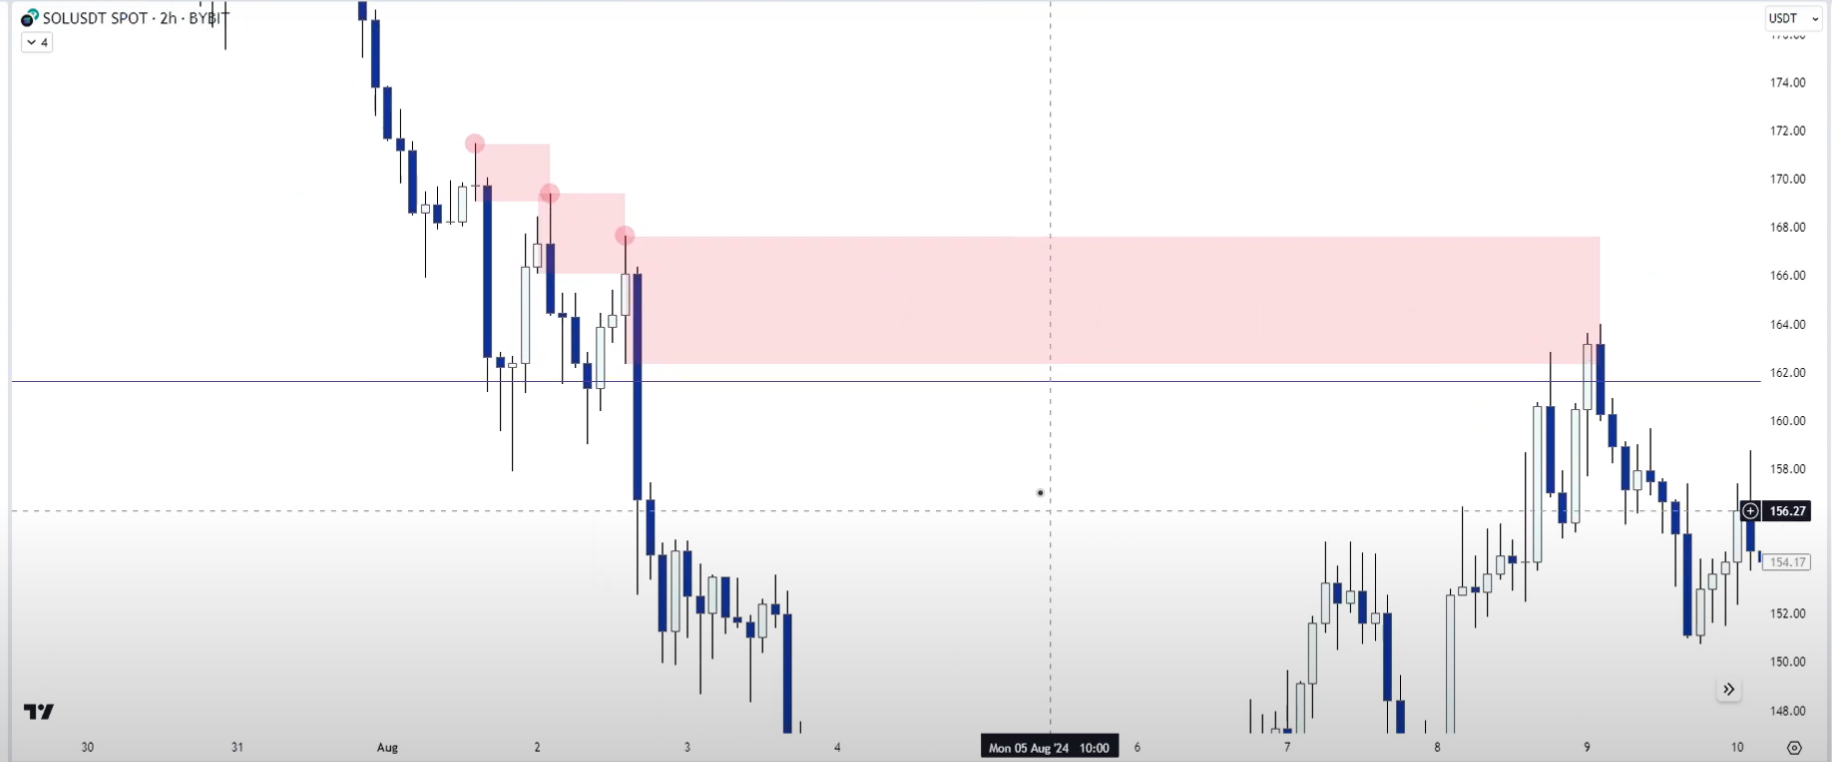
Found another pivot point OB:
It's part of a bigger OB:
The larger supply covers a wider area; a smaller OB inside the pivot offers a more refined entry. Both are valid — choose based on trading style.
Notice how price goes for the most refined area:
Supply Chain Concept
When one OB creates another, and that creates another — forming a cascading chain:
The second OB in the chain tends to yield very strong reactions:
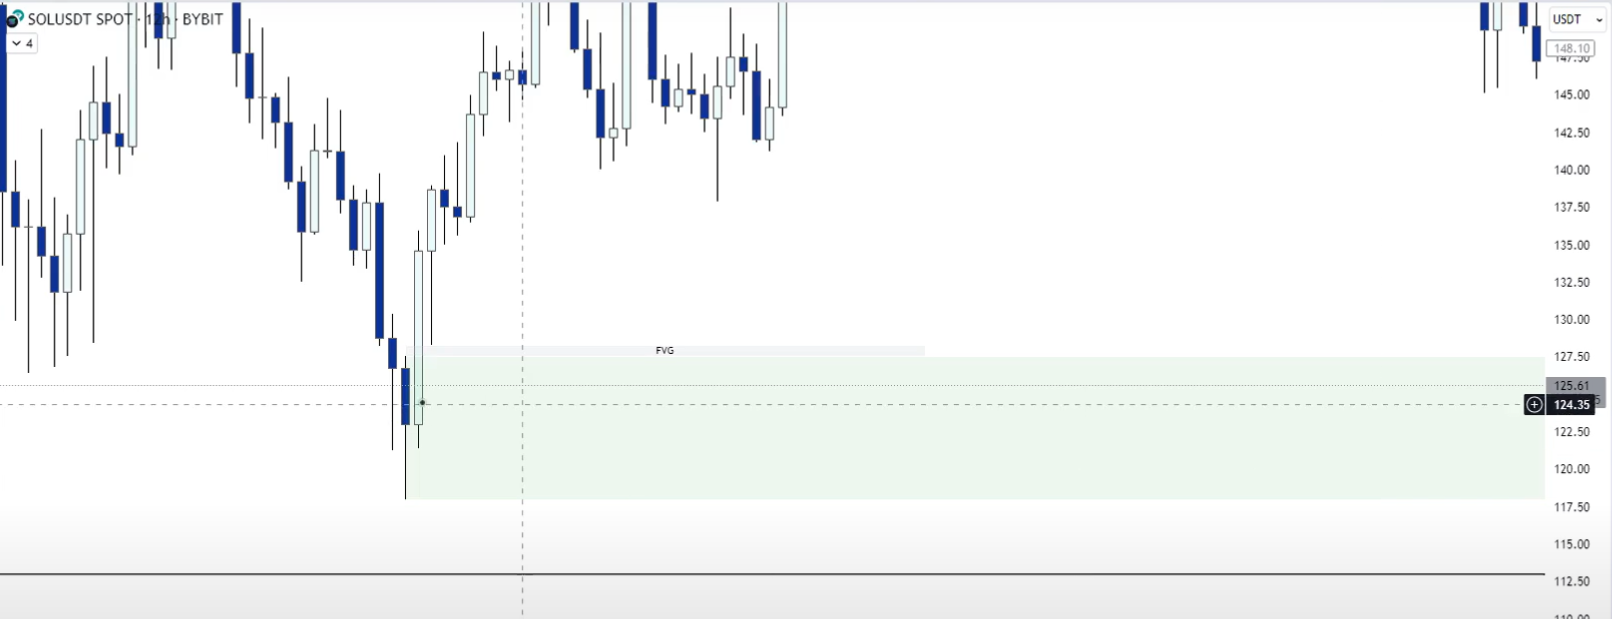
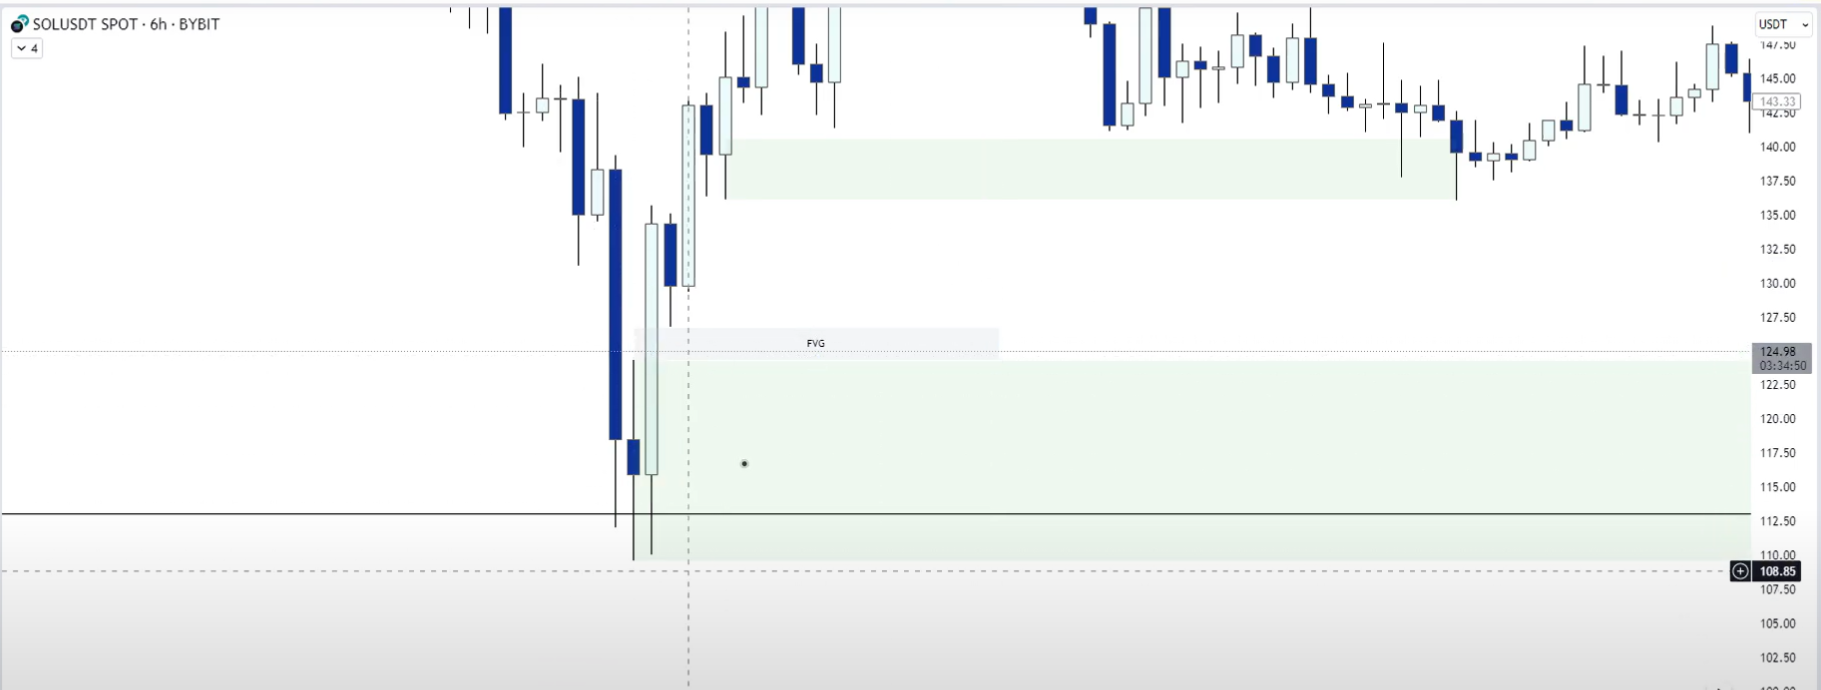
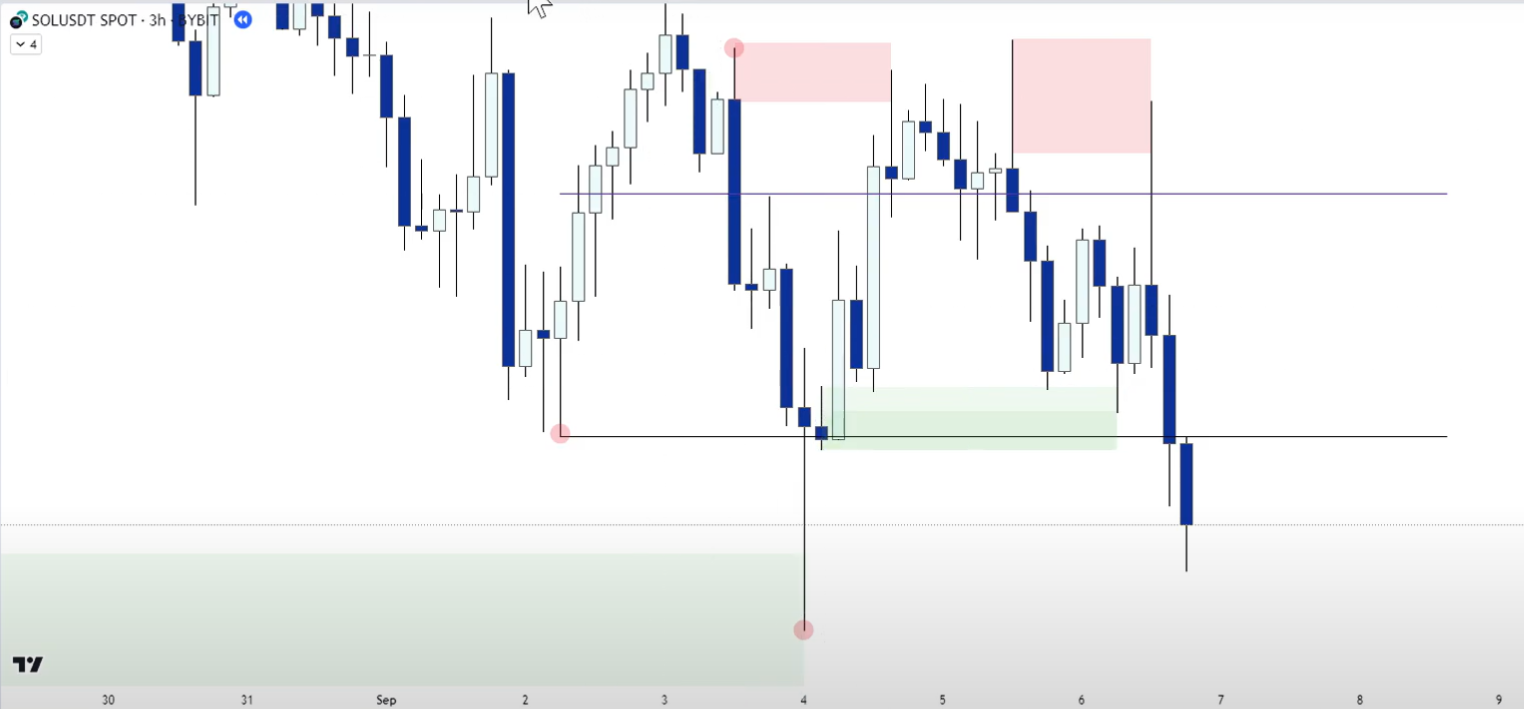
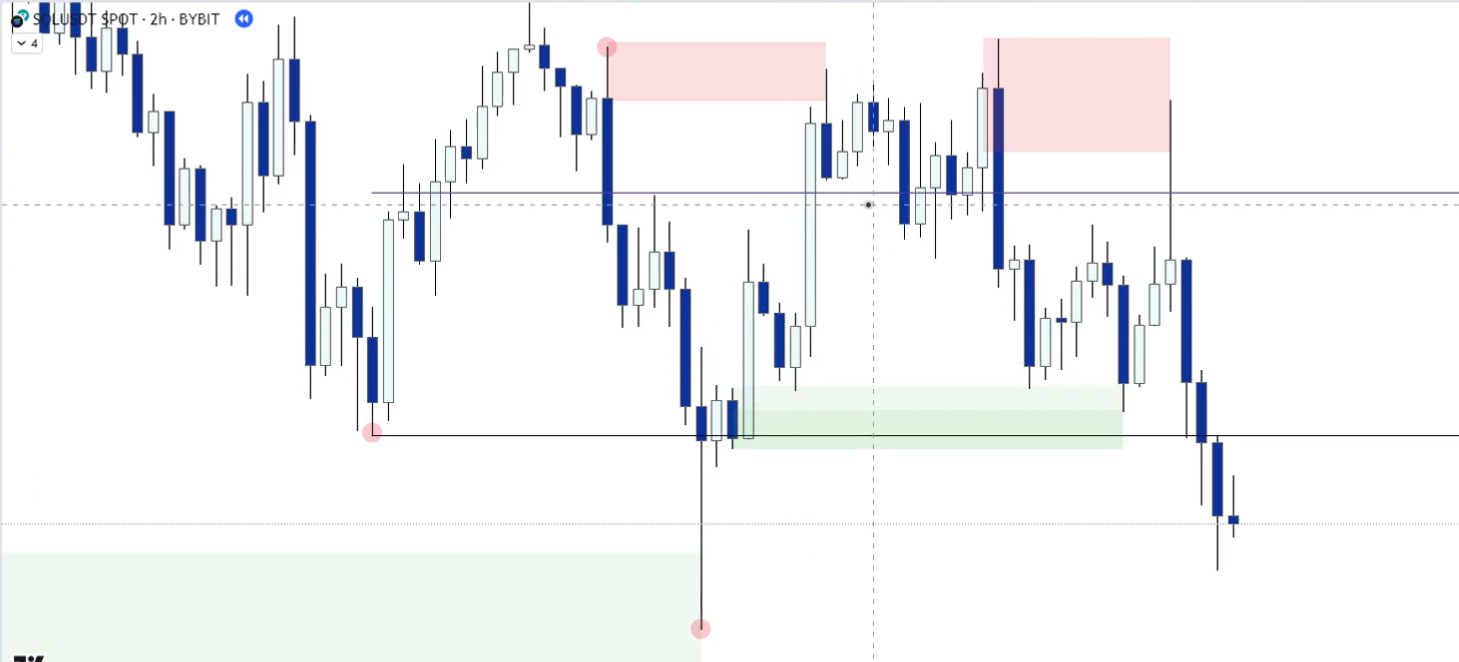
Demand Zones After Sweeps
Price sweeps the low — search for demand in the lower macro range:
Scan multiple timeframes (18h → 6h). Find a 6-hour bullish OB with clear FVG → valid demand:
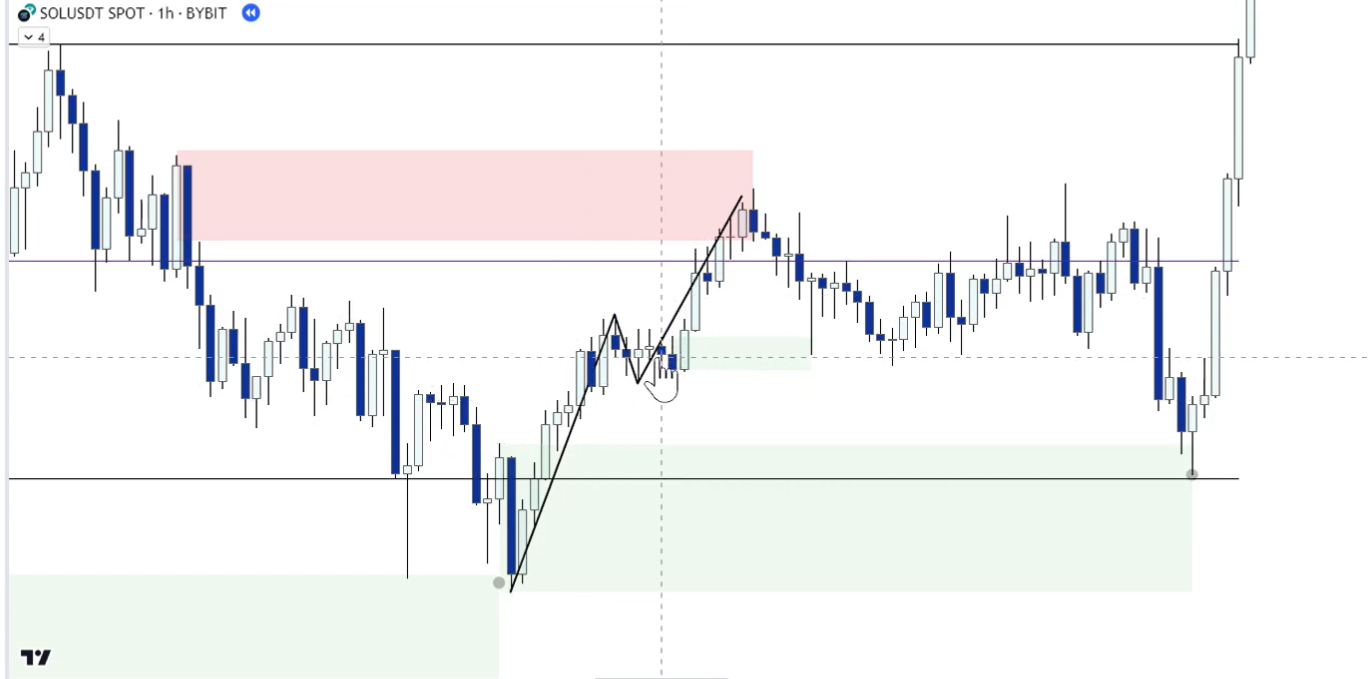
As price retraces, use structure again:
3-hour OB causes a small bounce:
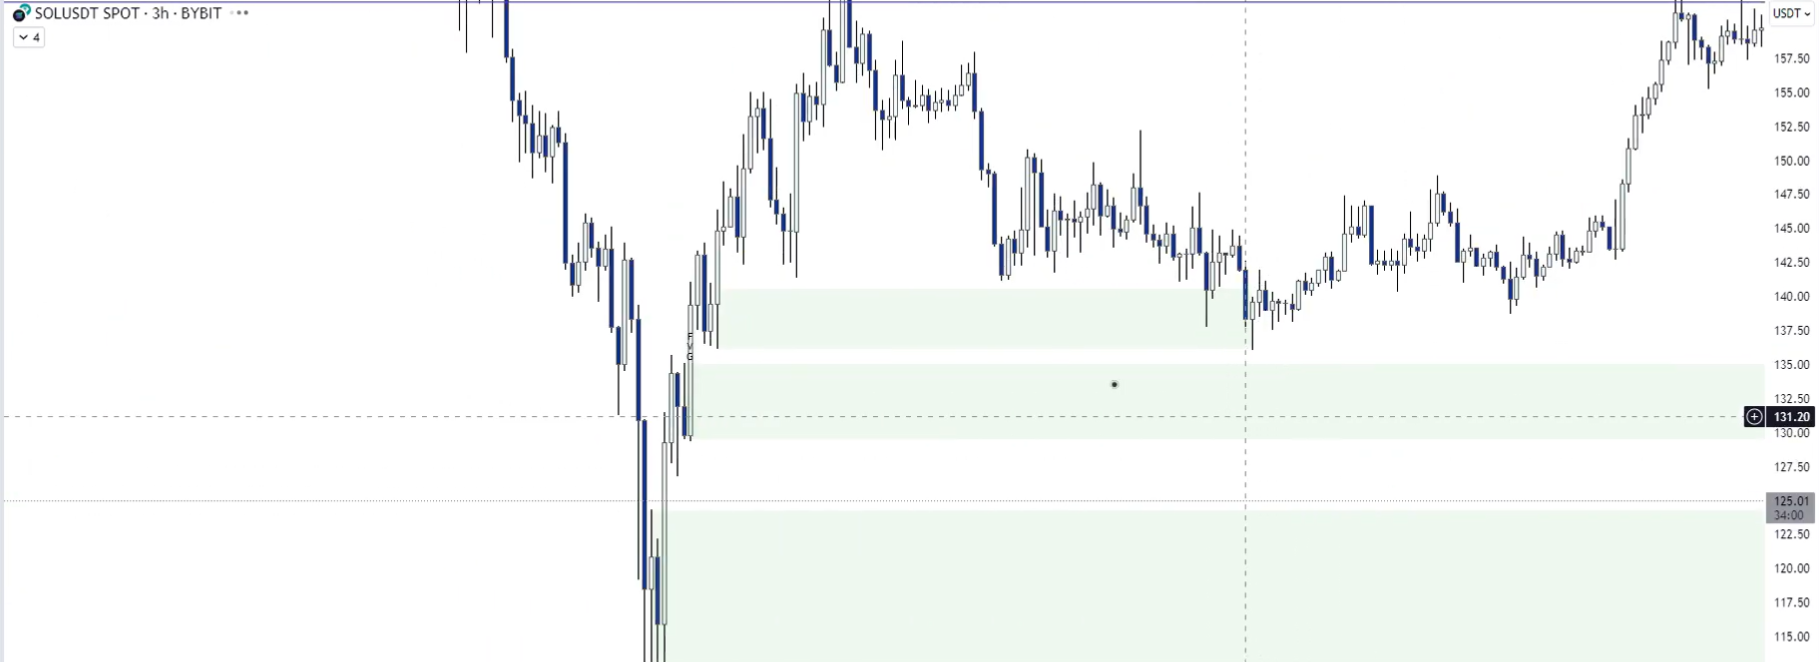
2-hour pivot OB — last down candle before expansion up, massive FVG, leads to strong bullish bounce:
Sometimes price only wicks into the OB — that's fine. Liquidity was grabbed and the OB is still valid:
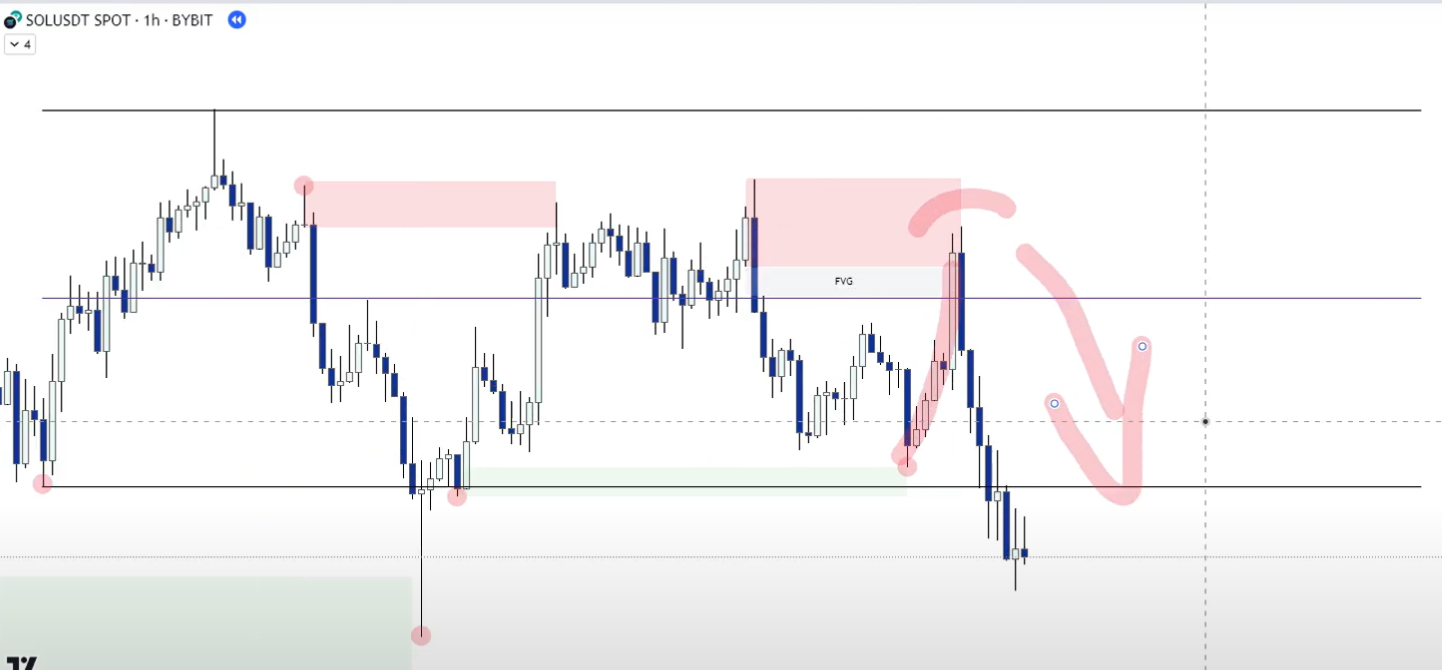
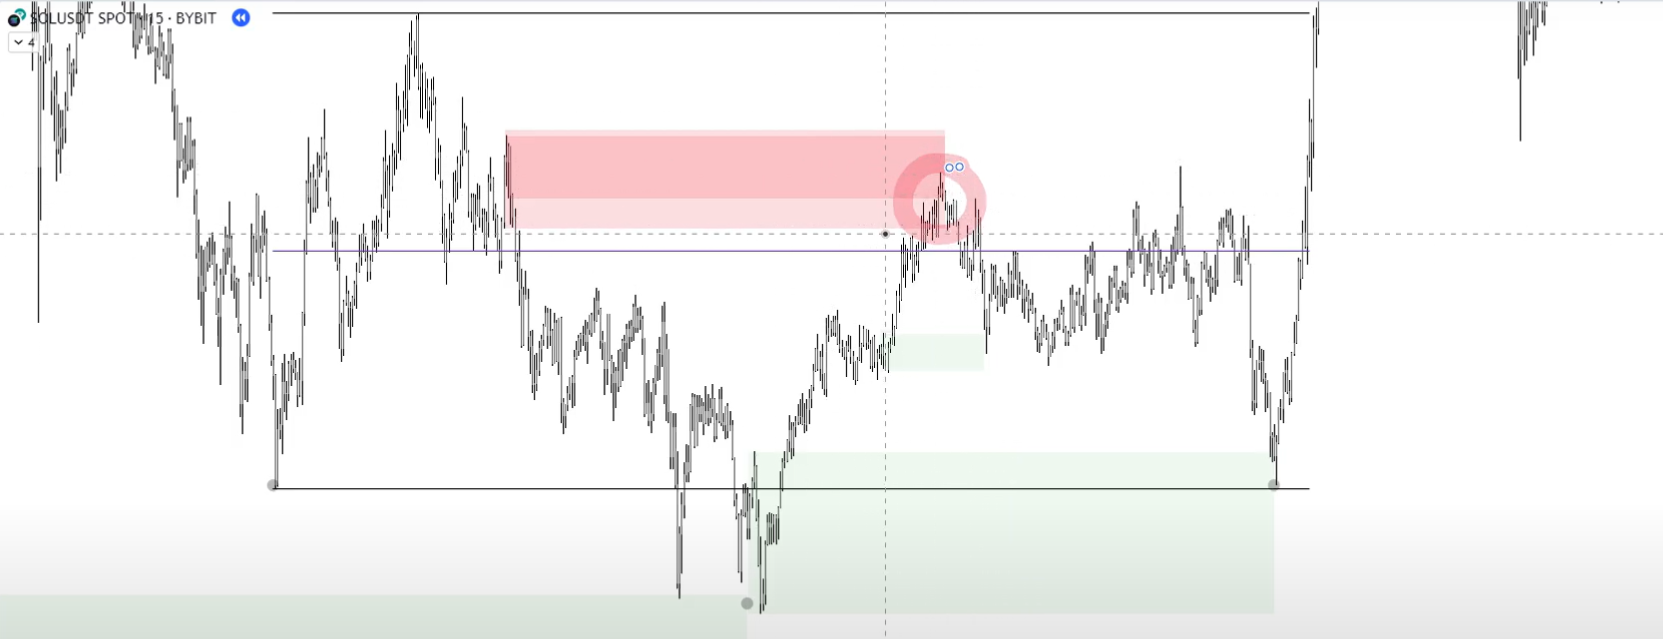
Local Range Trading
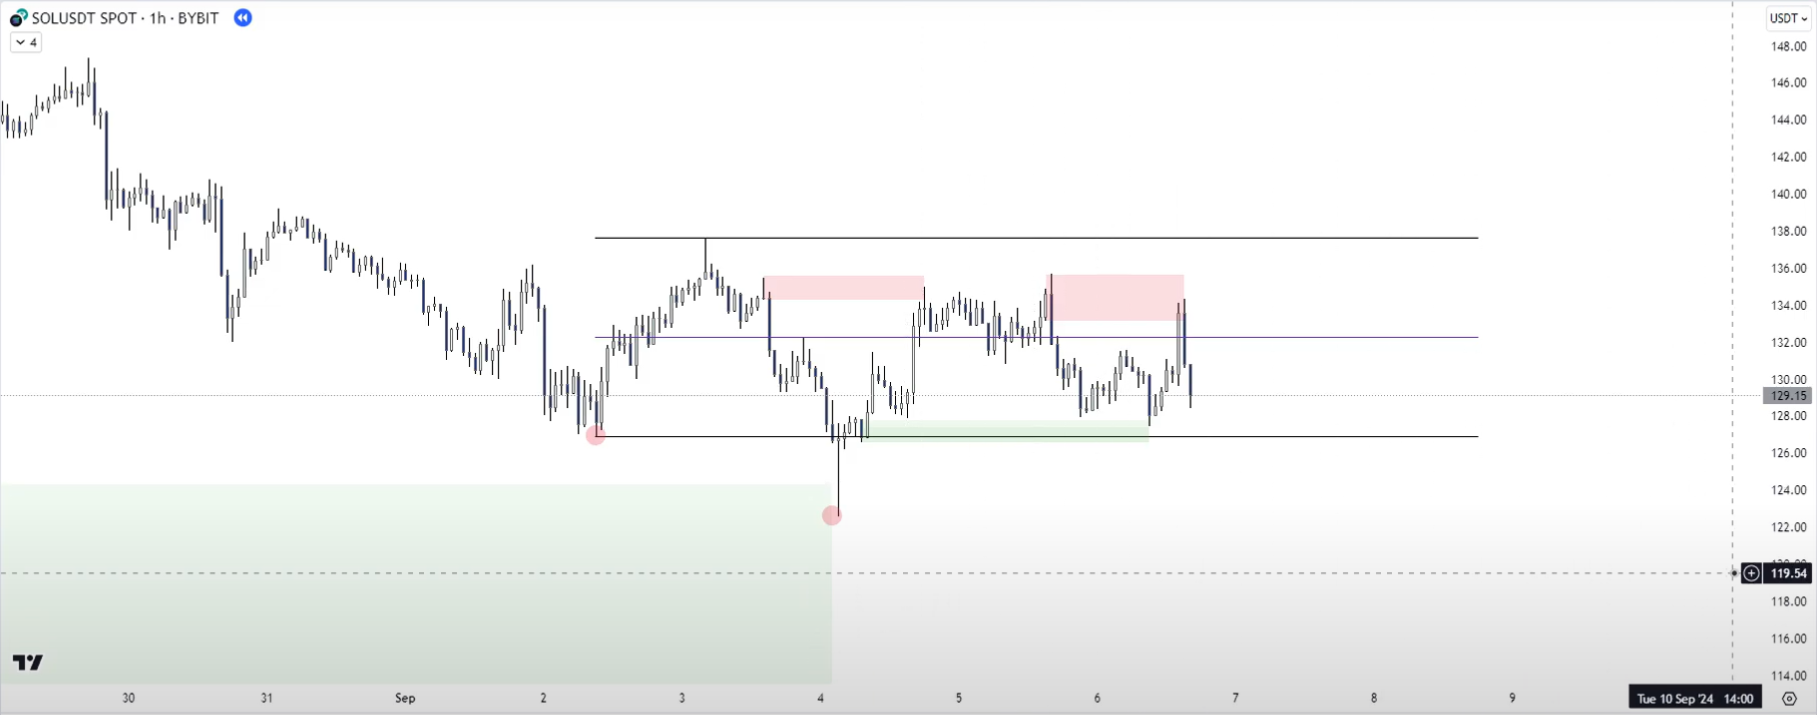
Inside a tighter range — draw a 12-hour range and focus on the most recent rotation:
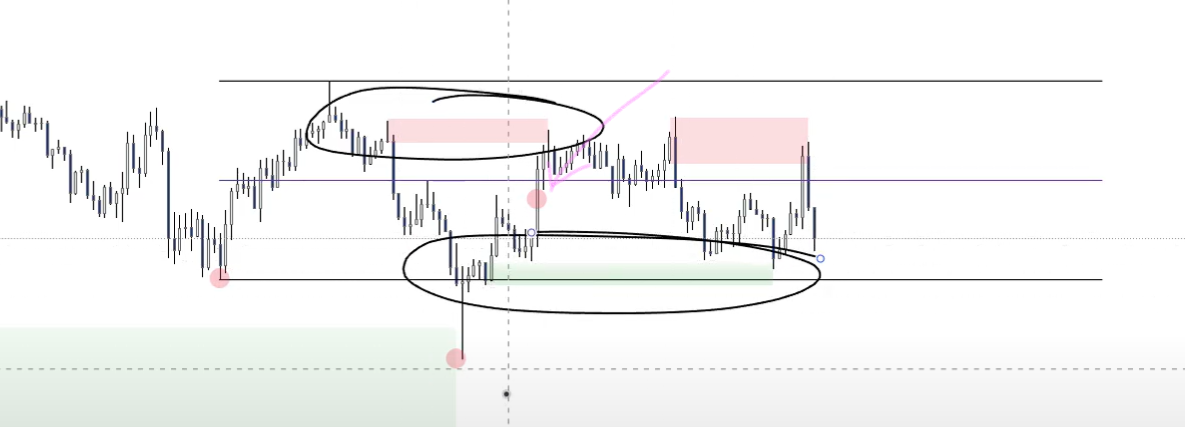
If price was at the pink arrow, you'd note the circled OBs. Look for short confirmation in the upper section, long confirmation in the lower section.
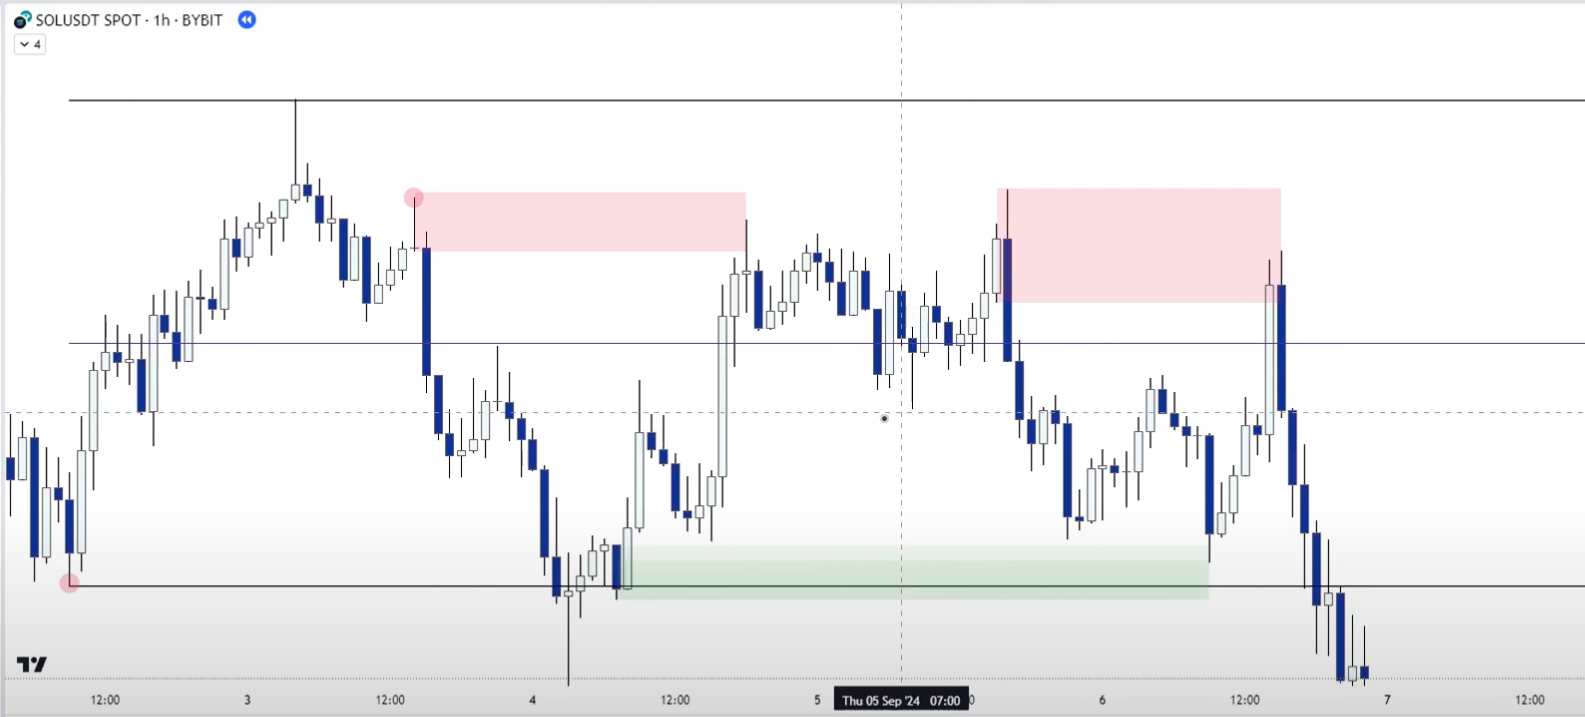
1-hour bullish OB in lower range section — price taps, forms new range. Then search for local supply in upper section — find 1-hour bearish OB, sharp downward reaction:
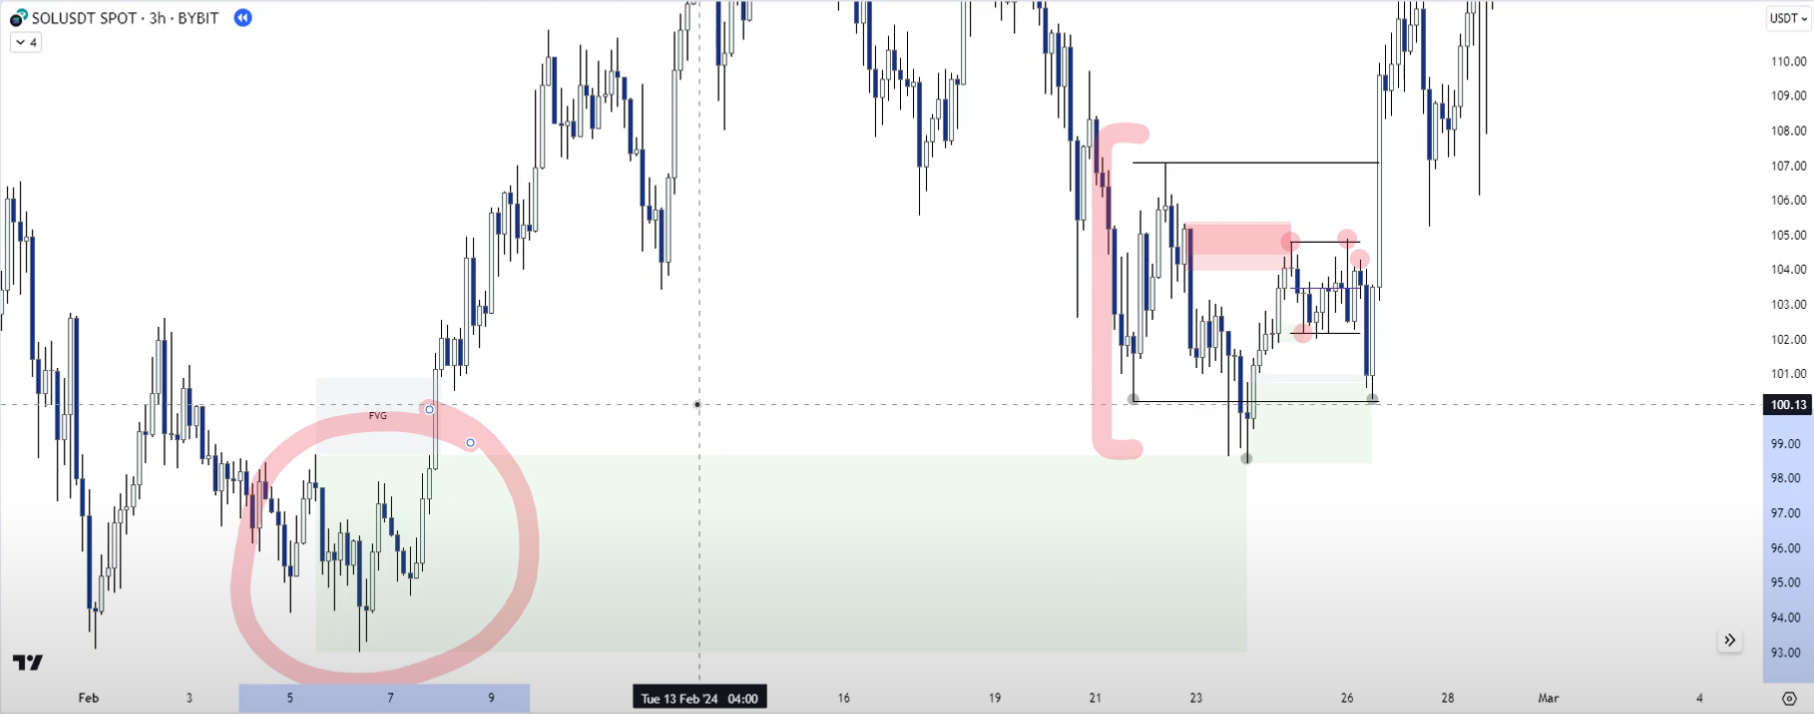
In the lower section, scan timeframes:
2h and 3h OBs — already mitigated, not valid:
Find 1h-30-minute OB with clean FVG — price returns, bullish reaction:
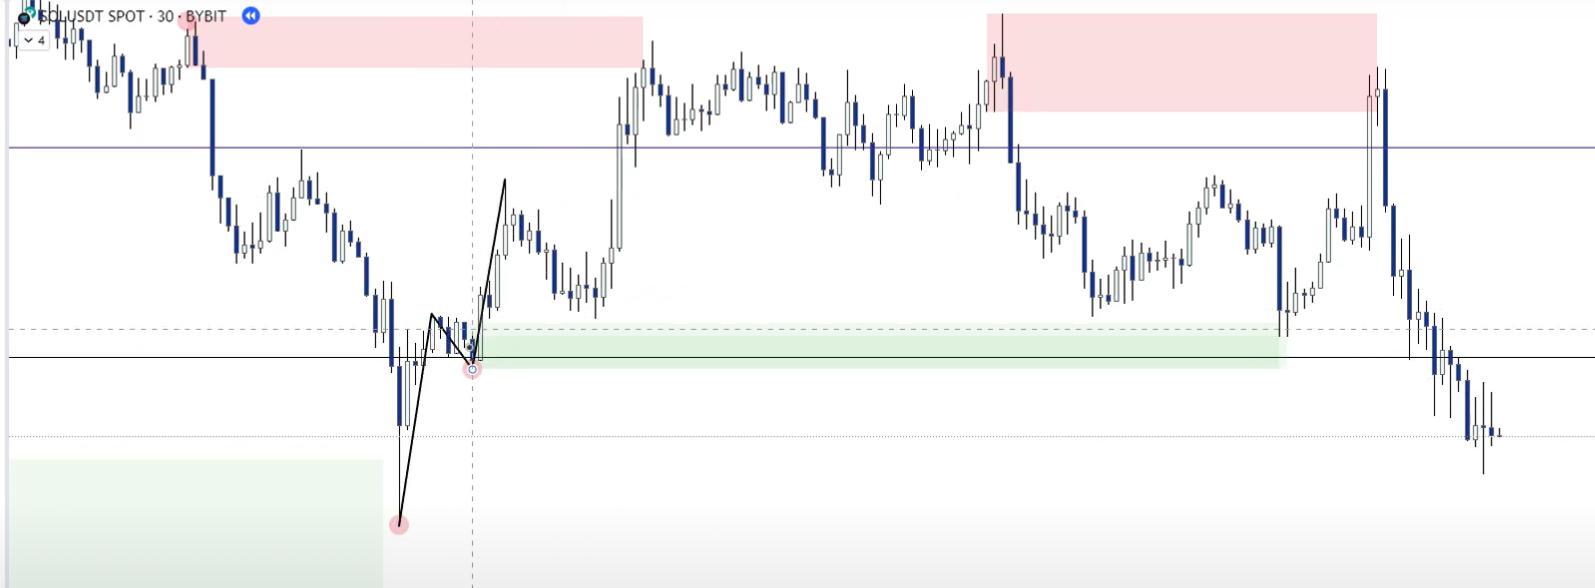
This is a pivot point OB with a bullish reaction later.
Rule reminder: once a zone is mitigated and price has expanded from it (price tapped and moved away), it's no longer used. Look for refined unmitigated areas.
Higher timeframe OBs are better, but even if mitigated on lower TFs they can still work if structure supports them:
Unmitigated on 1D:
Mitigated on 3h:
Still works:
Best case = unmitigated on both high and low TFs.
Macro Range Equilibrium Example
Demand zone with inefficiency:
Another demand zone in the discount zone — two downward candles leading into expansion towards the upside, leaving an FVG:
In these demand zones, look for longs for a rotation upward. A barely-unmitigated supply zone is enough — rejection later confirms:
More demand OBs with bullish reactions:
Extreme Supply and Demand
Extreme Supply = last unmitigated OB before the range high. Often gives a strong reaction or creates the actual range high:
This was the last supply OB until range high which gave a good reaction. The small demand OB made a range low.
Same for Extreme Demand: the last unmitigated OB before range low, often causes the bounce. These zones are crucial for anticipating range creation and macro reversals.
Using knowledge of macro structure + valid OBs, you can predict a range forming between Extreme Supply above and Extreme Demand below — anticipating price behavior before the range becomes obvious.
New range expected to be created from a previous demand OB:
Recap Diagram
Refined zones and overlapping structure:
Mitigations and exceptions:
Strategic context — three ideal locations:
| Term | Meaning |
|---|---|
| OB / OBIF | Order Block (with Inefficiency / Fair Value Gap) |
| Structure Supply | Multi-candle supply zone aligned with trend structure |
| Fair Value Gap (FVG) | Imbalance left between candle 1 and 3 where wicks do not overlap |
| Mitigation | When price revisits and reacts to a zone — renders it "used" |
| Extreme Supply/Demand | Last untouched zone before range high/low – likely to trigger reaction |
| POI | Point of Interest (zone where trade setup may occur) |
| MTF (Multi-Timeframe) | Analyzing zones across daily, 4H, 1H, 15m, etc., to refine accuracy |
| Range EQ | Midpoint of a range – helps define premium (upper) vs discount (lower) |
Reaction Depth: The Real Quality Filter
Whenever price approaches a demand or supply zone, you may expect an immediate reaction to validate strength. You see price touching the area and anticipate sharp rejection or bounce, as if the market is obligated to respond instantly. But sustainable movements often don't happen this way. → The most reliable supply and demand zones
For a move to carry weight and last, it is usually better to see the market spend some time within the zone rather than snapping away from it impulsively.
The reason lies in how orders are processed. A demand zone is essentially a cluster of buy orders waiting to be triggered; a supply zone is a cluster of sell orders. These zones aren't magical price levels — they're concentrations of liquidity. When price tests them, the interaction between resting limit orders and incoming market orders determines the outcome.
If price touches the zone and immediately rejects, that usually means only a thin layer of orders was triggered — enough for a short-lived reaction, but not enough to sustain a lasting move. Once those orders are absorbed, the zone loses strength and price often returns to test it again or even break through.
By contrast, when price actually spends time within the area, a different process unfolds. Orders are absorbed gradually. Smart money often cannot fill positions all at once without pushing the market aggressively, so they allow price to hover inside the zone, absorbing liquidity and executing over time. New participants join the battle, reinforcing the zone and creating a healthier balance. When the market finally leaves after this absorption phase, the resulting move is more likely to be sustainable, because it reflects deeper order flow rather than a shallow reaction.
A common misunderstanding: traders sometimes confuse "spending time in the zone" with "repeatedly testing the zone." They are not the same.
When price consolidates within the zone, orders are filled and liquidity is actively exchanged, strengthening the foundation for the next move. But when price keeps leaving the zone and returning to test it again and again, each touch tends to consume resting orders and deplete the zone's strength. Over time, repeated stabs weaken the area, making it more likely to break.
- Consolidation inside a zone is constructive — suggests absorption and accumulation.
- Multiple rejections with constant retests are destructive — erodes the liquidity that gave the zone its power.
The most reliable supply and demand zones are not necessarily the ones that spark the most dramatic reactions. They are the ones that allow price to breathe and build genuine order flow before moving away.
How long does price have to spend in a zone? It isn't about a fixed number of minutes or hours — it's about what price is doing while it sits in the zone. On a 5m chart, 90 minutes of sideways activity could be a very significant base; on a four-hour chart it's hardly visible at all. Context and timeframe matter the most.
BTC spending approximately 9 hours at this 4H OB + 1D neckline for order pairing is a clean example:
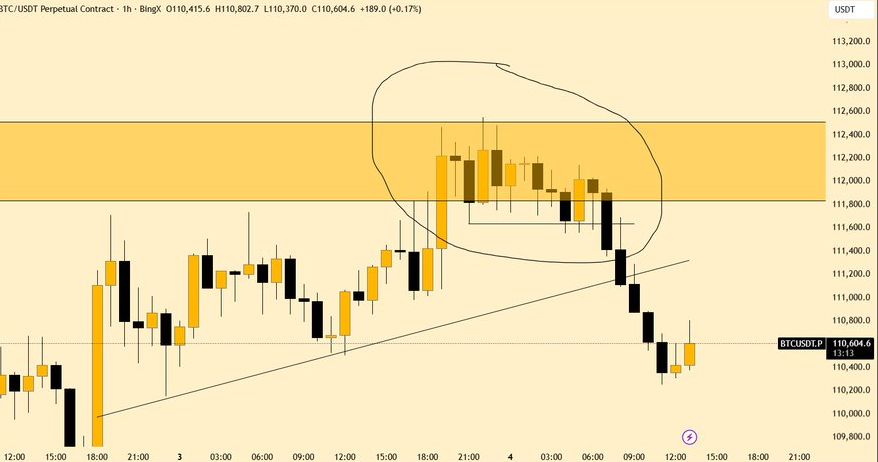
Stabbing wicks at an ATH versus consolidation at ATH: when an asset keeps stabbing at ATH with long wicks and pulling back, those stabs are consuming the resting sell orders sitting at the top — each attempt weakens the barrier, and eventually price often pushes through because there's not enough supply left to hold it. That's the classic "multiple rejections = eventual breakout."
If instead price pushes up into ATH and just sits there, printing tight candles right at or just below the level, that's absorption. The big players who want to sell can distribute orders without the market running away too quickly. That often sets up a stronger move down, because the liquidity needed to offload large positions has been provided during the sideways pause.
The difference: whether price is probing a level from the outside (which tends to lead to eventual continuation through it), or accepting the level and balancing around it (which often sets up a reversal). Context matters a lot.
Qualifying Zones with Volume Profile
You cannot qualify a demand or supply zone based on levels alone — and this is where so many people go wrong. → FRVP Qualifying demand supply areas based on market activity
A horizontal box drawn around a low or high may look neat and convincing on a chart, but in isolation it tells you nothing about the structural participation of the market. A "zone" is only an assumption until the depth of activity within it is qualified, and this qualification cannot be derived from price alone.
Price is simply a print on the tape — the reflection of trades that have already taken place. Without context, without the density of volume showing where business was actually conducted, those levels are hollow drawings.
The FRVP (Fixed Range Volume Profile) is what transforms an arbitrary level into a zone with statistical legitimacy. Market structure is an auction, and auctions don't revolve around arbitrary highs and lows — they revolve around the negotiation of value. The FRVP shows where the majority of transactions occurred within a defined segment, creating a map of the battlefield.
If price taps a level you've drawn as supply but volume data shows it sits in a thin, low-participation pocket, the rejection there is unlikely to be sustained — it's air, not foundation.
If price interacts with the VAH (Value Area High) and is instantly rejected, that rejection is clean evidence that participants are unwilling to reprice value higher — transforming the level from conjecture into a statistically-qualified zone.
If a demand zone aligns with the VAL (Value Area Low) and price builds acceptance above it, buyers are attempting to redefine value upward from the outer boundary of consensus.
The market respects liquidity, and liquidity is embedded in volume. A level may appear to hold price for a moment, but unless the FRVP reveals substantive order flow there, that "hold" is fragile.
This brings us back to mitigation. A mitigated zone sitting at the POC is not the same as an untouched unmitigated zone resting at the Value Area Low. One has been normalized into the market's perception of fair value; the other still carries untested liquidity that can fuel an aggressive move.
You cannot qualify demand and supply without volume, and you cannot contextualize volume without the profile.
How to Apply It
Always anchor your FRVP from a meaningful swing high to a meaningful swing low (or vice versa, depending on the direction of the move). Why? Because this isolates the auction leg — the segment where the imbalance originated.
A swing high followed by an impulsive move down is the beginning of a potential supply structure. A swing low followed by an impulsive move up is the beginning of a potential demand structure. By anchoring across this exact leg, you capture the entire distribution of traded volume that underpins the move.
When you apply FRVP, three critical levels emerge:
POC (Point of Control): the single price level where the most contracts traded. If your supposed demand or supply sits directly at the POC, this level has already been normalized into the market's perception of fair value. Don't expect explosive rejection — it's processed liquidity.
VAH (Value Area High): the upper boundary of 70% of all traded volume. Supply zones overlapping VAH are powerful when price retests and rejects them — they mark the edge of accepted value. If the market refuses to build above that edge, sellers are defending.
VAL (Value Area Low): the lower boundary of 70% volume distribution. Demand zones overlapping VAL gain legitimacy when price retests them and builds acceptance back above. Buyers are showing up to keep value inside the range.
If price drives down from a swing high, leaving behind what you've identified as potential supply, anchor FRVP from that swing high down to the swing low of the move. Immediately you see whether your zone overlaps with VAH or sits in a thin low-volume pocket above value:
- If it aligns with VAH, rejection carries real structural weight — the market defending value.
- If it sits in a low-volume pocket above VAH, it may act like a vacuum where price snaps back quickly but struggles to hold.
- If it's at the POC, don't expect an outsized reaction — that's where the market already agreed value resides.
FRVP Examples
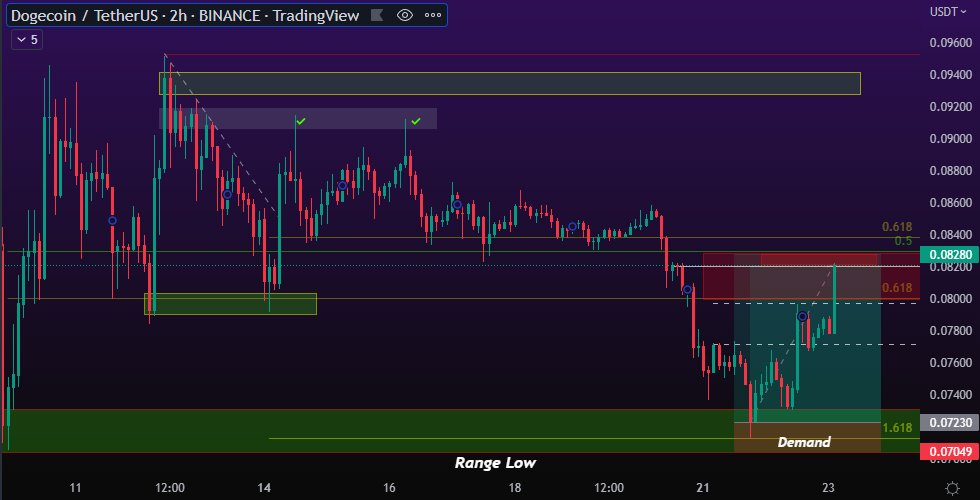
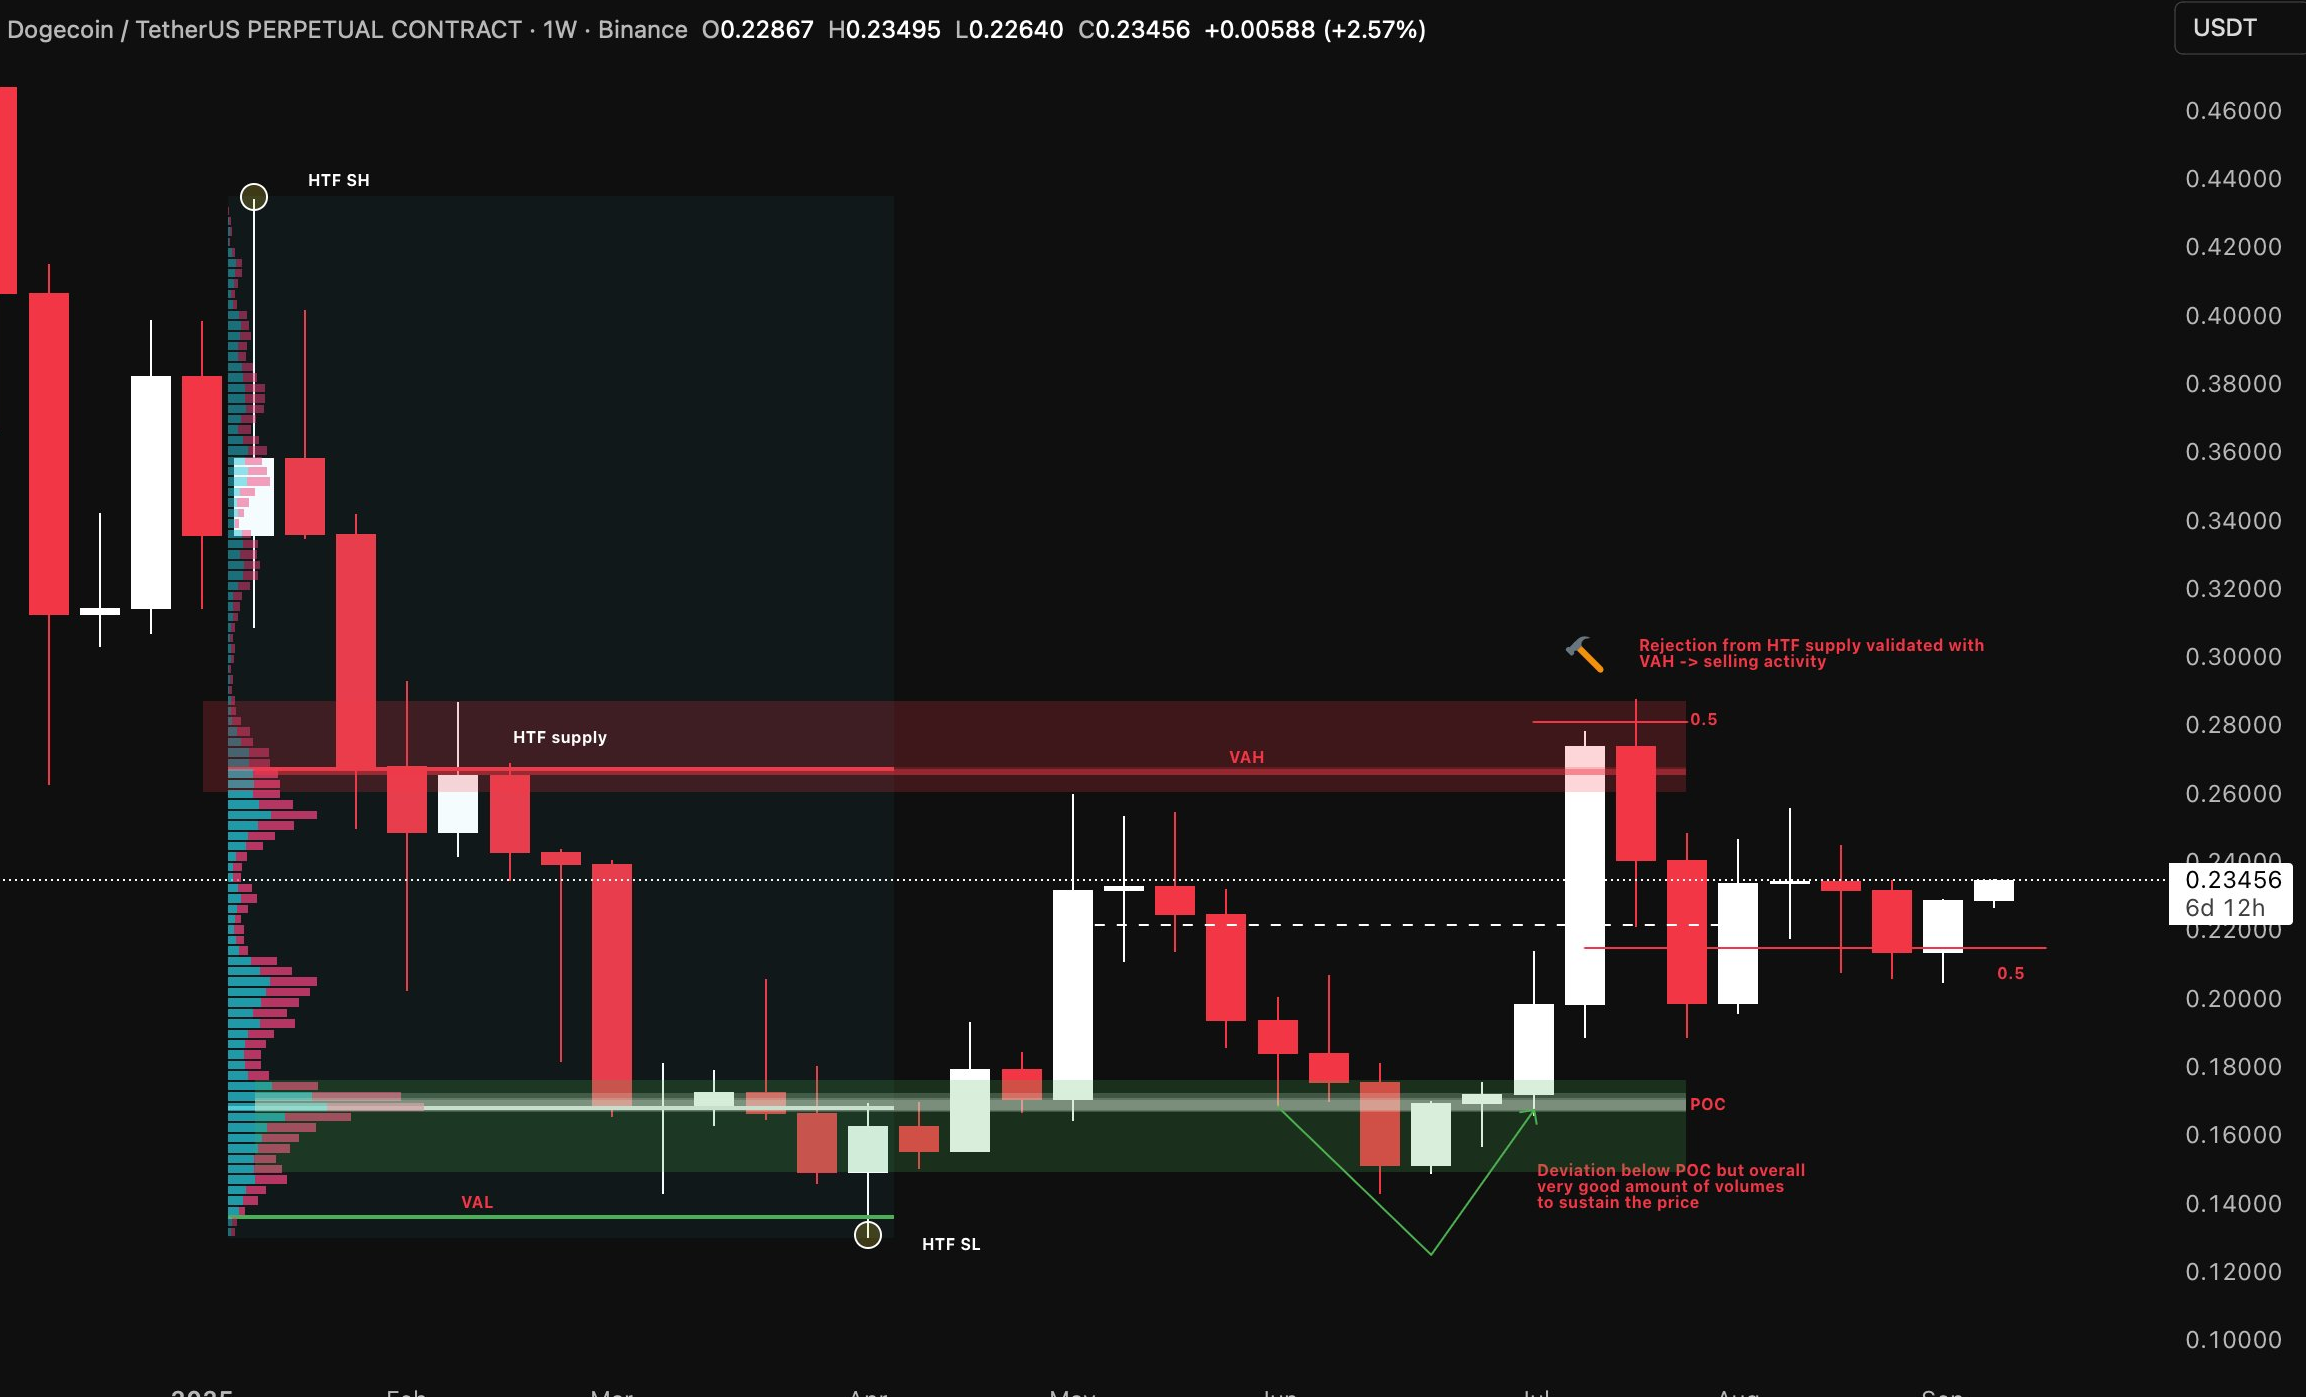
DOGE HTF areas validation (novice level):
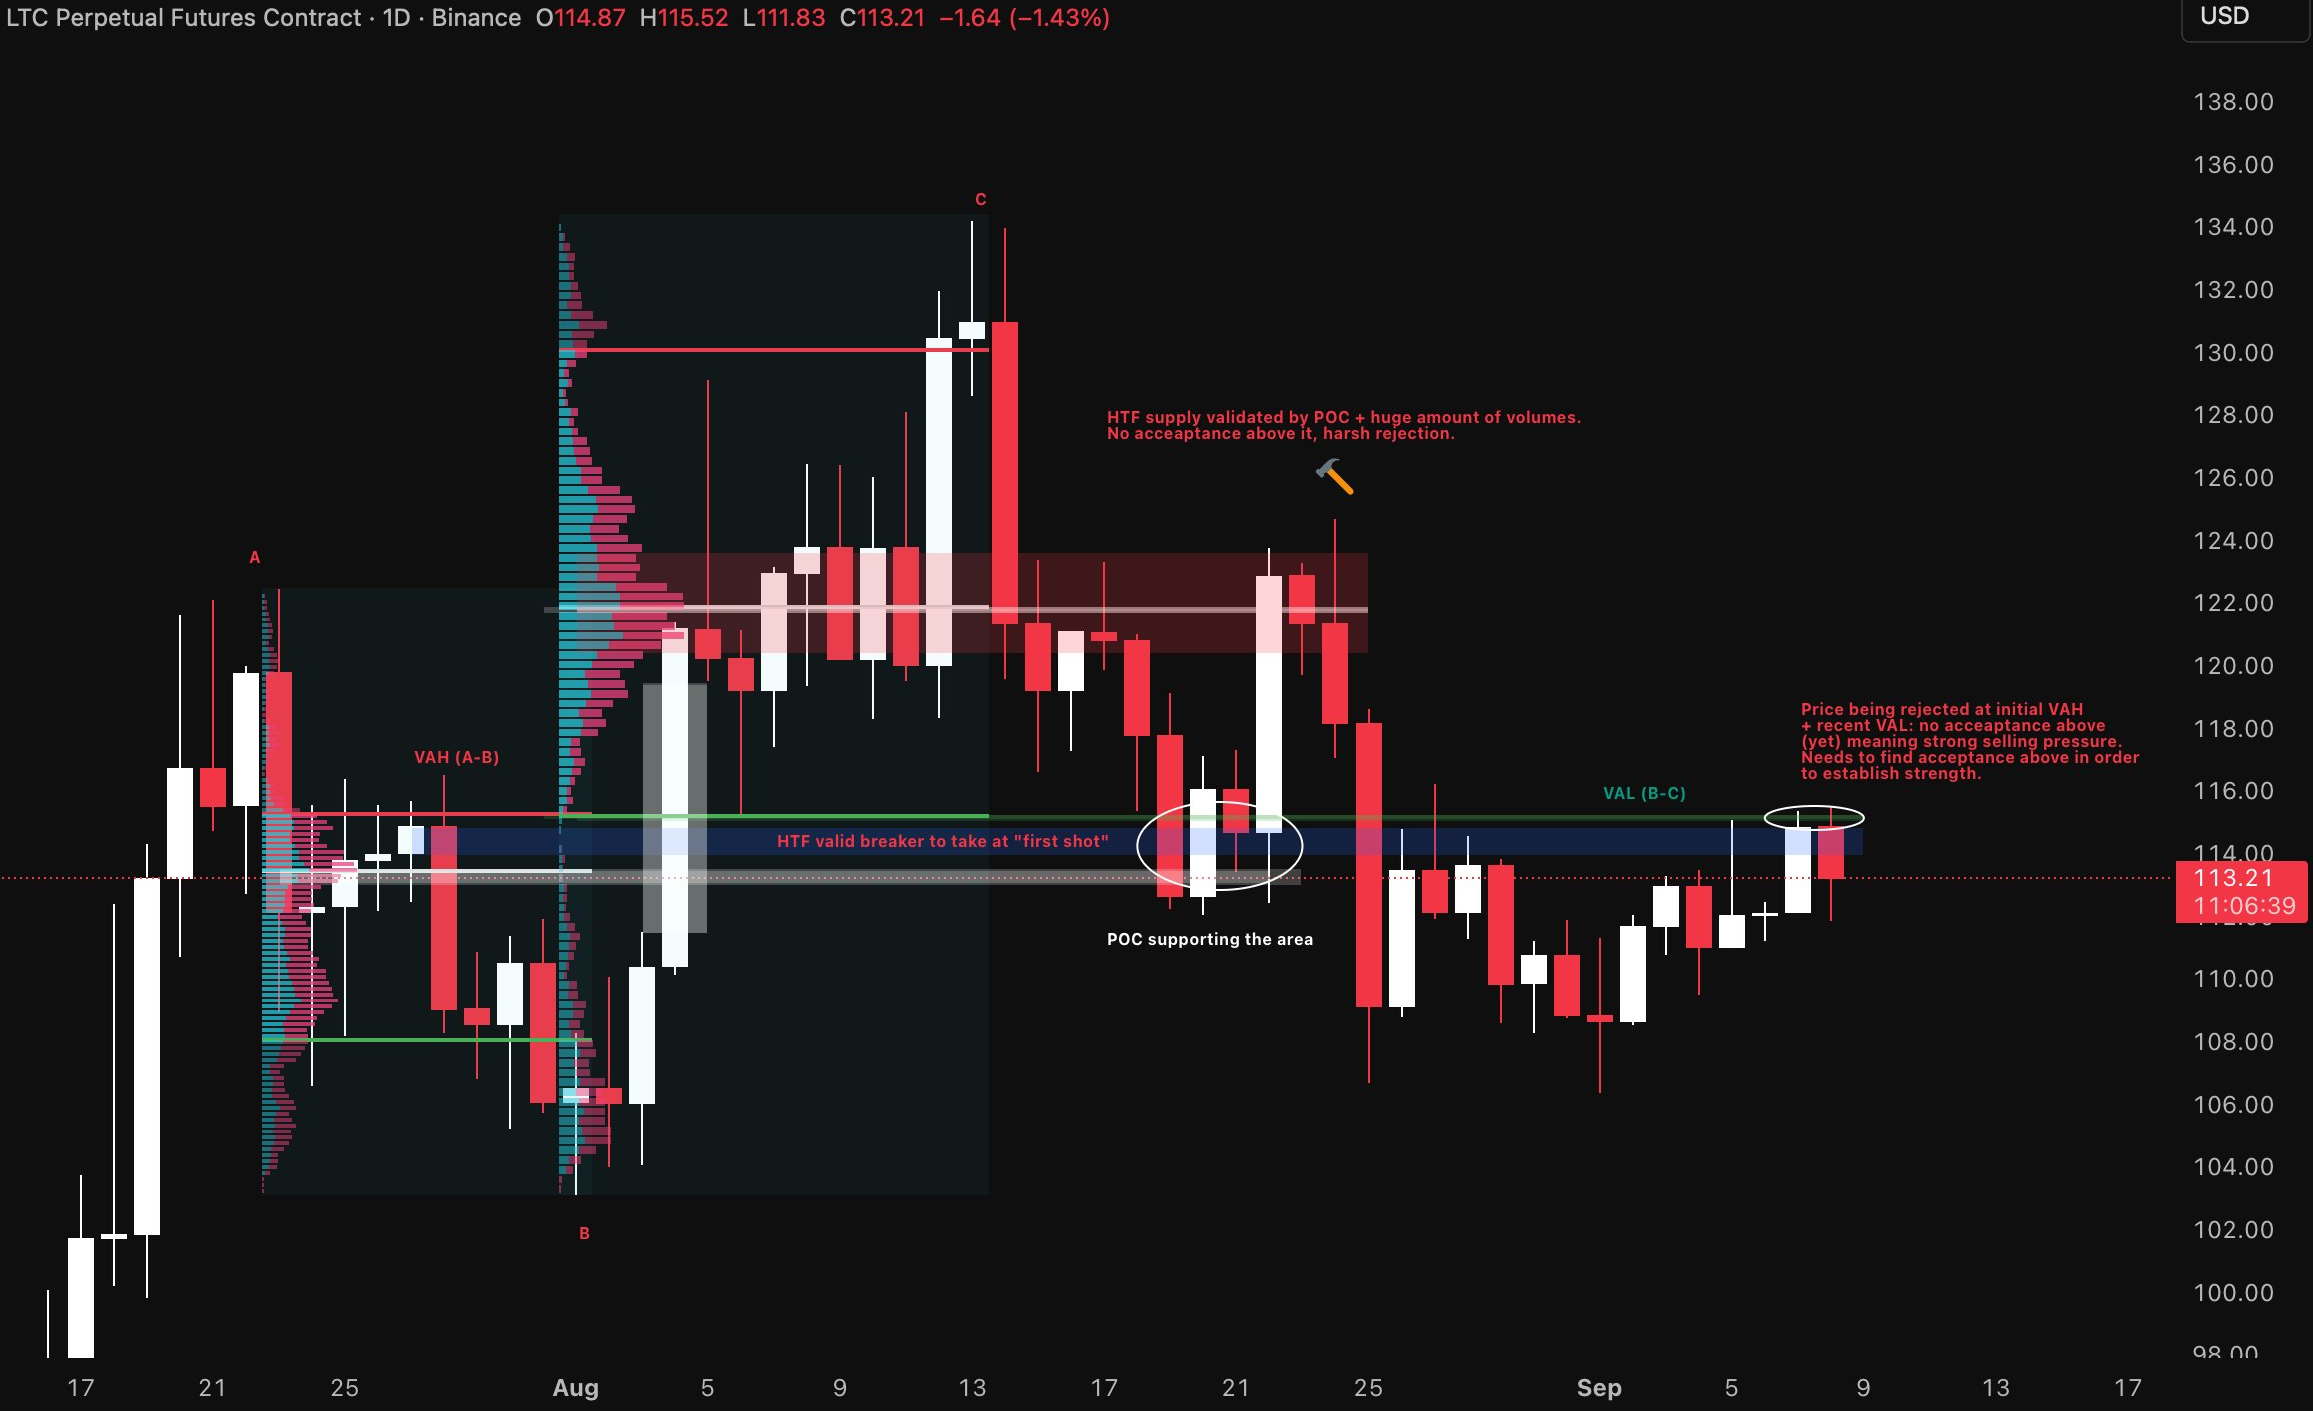
LTC HTF areas validation + breakers (intermediate):
BTC MTF + HTF areas validation, 4× VP (advanced):
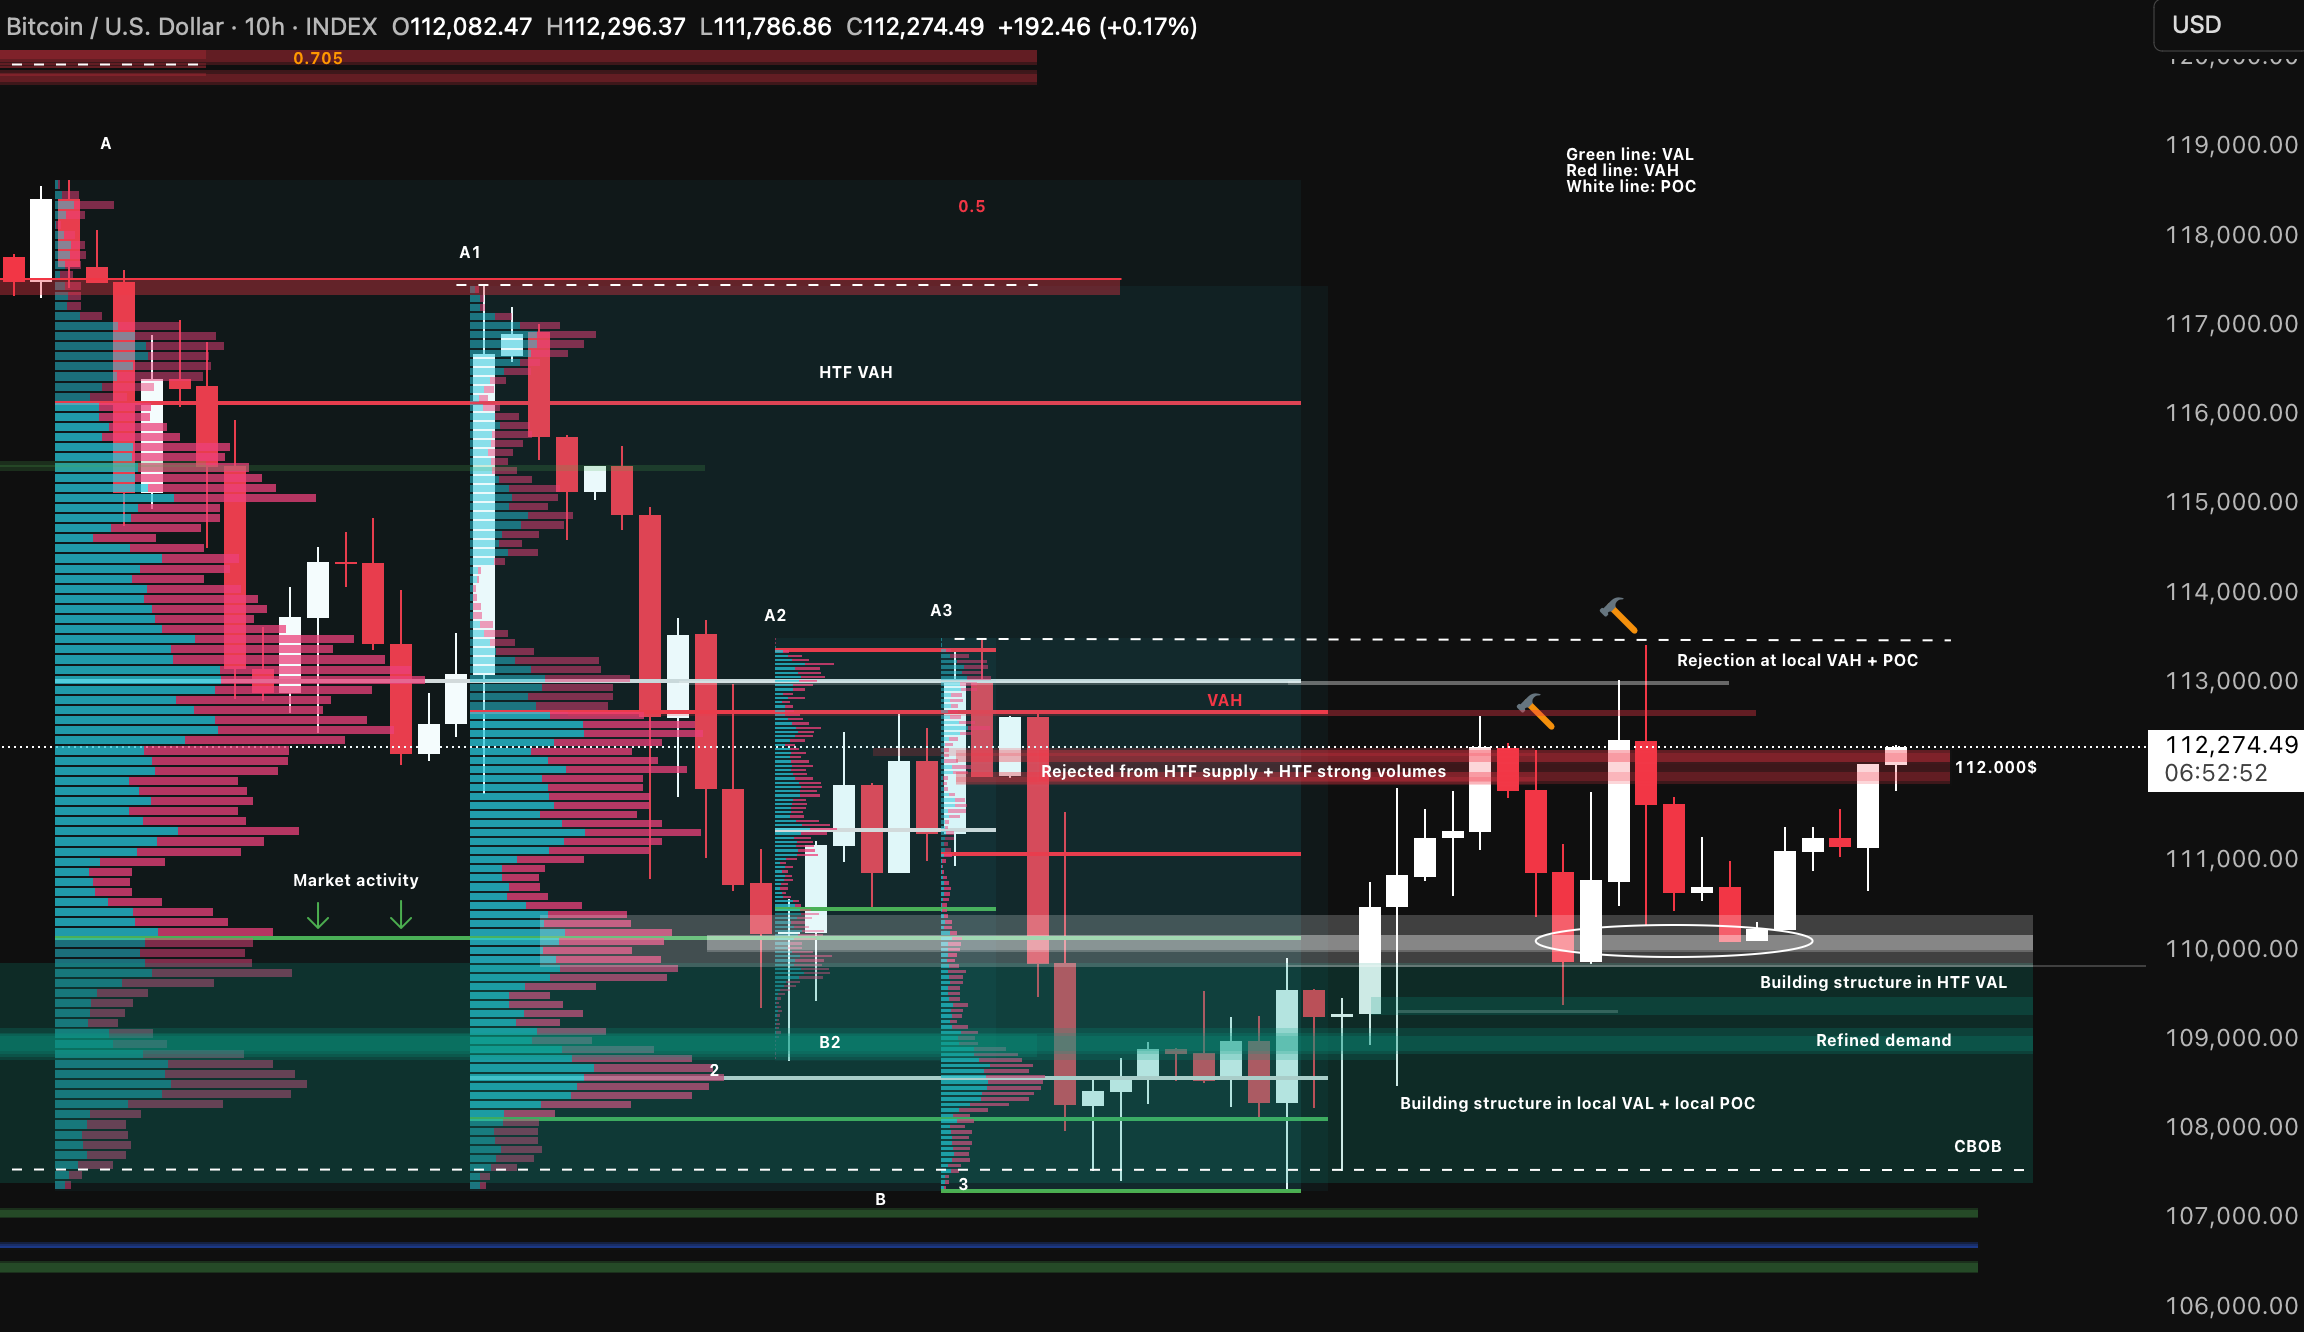
You can overlap VPs to have a clean map of different VAHs/VALs/POCs based on context and timeframe — giving a sound perspective not only on areas, but also on building long and short theses depending on how price action evolves above or below volume clusters.
False Breakouts at S&D Zones
Always treat supply and demand zones as general areas where you look for trade opportunities. Price can often break past it before reversing, creating a false breakout.
TD example:
-20241230141551638.webp)
-20241230141614475.webp)
-20241230141729963.webp)
-20241230141811046.webp)
-20241230141838139.webp)
-20241230141945221.webp)
-20241230142104214.webp)
ETH:
-20241230142550470.webp)
Weekly:
-20241230142442580.webp)
-20241230142613300.webp)
Moving to Daily, then 1H:
-20241230142759518.webp)
-20241230143025386.webp)
HTF examples — weekly/monthly zones = big money movements:
-20241230132650332.webp)
-20241230132820291.webp)
-20241230133008349.webp)
-20241230133036282.webp)
-20241230141156978.webp)
-20241230141339309.webp)
Trade Management at S&D Zones
Knowing when to enter is only half the battle. The most important part of trading is knowing where to exit to maximize gains and limit risk, and what to do when the market pivots on you. → 🔷Entry of Trades / 🔹Position Management / 👑Risk Management / 🔷Taking Profit
Best Case Scenario
-20241230143500746.webp)
-20241230143529316.webp)
-20241230143555344.webp)
Targeting and hitting key supply/demand zones is an effective way to set profit targets, but price won't always get there in picture-perfect fashion.
Scenario 1
-20241230143814445.webp)
You must know exactly what to do every step of the way. Without managing a position correctly, you would have taken a loss on this trade instead of locking in gains while still maximizing more profit. → 🔹Position Management
Scenario 2
-20241230143941299.webp)
Without managing a position correctly, you make irrational decisions that cost a ton of money. → Trail Your SL / 🚨The Worst Mistakes
Scenario 3
-20241230144131780.webp)
Lock in gains but still be able to take advantage if price continues, while protecting yourself in case price reverses. → Trail Your SL / 🔷Taking Profit
In all scenarios, you must know:
- Where do you correctly place your 🔷Stop Loss with your entry?
- Where do you move your stop loss if there's a trend change before price reaches your target — to lock in gains and avoid being hit by accident before a massive winning trade? → Trail Your SL
- How do you manage your position to maximize gains while protecting yourself from losses? → 👑Risk Management / 🔹Position Management
What Success Looks Like
Achieving success in S&D trading requires developing expertise in identifying high-probability zones and accurately marking them on the charts. This process takes time, practice, and experience to perfect. → To Succeed / Success
The critical rule: identify sharp price movements, which indicate banks are either buying or selling. These movements typically originate from a Supply or Demand zone and reveal the presence of an imbalance in the market. → 🎁Hidden Liquidity Levels
S&D trading isn't just about buying low and selling high. It's about understanding where big players are placing their bets and aligning with them. When you see price making sharp moves away from a level, it indicates an imbalance — either in supply or demand. Recognizing these imbalances is your gateway to trading like the pros.
Only a complete amateur takes longs when ETH and ETH/BTC hit HTF supply. The ones who win are those who watch the institutional footprint, wait for it to fully form, and step in beside the banks at the moments of clearest evidence.
Find, wait, play, win, repeat.