Break of Structure and Change of Character
Most traders lose money at breakouts. They see green candles pushing past a level they've been watching for days, feel the FOMO, and click long — only to watch price reverse, take their stop, and continue in the direction they originally expected. This lesson teaches you how to read breakouts the way the people on the other side of those losing trades read them: through structure, not through hope.
What a Break of Structure Actually Is
A BOS — Break of Structure — represents a shift in market trends. When price breaks above or below a significant level, it's signaling a potential reversal or a continuation of the existing trend. That's the definition. The hard part isn't the definition — it's separating real BOS events from the dozens of fake ones the market prints every week to trap retail.
Both BOS and CHoCH come from the Smart Money concepts world, which is the modern adaptation of institutional trading concepts.
- BOS is the acronym of "Break Of Structure"
- CHoCH is the acronym of "Change Of Character"
A BOS is when a high or a low is being violated, leading to a change in the trend on LTF. A CHoCH is a shift in the market's trend indicating that the previous trend may be losing momentum and that a new trend is emerging.
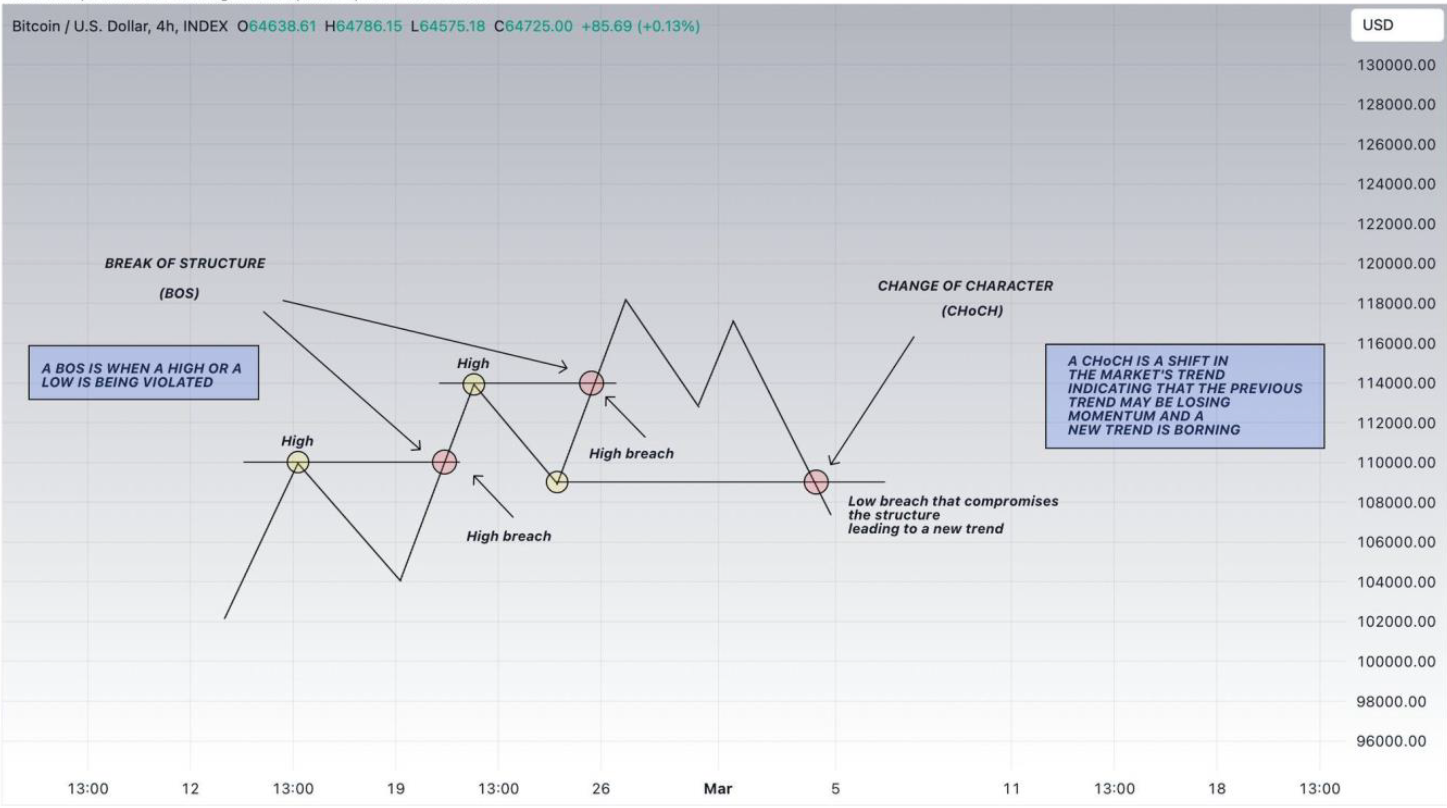
A CHoCH is also always a BOS, but a BOS is not always a CHoCH.
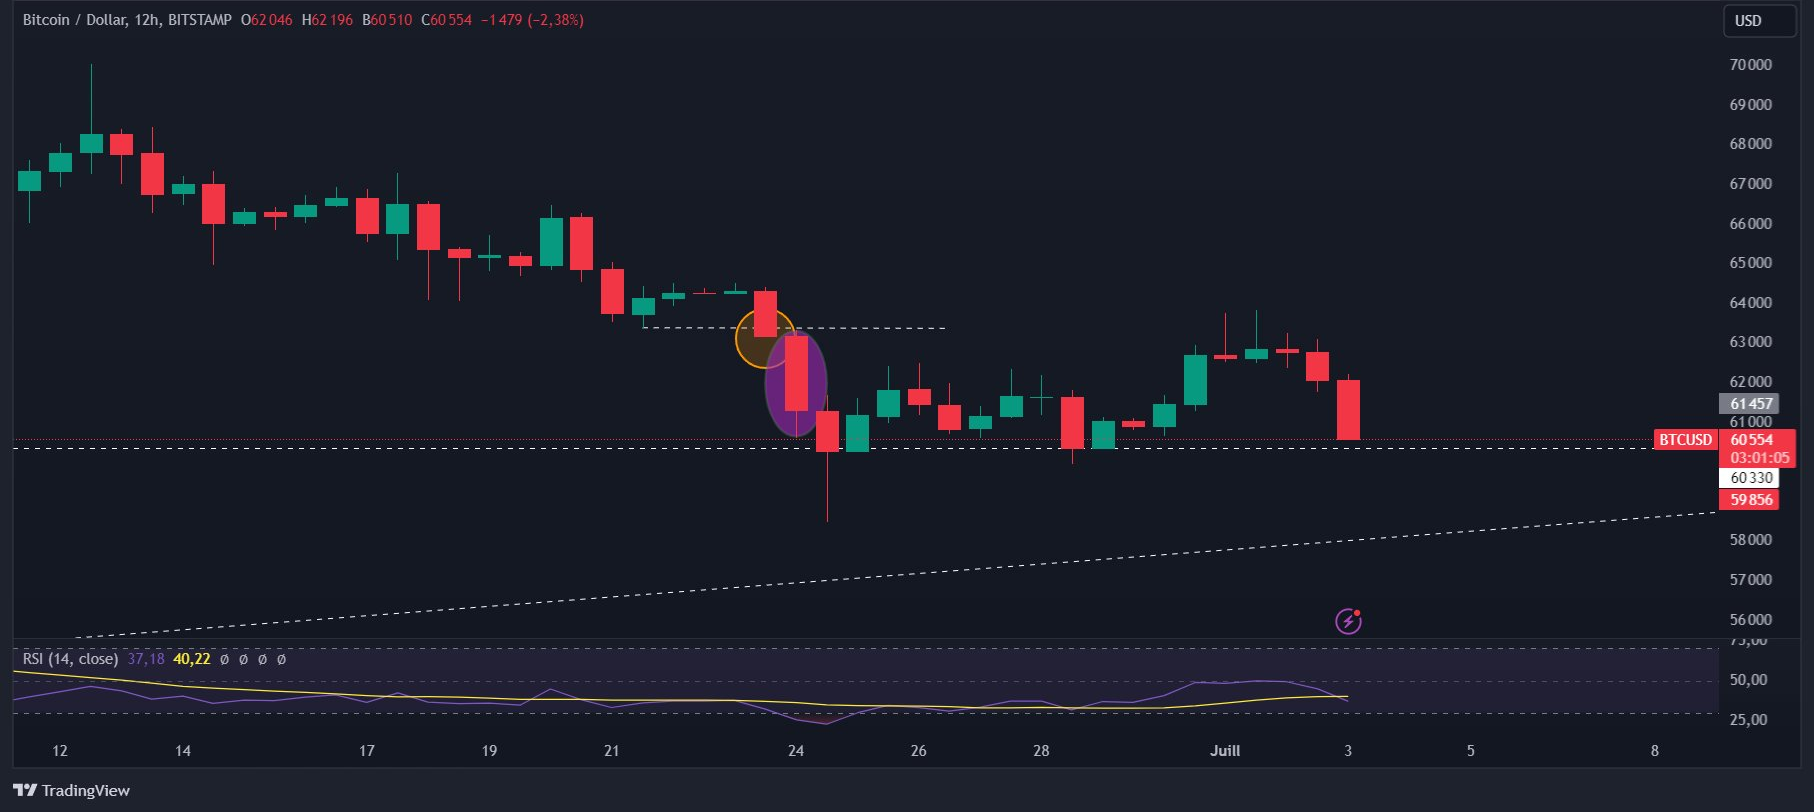
Here's a concrete example on the 4H Bitcoin chart:
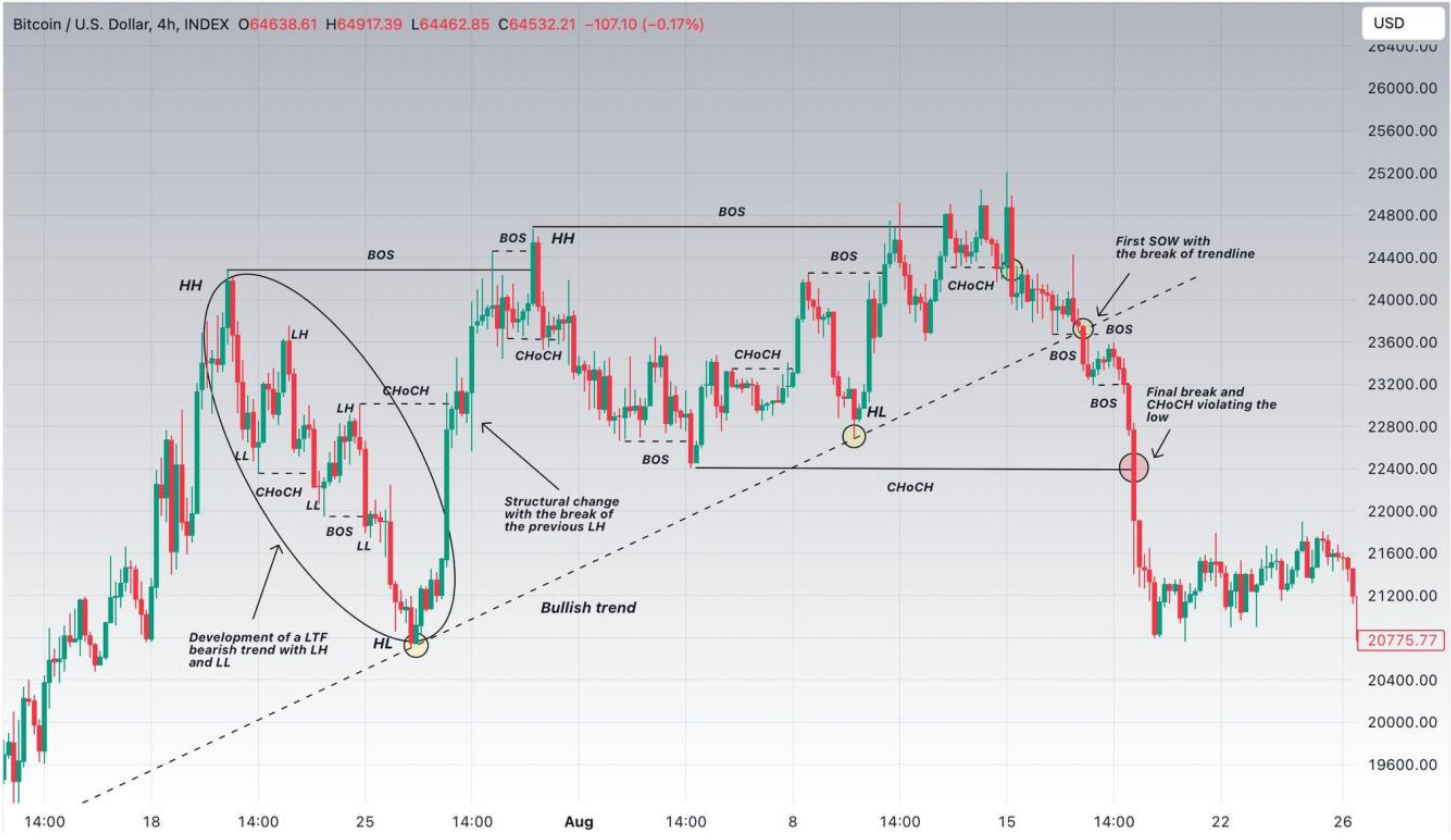
Inside an HTF uptrend (notice the trendline), shorter trends can develop — like the one inside the black ellipse. In that case, Bitcoin created a LTF bearish trend where the first CHoCH was identified with the red candle that violated the previous low (look for the wick). Subsequently, a BOS was created with the continuation of the trend breaking the recent low.
Conversely, you'll see a structural change with a bullish impulse (CHoCH) and the break of the previous lower high, shifting the trend from bearish to bullish. At some point, Bitcoin started breaking down from the trendline — the first sign of weakness — and then a final confirmation came with a strong bearish impulse that demolished the lows, creating a significant CHoCH.
These abbreviations aren't complicated. They simply represent LTF or HTF shifts in a market trend.
The Single Rule That Filters Out Most False Breakouts
Before anything else, learn this:
A wick doesn't confirm it broke. It's a False Breakout. A body does. Bodies hold institutional trading volume. Wicks can hold no liquidity on them.
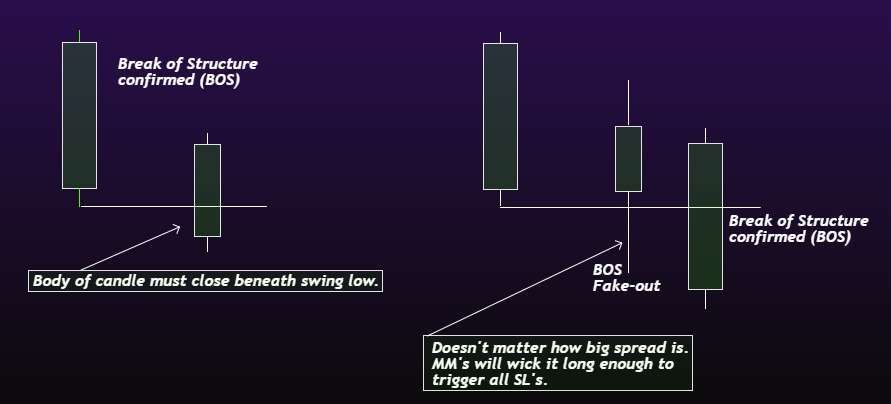
Wait for 4H+ candle body closures above or below liquidity levels. If price doesn't close the body and just leaves a wick, it's a false move. Aggressive up wicks are just manipulation to stop and liquidate less experienced traders — see 🌊Liquidity (+Wicks).
Go through lower TFs, and if all levels found aren't taken with bodies, they're not broken. Wicks confirm nothing.
When students ask what I'm looking for in terms of confirmations — whether it's FVG, GP, fibs, or trendlines — the answer is the same:
HTF body close above/below previous HTF swing high/low. BOMS.
How High a Timeframe Do You Need?
The higher the timeframe, the more powerful the confirmation. The framework I use most:
- 4H close on lower MTF. 2H+ can act as a first signal (and for LTF). A 4H+8H combination gives higher probability.
- 8H close on higher MTF. An 8H close can also be a first signal for continuation on HTF plays. If you're looking for an entry or adding size, wait for the 8H+ close.
- 12H+ close for HTF trades.
- Weekly+ closes for macro (very HTF) tops.
For Bitcoin and ETH specifically, it's best to be Daily.

For high trading volume coins, 12H is acceptable. For lower-volume altcoins, you want a full daily block. As one student asked whether a 12H close could count as HTF — without a full OB on any TF and no Daily, that's weak.
When PEPE printed a 1D close above and a student asked why I didn't take it as confirmation:
Best if full block. 12H only on high trading volume coins instead of any altcoin. More powerful if seeing 2D or higher closing above.
For KAS, the same principle applied — and the question of whether a 4/8/10H close below invalidated a level had a clear answer:
On altcoins, if there's MTF candle bodies closing past your level, it is broken. So, don't chase a reversal as your level is "dead" and you're just gambling/hoping. Find the next 🔑 levels instead and wait for them to hit.
Body, Wick, and What "Close" Actually Means
This question comes up constantly: when I talk about closing under or above a level, must the whole body close above/below the level, or just the close?
The answer is found in the hundreds of charts I've shared:

Partial body is enough. The point is that there's body — not just whisker — past the level. On SOL 🎁 in October 2024, this distinction is what kept me out of bad shorts:
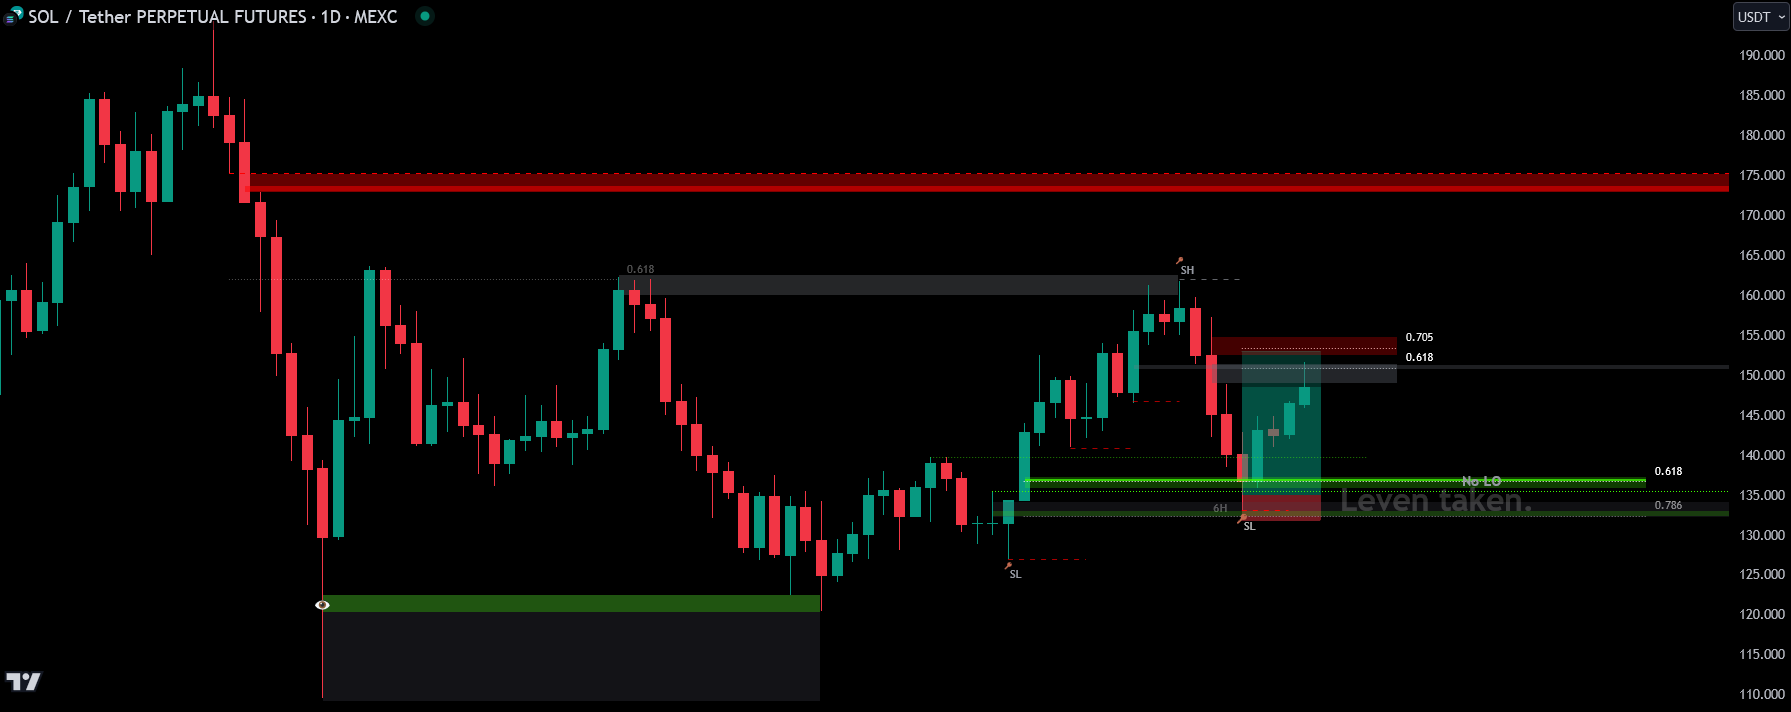
You can go through timeframes up to 2H, and you'll notice there are no candle bodies closing below the level where the 2D BB is at. The hint is there. From here I'll wait for key SH / SL to be taken and find an entry on pullback/retracement.
0 candle bodies closed below 2D BB. B-O-D-Y, not whisker.
For SOL 🎁, because it's a high TV coin, at least a 2H full body is the minimum.
The Three-Step Process
Once you understand body closes, the actual play is simple. It's three steps:
1) Close above key SH or below key SL. 2) Pullback into a key level. 3) Continuation.
That's it. Find > Wait > Enter > Win. Never chase — always strategize.
The first step is what most of this lesson is about. The second step is where retail loses, because retail doesn't wait for the pullback. They long the breakout itself.
Why You Never Long the Breakout
Most retail traders will long the BO, and I keep preaching to never do it, because it's a trap 9 out of 10 times. They can take a 10 to 20% success rate on it and stay on those losing strategies for perpetuity. Certain indicators, patterns, and basic strategies have some % success rate — but they're ultimately losing strategies. The game is designed to make retail believe these basic strategies work. In terms of becoming consistently profitable, they don't.
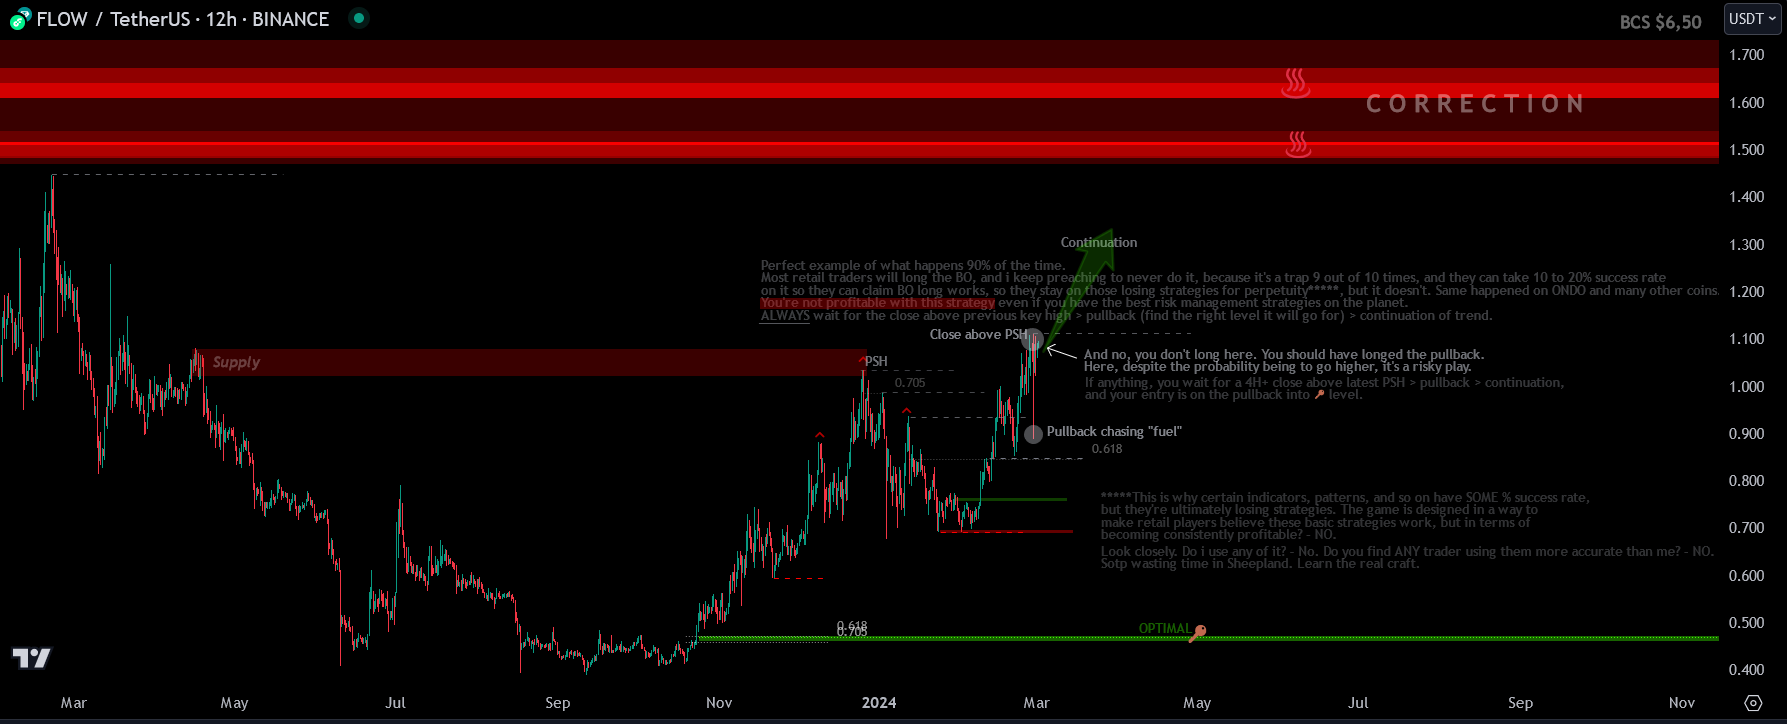
This is what happens 90% of the time. Same on ONDO, same on countless other coins. You're not profitable with this strategy even if you have the best risk management on the planet.
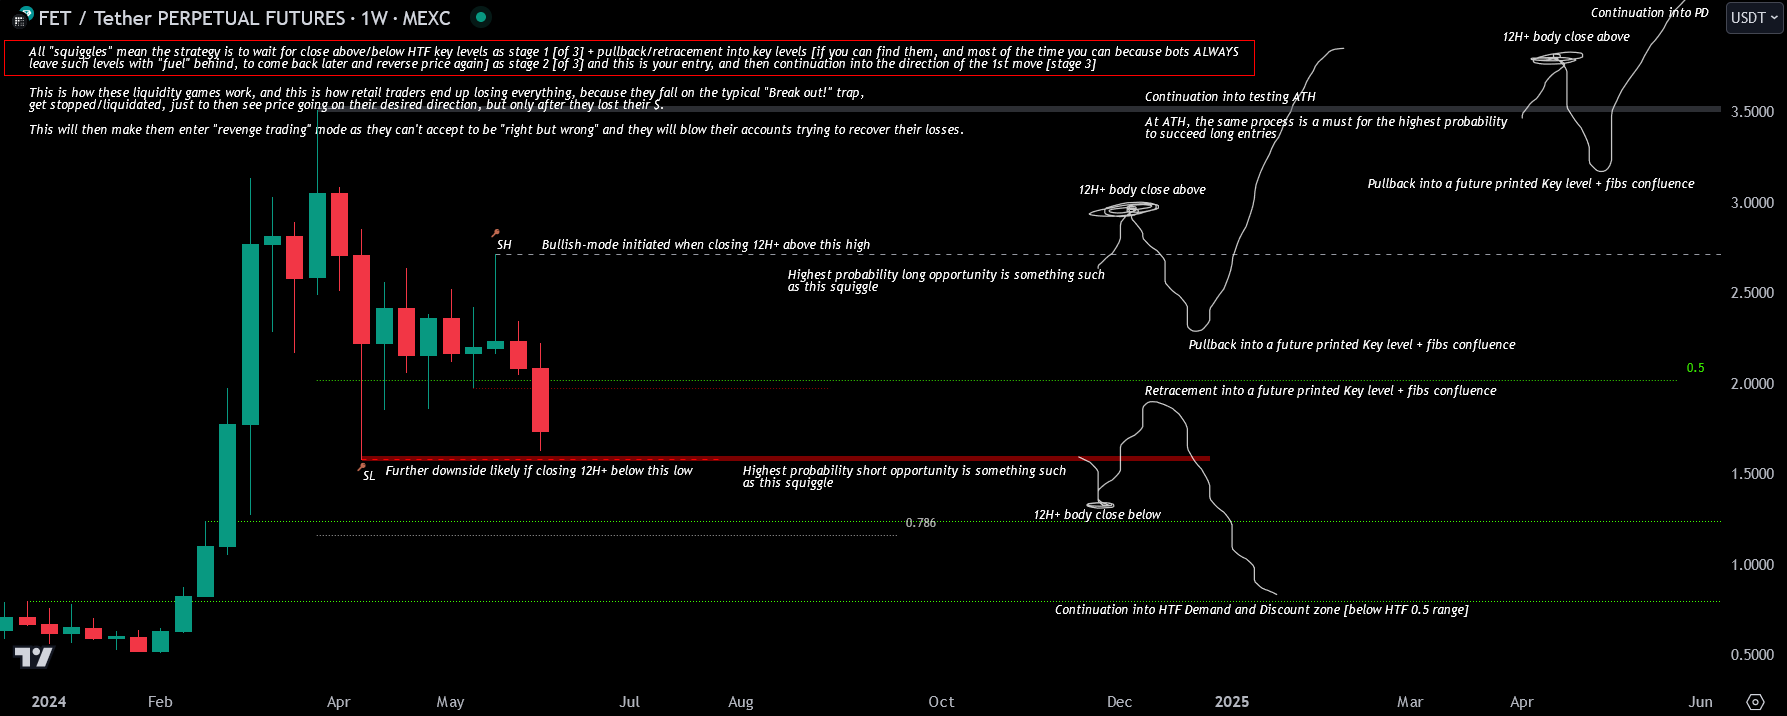
ALWAYS wait for the close above previous key high > pullback (find the right level it will go for) > continuation of trend.
When WLD looked like it might break out:
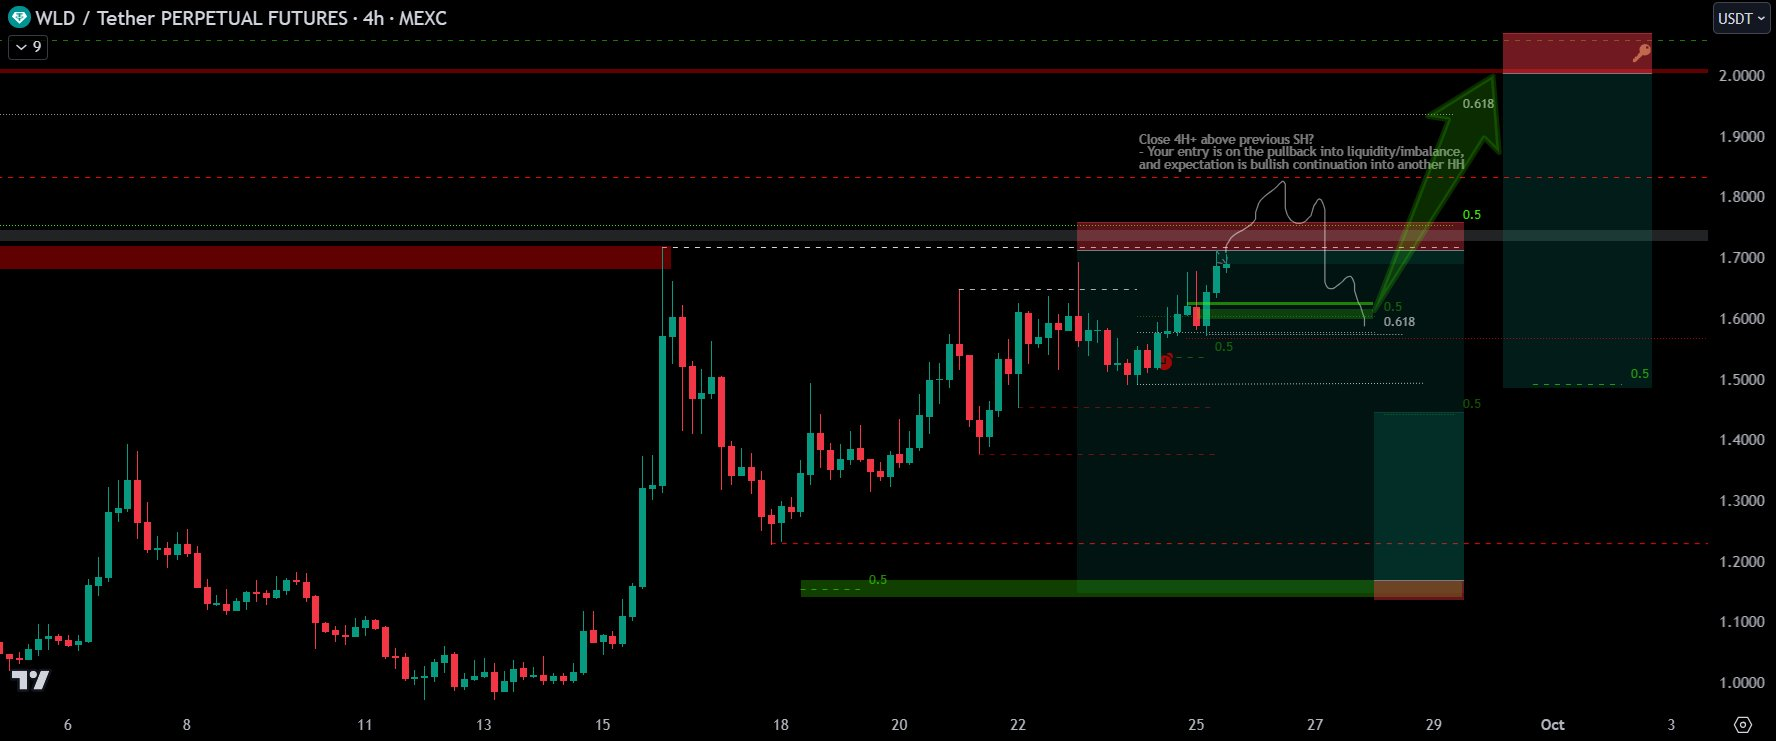
If it does this "squiggle" — which would be a BO — don't chase. See ⚠️ Never Chase.. Wait for pullback into liquidity (or imbalance) before continuation.
Retail traders will buy/long any BO regardless of whether it's confirmed. They can't identify if it's confirmed or not. Price will most of the time pull back, stop them, and then continue in their desired direction. This not only grabs more "fuel" for continuation, but makes retail enter "revenge-trade" mode, which strengthens the move.
Confirmed change of Trend from bullish to bearish happens when it breaks below previous swing lows.
Each Key Swing High Is an Opportunity
There's a single line I want you to absorb:
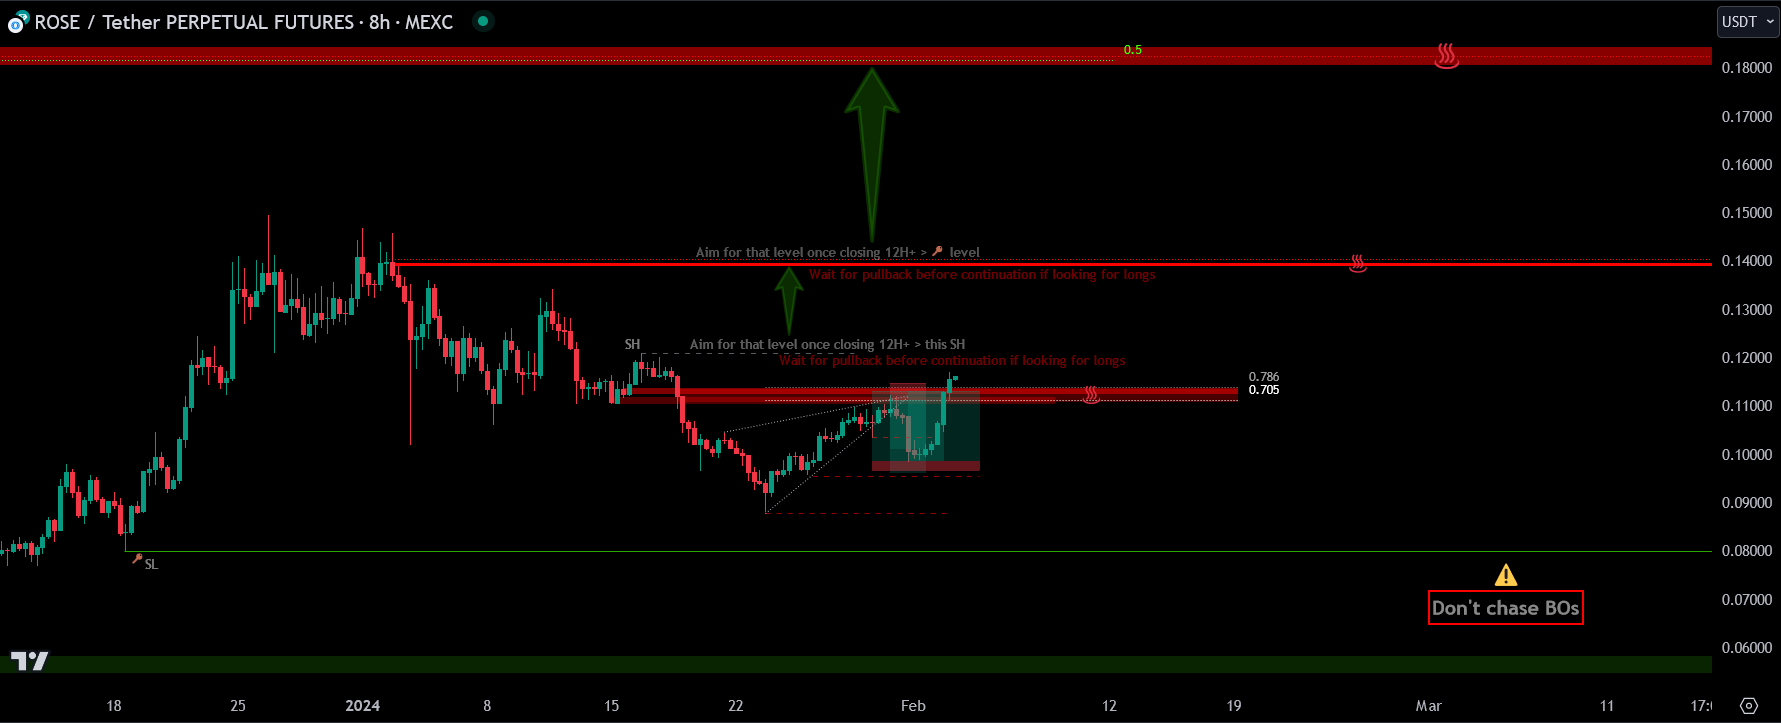
Each key SH is an opportunity to avoid chasing a breakout and waiting for a pullback into a key level before bullish continuation.
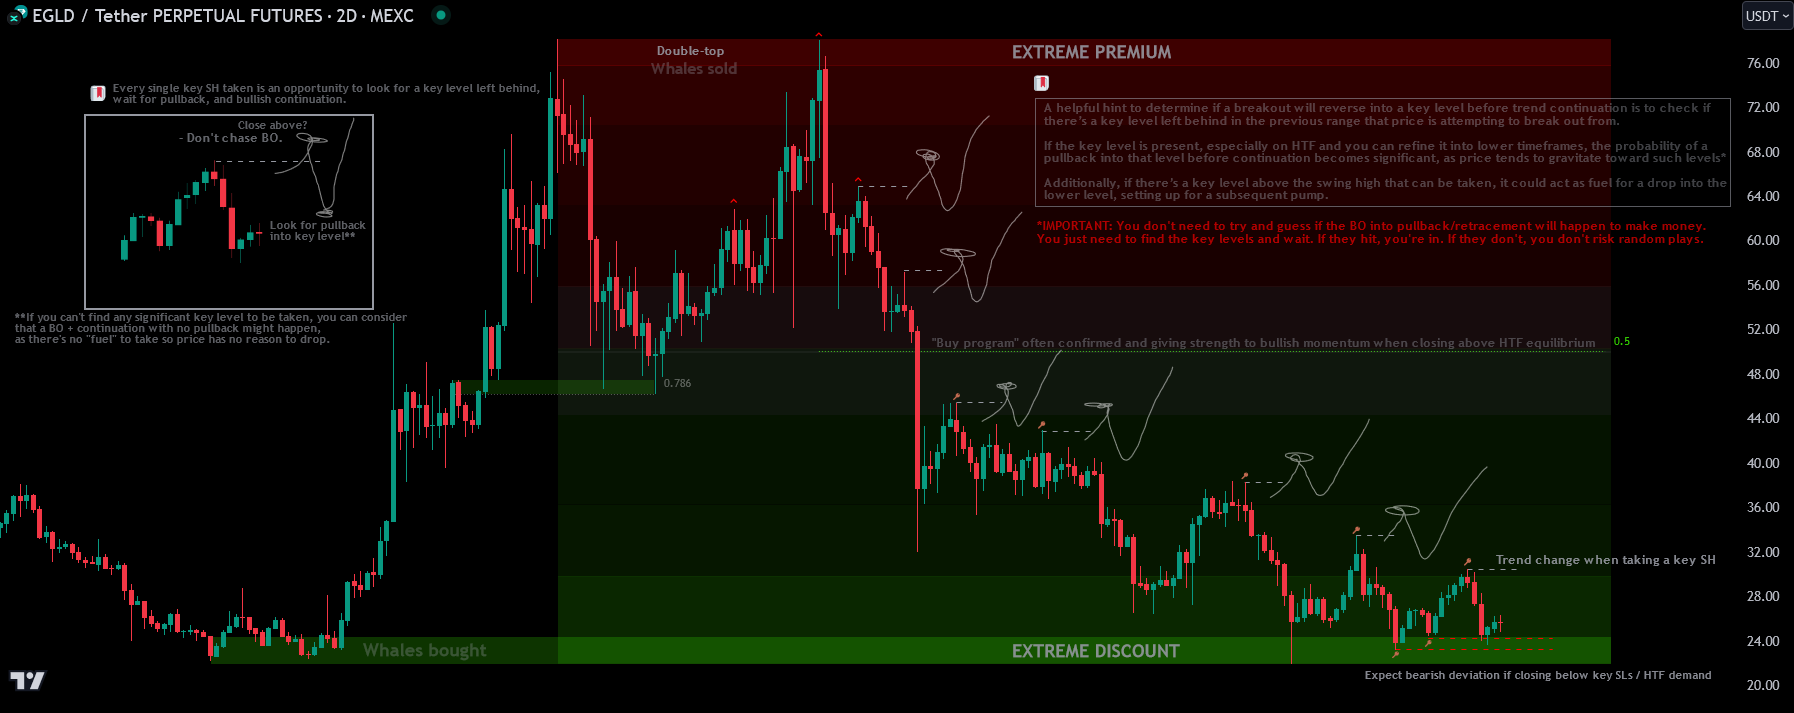
Every single key SH taken is an opportunity to look for a key level left behind, wait for pullback, and bullish continuation.
If you can't find any significant key level for price to pull back into, you can consider that a BO + continuation with no pullback might happen — there's no "fuel" to take, so price has no reason to drop.
A helpful hint to determine if a breakout will reverse into a key level before trend continuation is to check if there's a key level left behind in the previous range that price is attempting to break out from. If the key level is present, especially on HTF and if you can refine it into lower timeframes, the probability of a pullback into that level before continuation becomes significant — price tends to gravitate toward such levels.
Additionally, if there's a key level above the swing high that can be taken, it could act as fuel for a drop into the lower level, setting up for a subsequent pump.
You don't need to guess if the BO into pullback will happen to make money. You just need to find the ♨️Key Levels🗝️ and wait. If they hit, you're in. If they don't, you don't risk random plays.
ETH in March 2025 — only took a couple months for this to play out:
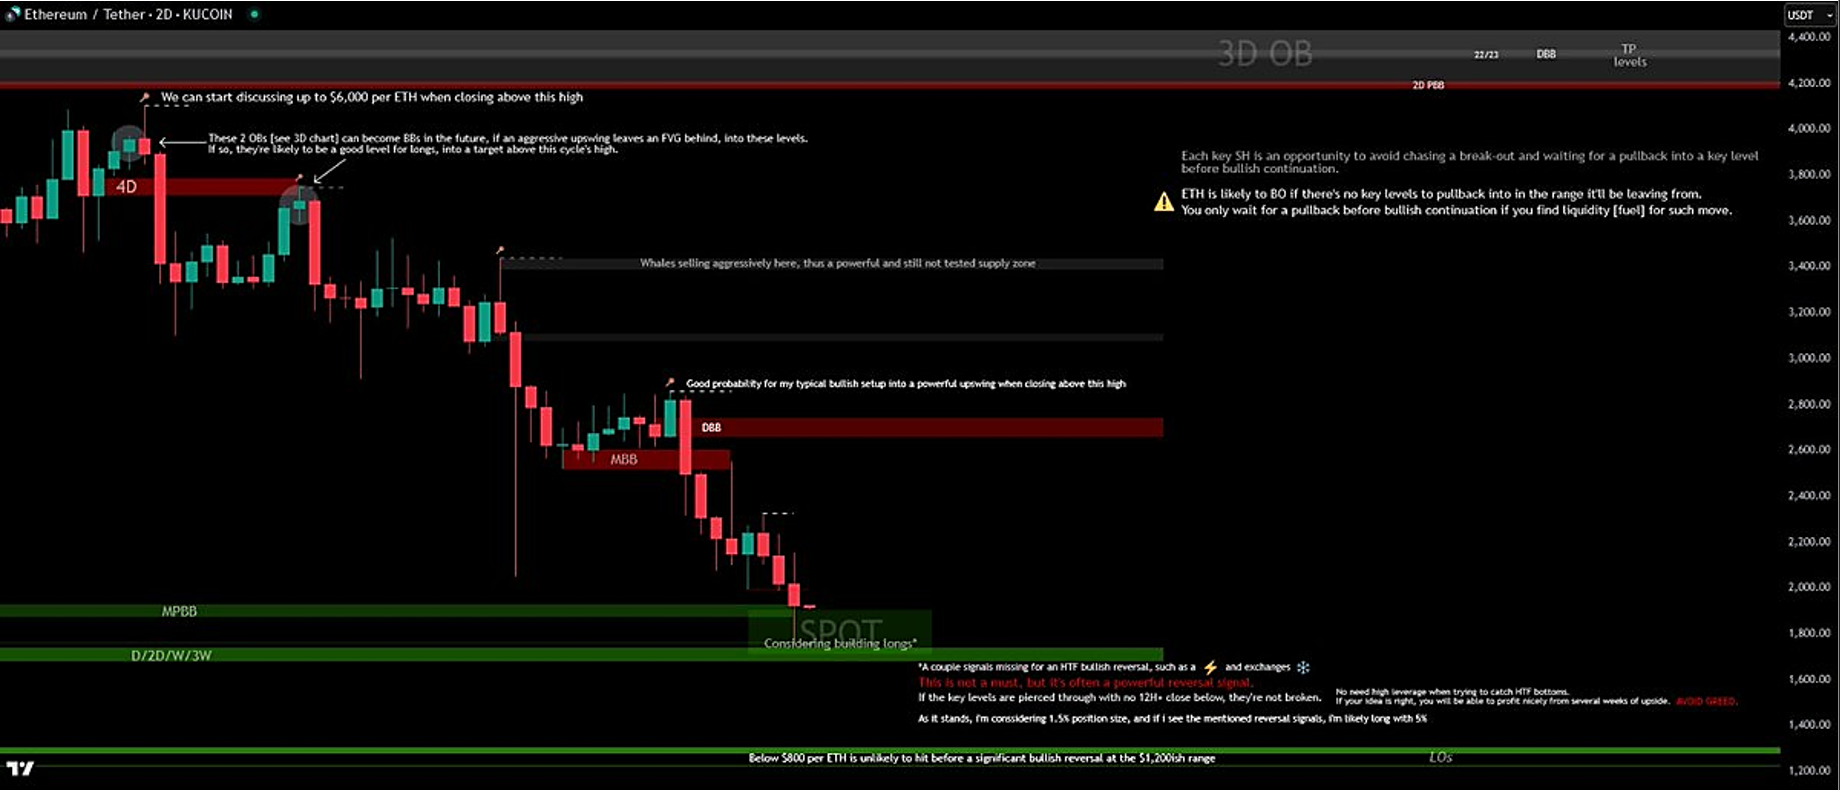
ETH is likely to BO if there are no key levels to pull back into in the range it's leaving from. You only wait for a pullback before bullish continuation if you find liquidity (fuel) for such a move.
Real Examples of the Pattern
INJ, December 2023:
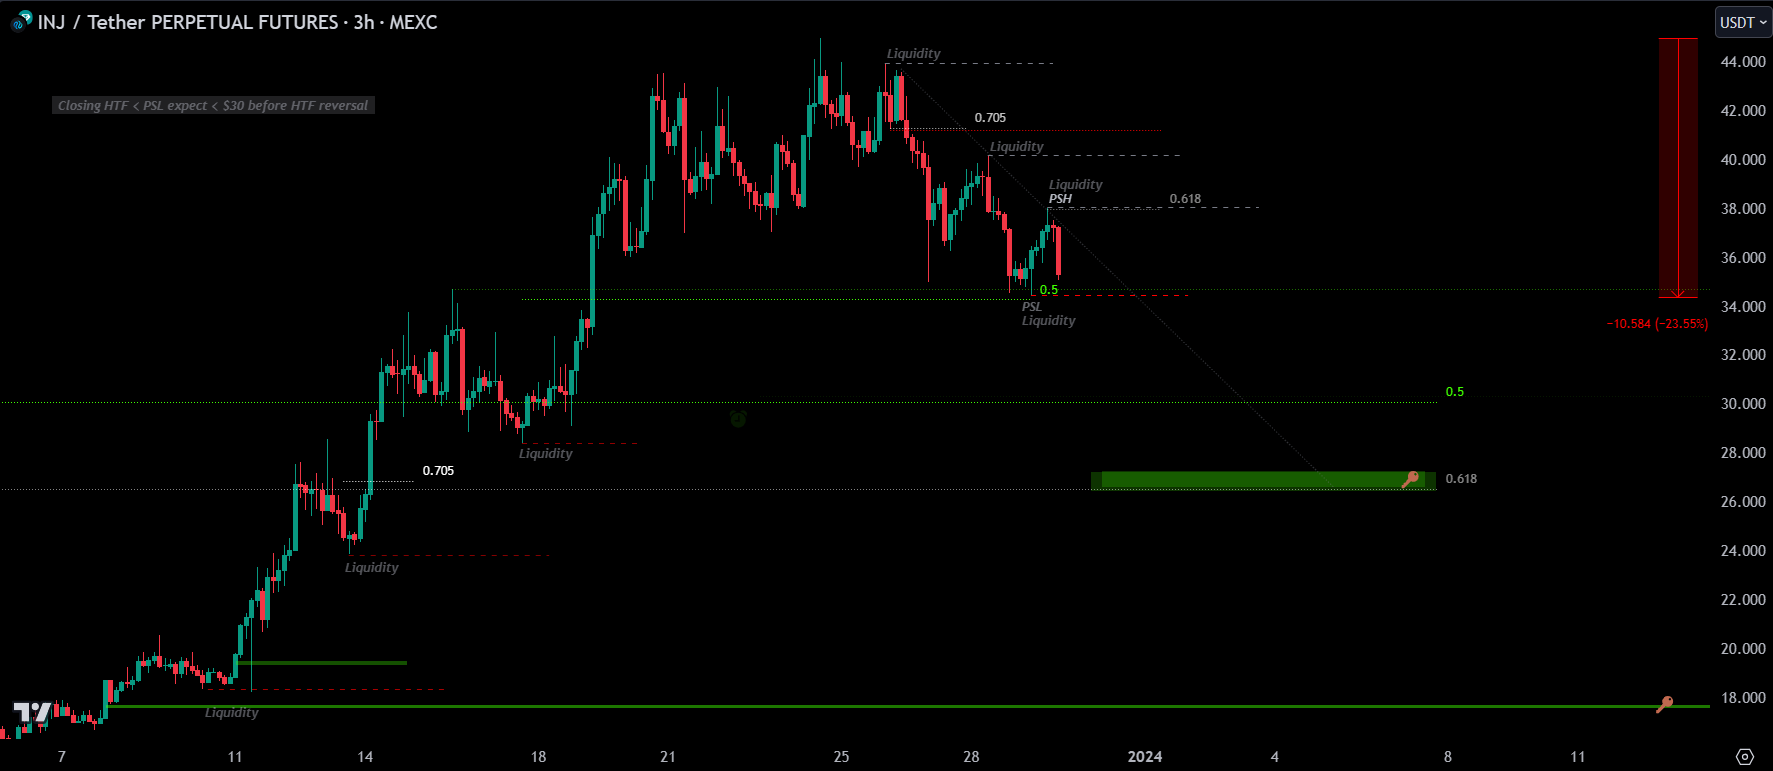
- Close MTF > PSH: start going for liquidity at higher levels.
- Close MTF < PSL: go for 0.5 fib (at least) of the HTF range. See Ranges.
Is it better to look for breakouts in the same timeframes where PSL/PSH were marked, or marking levels in HTF and looking for breakout in MTF?
HTF and MTF — the higher, the more powerful. LTFs to refine entries into the best R:R possible. See 🔷Risk Reward and 👑Refine or Ultra-Refine Plays.
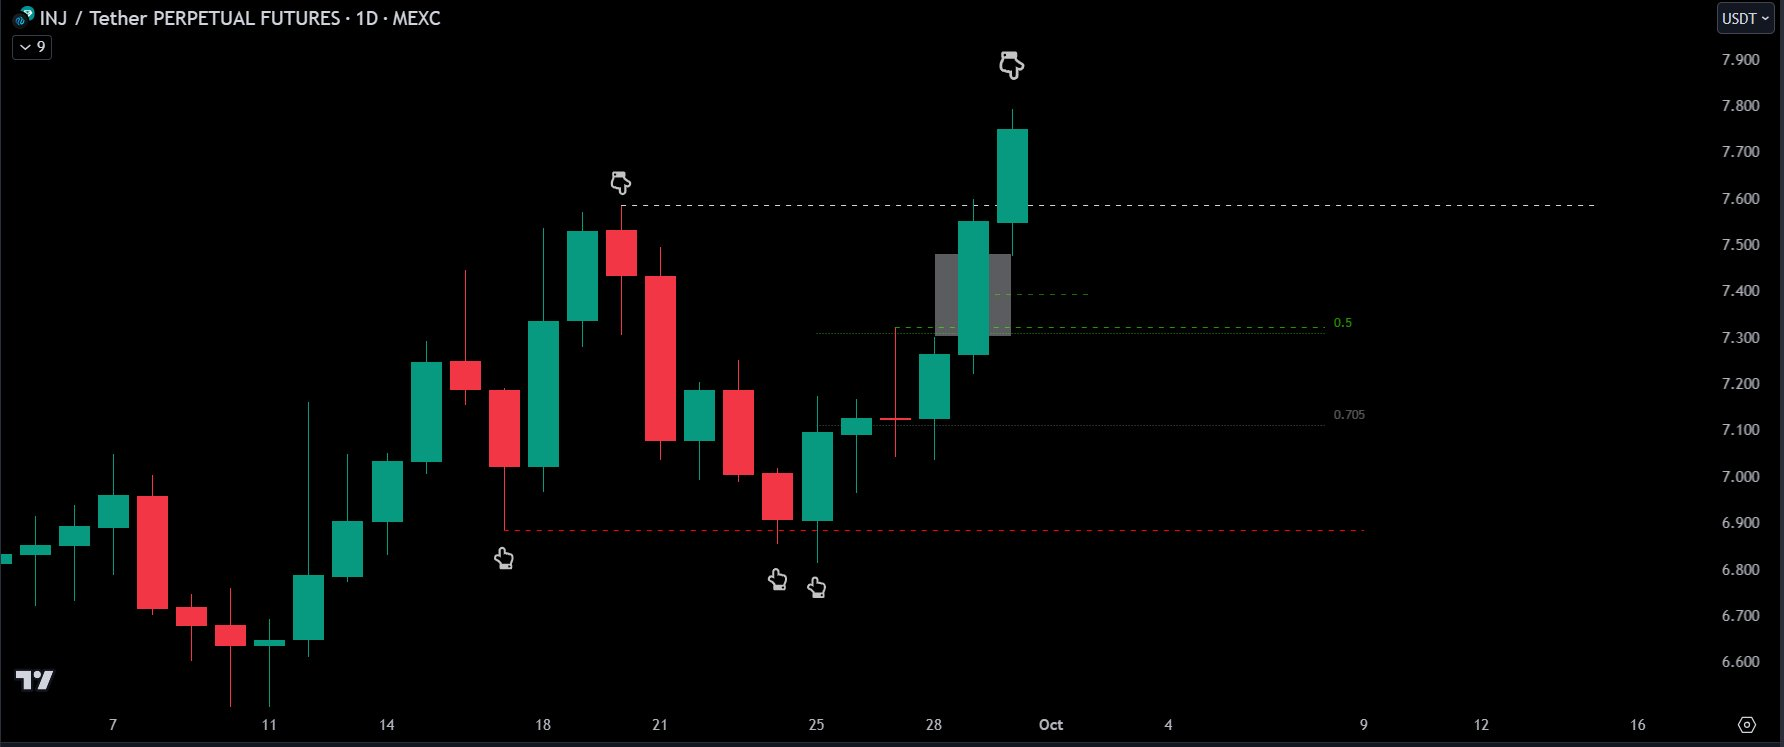
INJ reaching for the key level in October 2024:
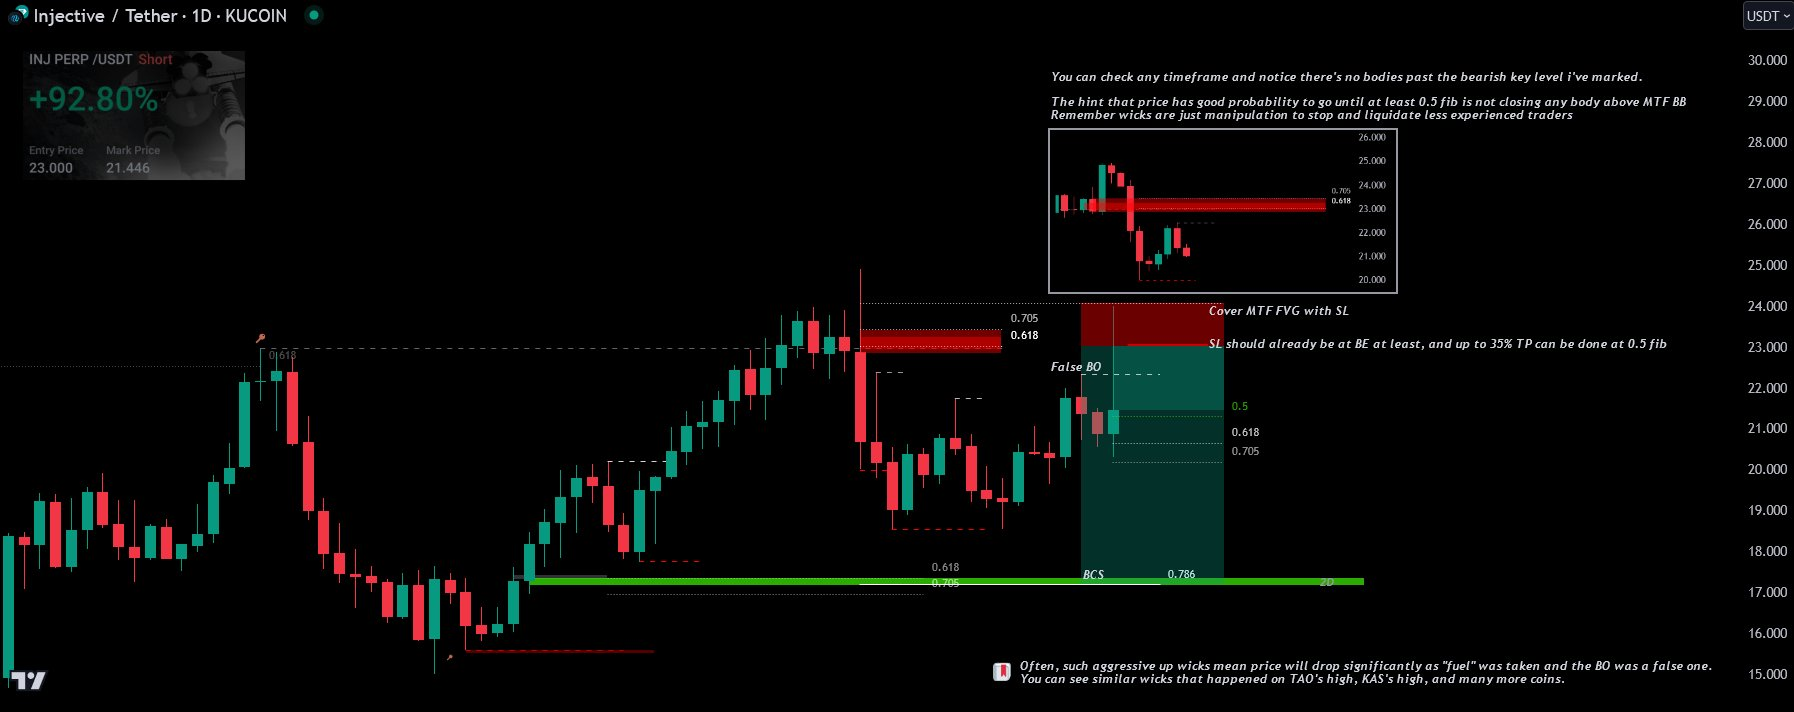
You can check any timeframe and notice there are no bodies past the bearish key level marked. The hint that price has good probability to go until at least 0.5 fib is not closing any body above MTF BB. Remember wicks are just manipulation to stop and liquidate less experienced traders.
Often, such aggressive up wicks mean price will drop significantly because "fuel" was taken and the BO was a false one. You can see similar wicks on TAO's high, KAS's high, and many other coins.
KAS:
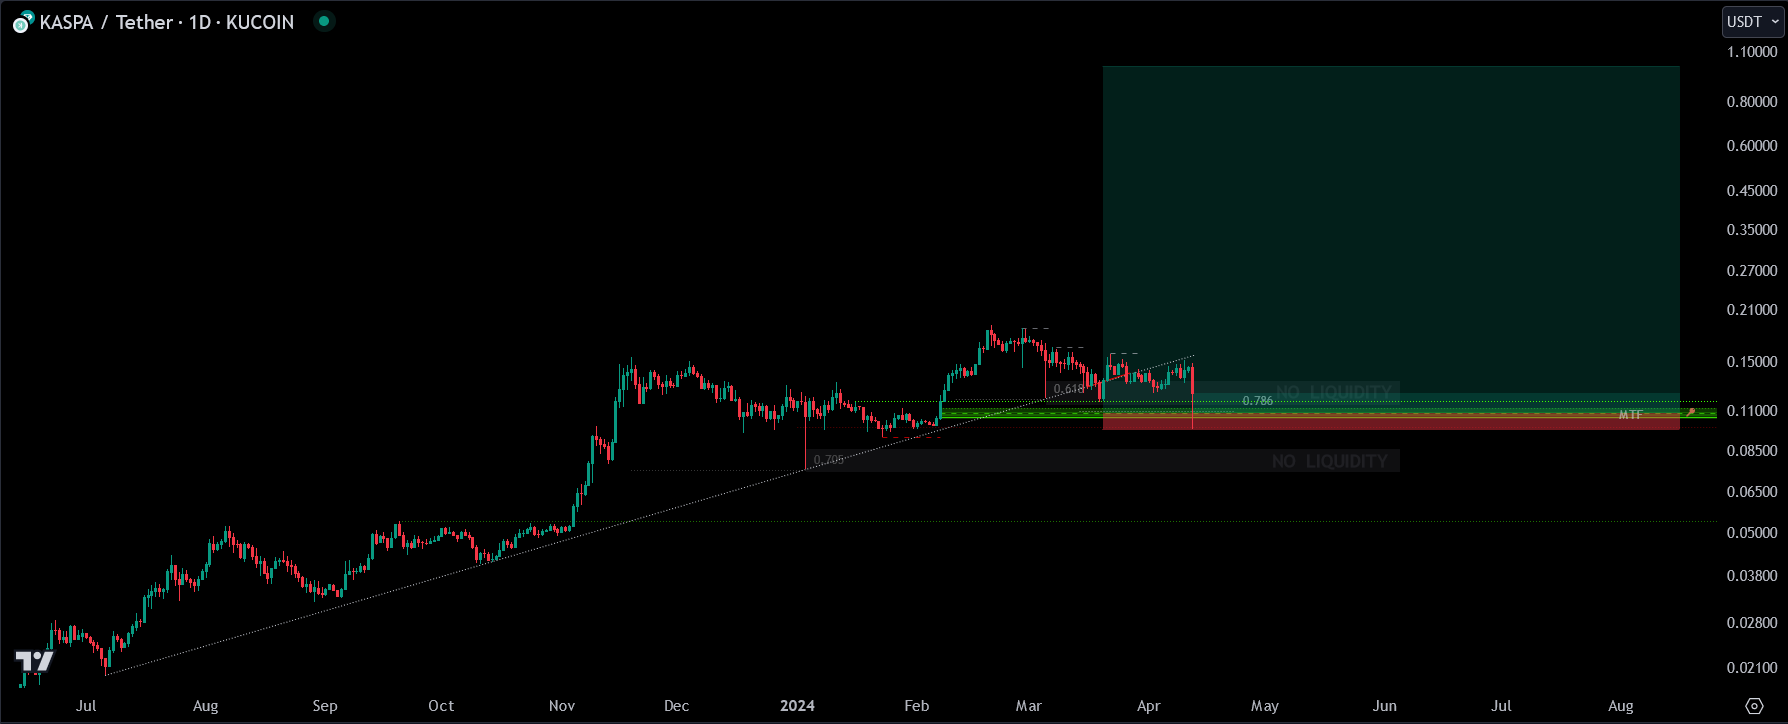
How could the SL be so accurate? Wide SL but safe… how? I got taken out.
If price doesn't close any significant TF (4H+) below a key level, you re-enter — provided BTC isn't closing 4H+ bearish. Print this and post it on your wall for the times aggressive drops happen and you're not sure if you should enter reversal positions.
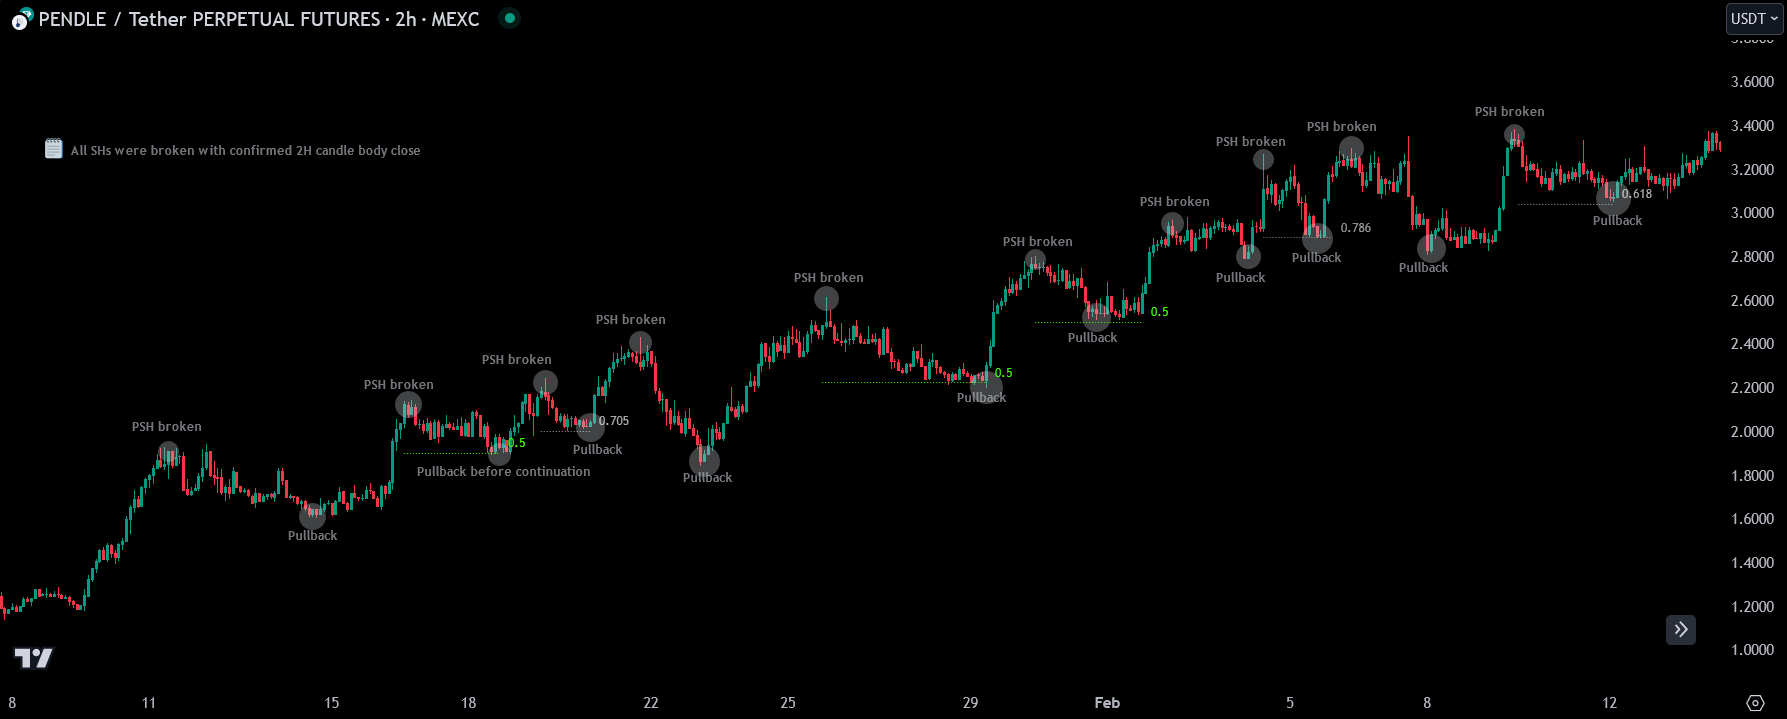
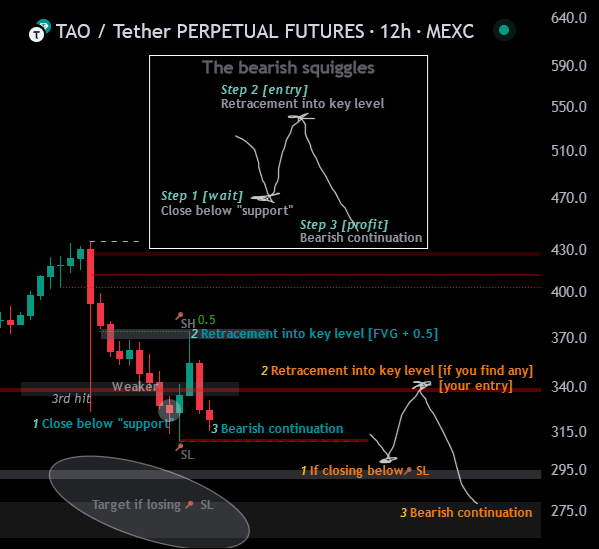
TAO: Remember to never chase BOs if you want the highest probability opportunities.

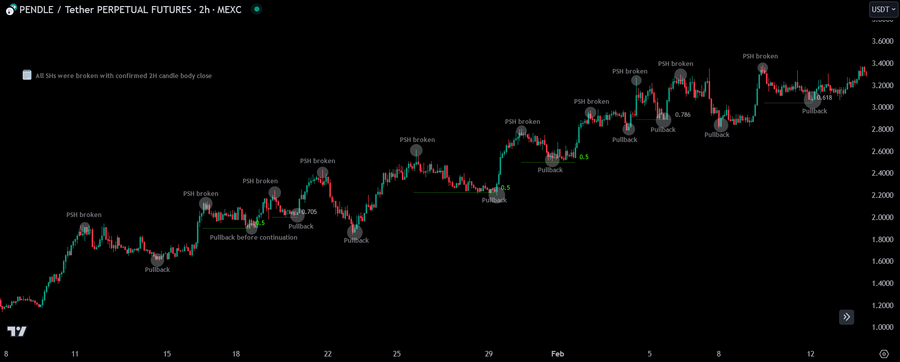
All SHs broken with confirmed 2H bodies:
YGG, March 2024:
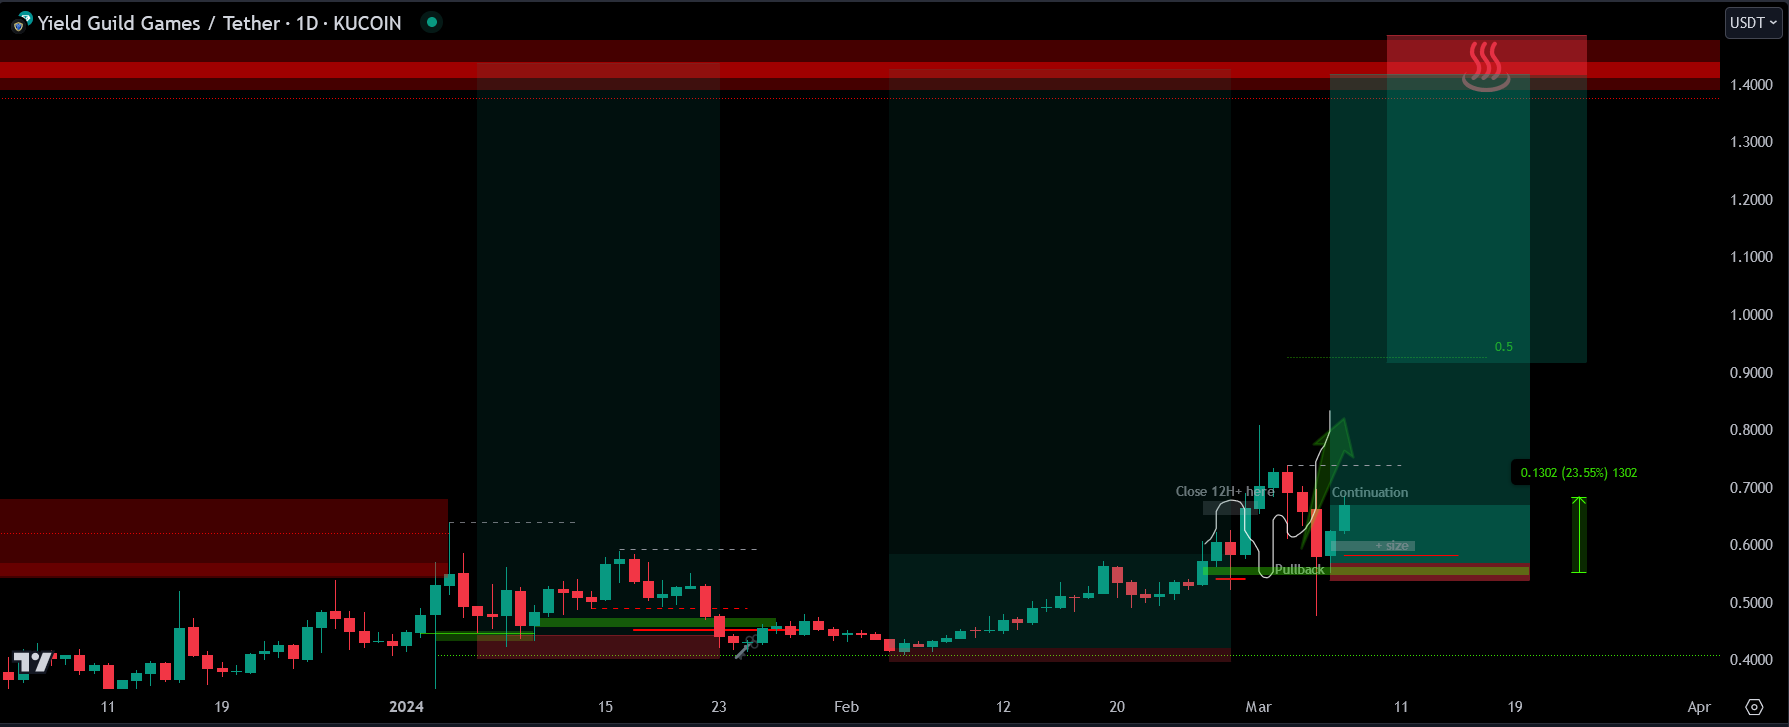
Followed the plan with 12H+ candle body close > key SH (newbie traders longed the BO…), to then pull back before bullish continuation. SL near entry.
ROSE:
STORJ HTF lows:
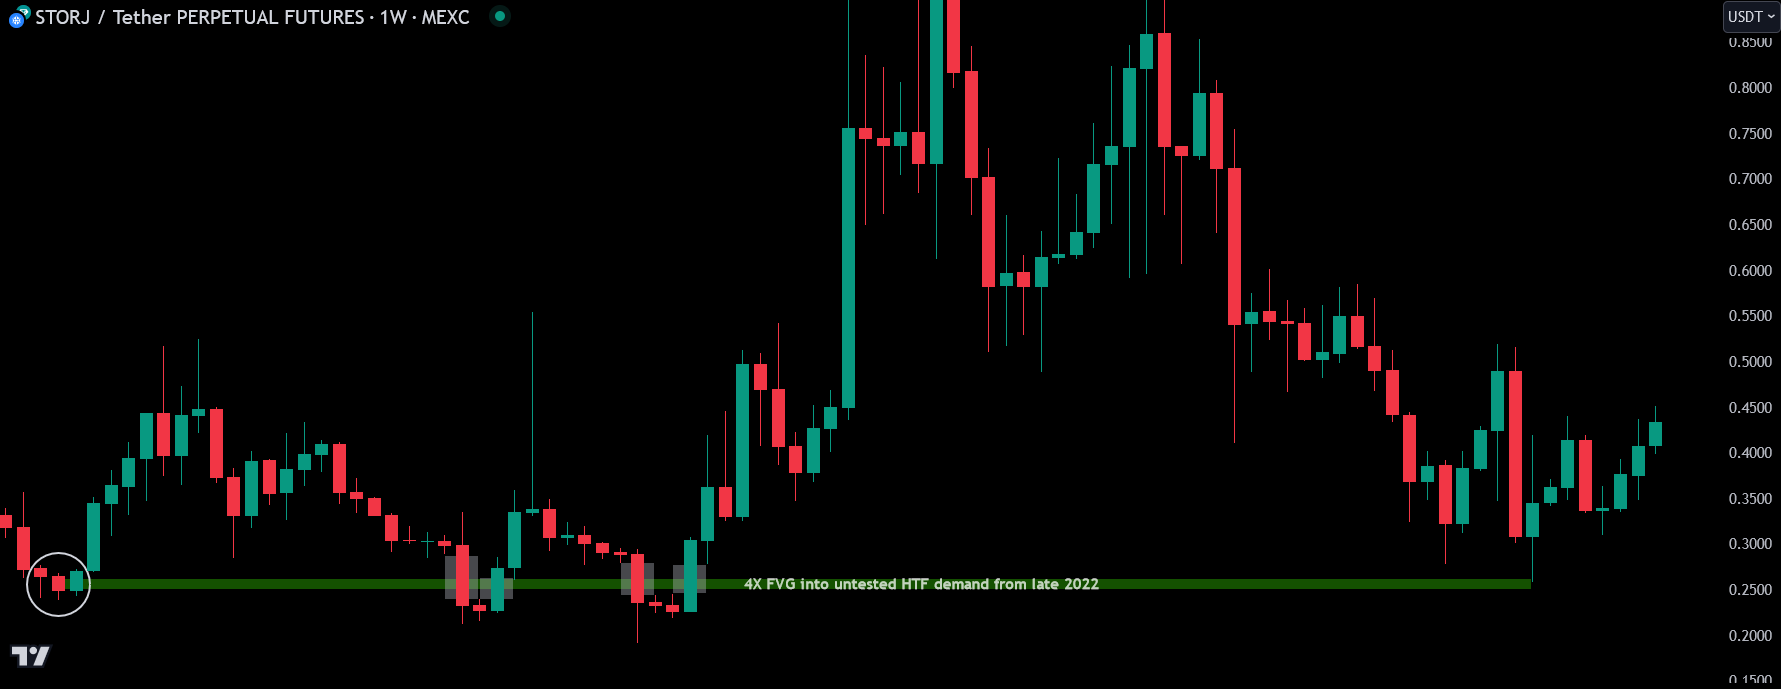
For the other two FVGs you said were on the same direction to be considered as a valid play, PA had to close below SL and then come to the level so it would form an opposite-pole type of trade?
Opposite poles/direction is more powerful than taking a supply level through FVGs in the same direction. The more FVGs hide a key level, the more powerful the level is. No PA is the same. The game isn't linear.
I have countless different criteria because there are millions of different patterns. It's not always what's "valid" or not, but how powerful each different level is. I don't try all FVGs just because it's an FVG into liquidity. I also often don't confirm an opportunity if there's no fibs confluence or ability to refine through TFs.
For setups like STORJ, I don't need to wait for a PSH or PSL close — that's proper hidden liquidity on HTFs. I look for opportunity at the test on opposite directions.
Whales Sold Already — Stop Calling It "Resistance"
Here's a mental model shift. Whales sold already many times, so it's not "resistance" anymore. Only someone who can't read the game considers a level resistance after so much selling — which is what all retail does.
With breaks of PSHs, the best play is to wait for a pullback before continuation, unless price confirms a close below PSL.
If price closes 12H+ above that previous high + pulls back into liquidity or imbalance, the probability is pretty high for bullish continuation.
Look for HTF Body Close Above the Most Significant Swing Highs
The simplest rule:
Look for HTF body close above previous most significant SH's. If not, it's likely a False Breakout. If it does close, the highest probability play is waiting for a pullback into a key level before continuation into the next HTF liquidity level — and if there's none to take, it will likely go to a new ATH. See 🎁Hidden Liquidity Levels.
BTC, February 2024:
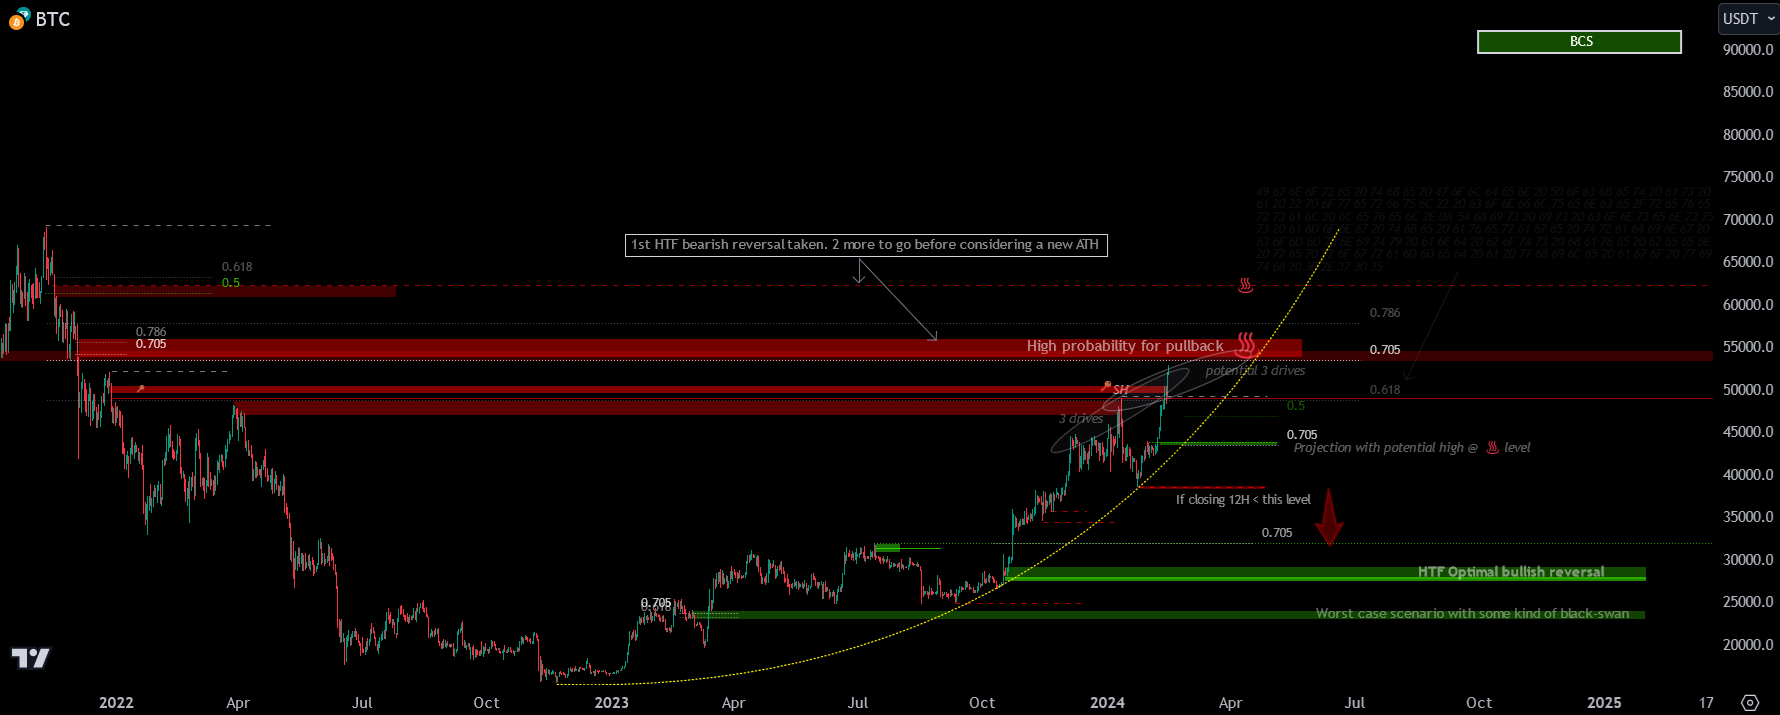
If this Daily close is > PSH, you can look for a pullback into a key level > continuation. This is the highest-probability opportunity.
You can always choose to long the BO, but that isn't going for high probability — it's what all retail traders do. The game's designed to stop/liquidate them all, collect "fuel," then proceed in the direction retail expected, which makes them start revenge-trading because they were "right but wrong."
When no HTF BOS is confirmed, you can spot the moonboys already calling for new ATH next month because of green candles:

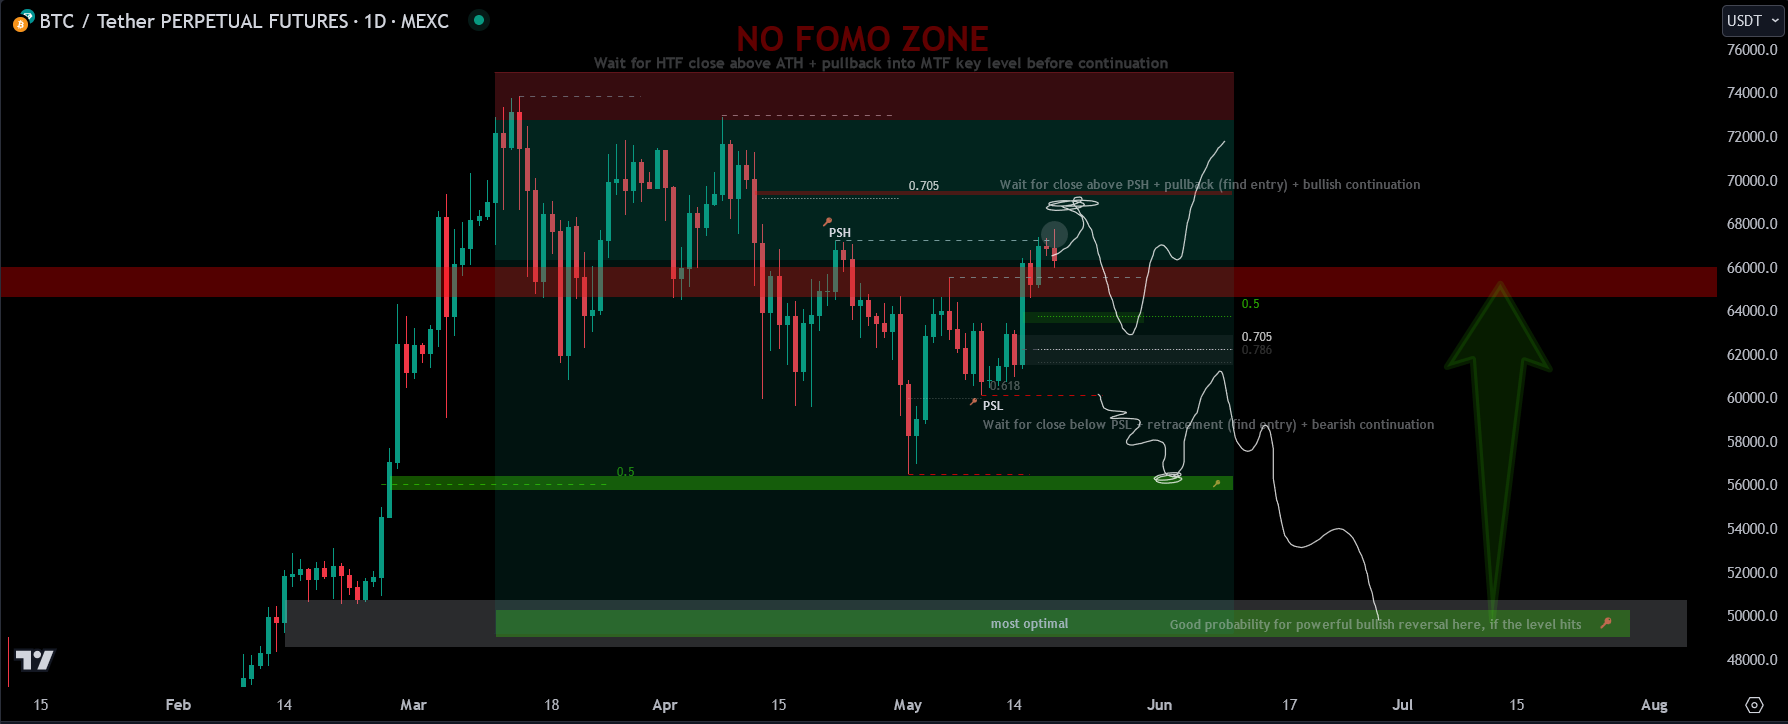
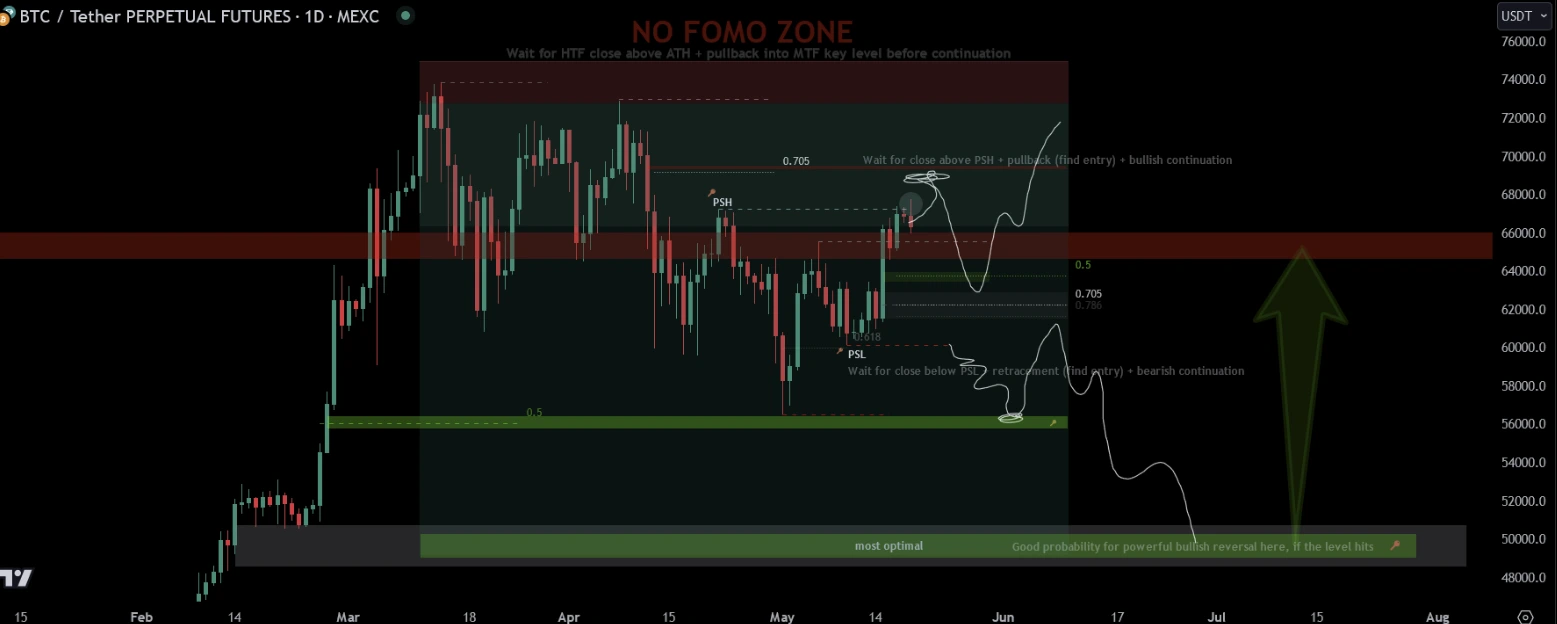
Bitcoin in January 2025 — Reading the Range
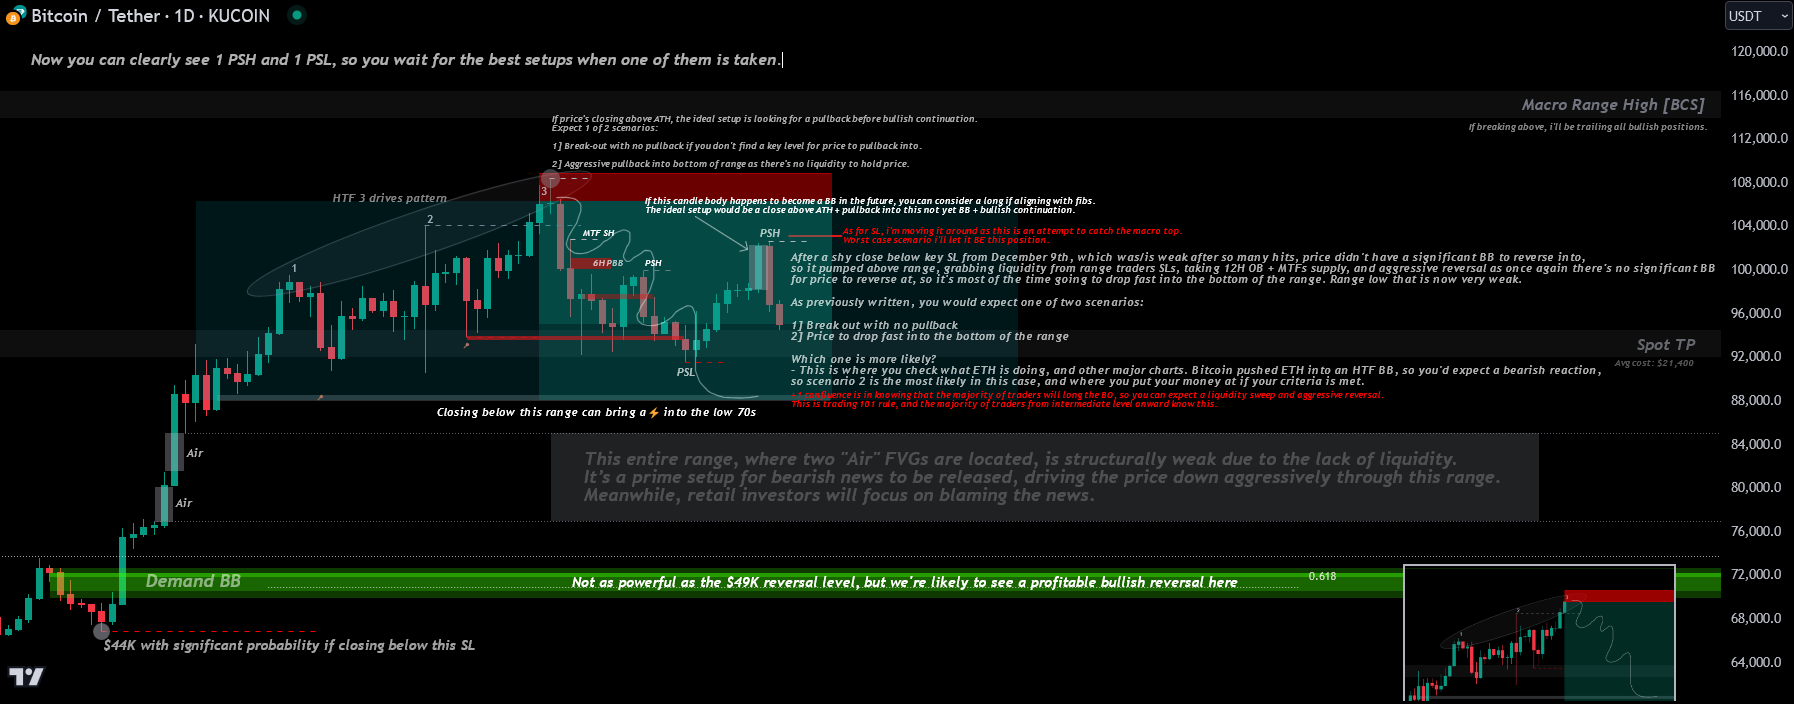
You can clearly see 1 PSH and 1 PSL, so you wait for the best setups when one of them is taken.
If price is closing above ATH, the ideal setup is looking for a pullback before bullish continuation. Expect 1 of 2 scenarios:
- Break-out with no pullback if you don't find a key level for price to pull back into.
- Aggressive pullback into the bottom of ranges where there's no liquidity to hold price.
After a shy close below the key SL from December 9th — which was weak after so many hits — price didn't have a significant BB to reverse into. So it pumped above range, grabbing liquidity from range traders' SLs, taking the 12H OB + MTF supply, and aggressively reversed because once again there was no significant BB for price to reverse at. So it dropped fast into the bottom of the range. A range low that's now very weak.
Which scenario is more likely? This is where you check what ETH is doing, and other major charts. Bitcoin pushed ETH into an HTF BB, so you'd expect a bearish reaction — scenario 2 is most likely.
+1 confluence is in knowing that the majority of traders will long the BO. So you can expect a liquidity sweep and aggressive reversal. This is trading 101, and the majority of traders from intermediate level onward know it.

This entire range, where two "Air" FVGs are located, is structurally weak due to the lack of liquidity. It's a prime setup for bearish news to drive price down aggressively through this range — meanwhile, retail will focus on blaming the news.
More Examples and Edge Cases
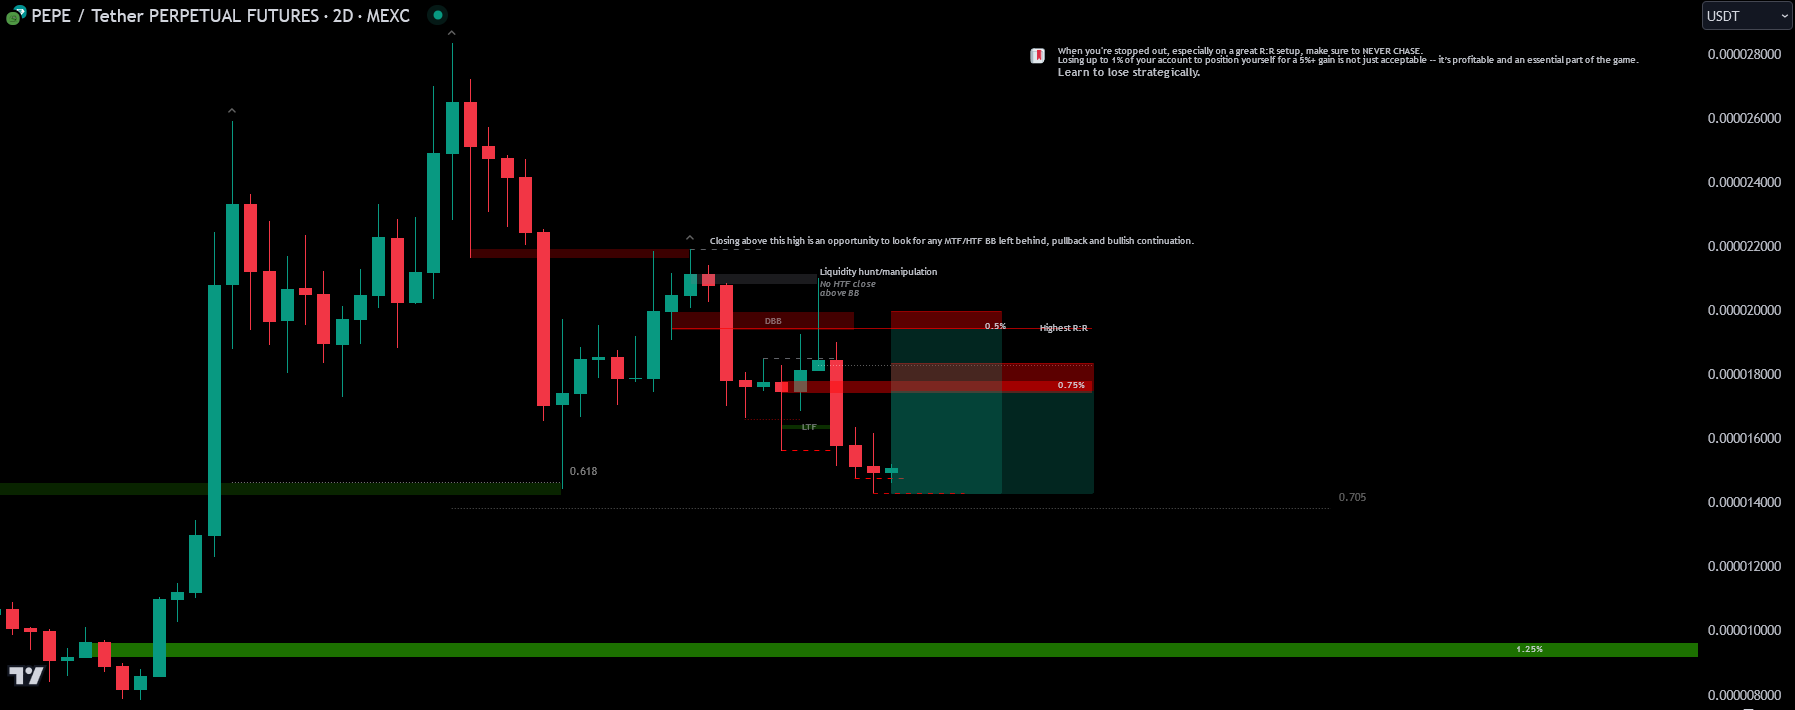
PEPE, January 2025 — why I didn't short the DBB:
- Nearest BB was just 4-5% below — R:R wasn't great.
- There was a nice BB but on LTF, much lower. I want HTF key level into HTF key level, or MTF sometimes — not really HTF into LTF.
- Potential bullish continuation, ignoring the DBB, leaving an FVG behind, and using it as fuel for another leg up — and if so, I can long from there.
- External factors.
UNFI, September 2024:
On a play like the 2D here, it looks like you'd probably take a stop on that hidden BB, just barely. If so, would you re-enter on reclaiming it, like a swing-failure?
I wouldn't. When it looks like this, I cover FVG (see 🔷Stop Loss). Nevertheless, ♨️Key Levels🗝️ are only broken if there are MTF bodies behind/above them. Only wicks are meaningless — so in case you're stopped in PA like this, it's a re-entry.
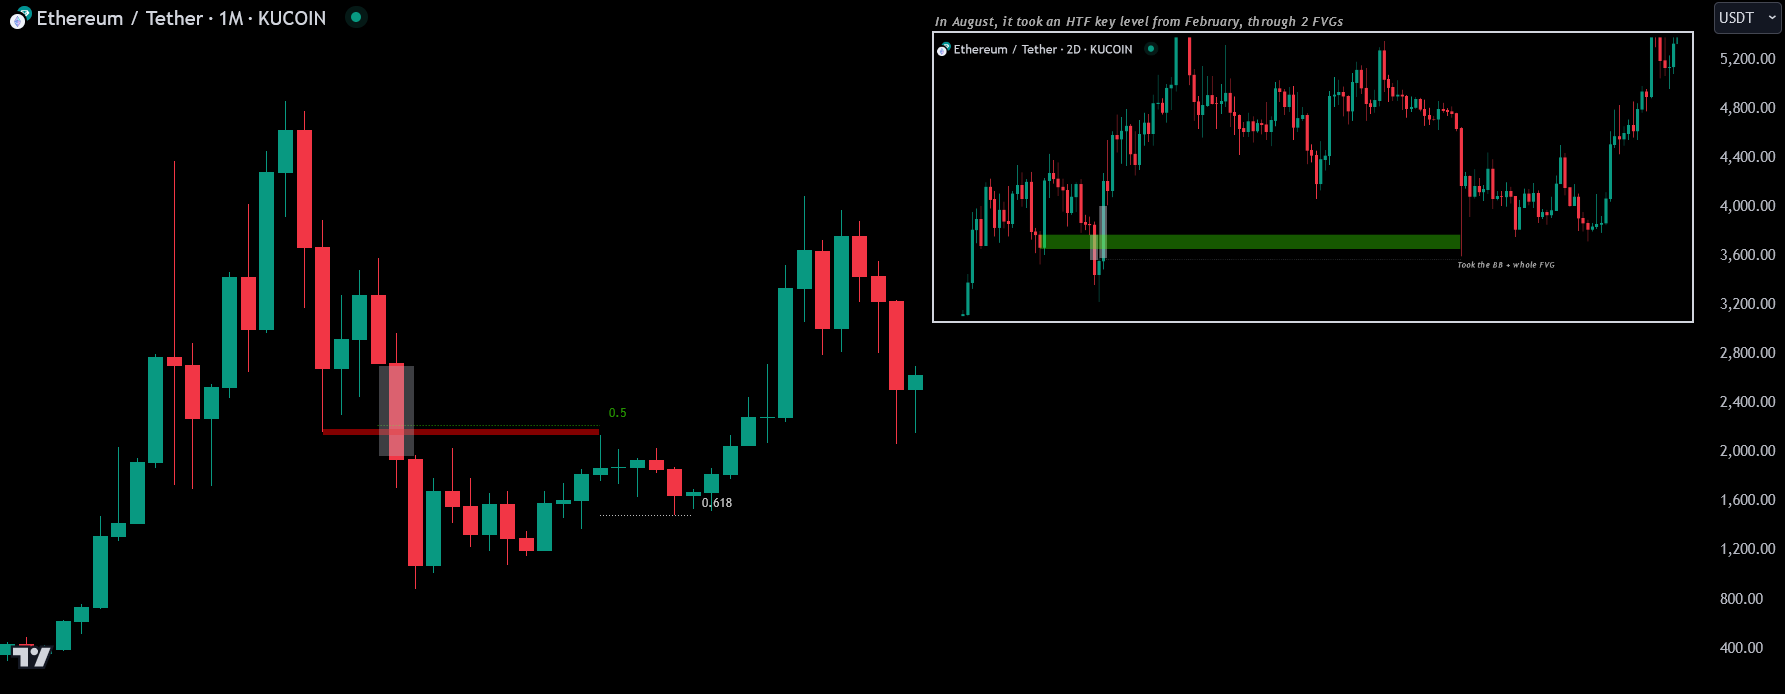
A failed BO down with a stack candle:
TP longs if failed BO (False Breakout). Hold longs if closing above and if there's a key level left behind above 0.5 fib of the latest bullish swing. When price's trading below this 0.5, any pump above it is a short opportunity (bearish MS).
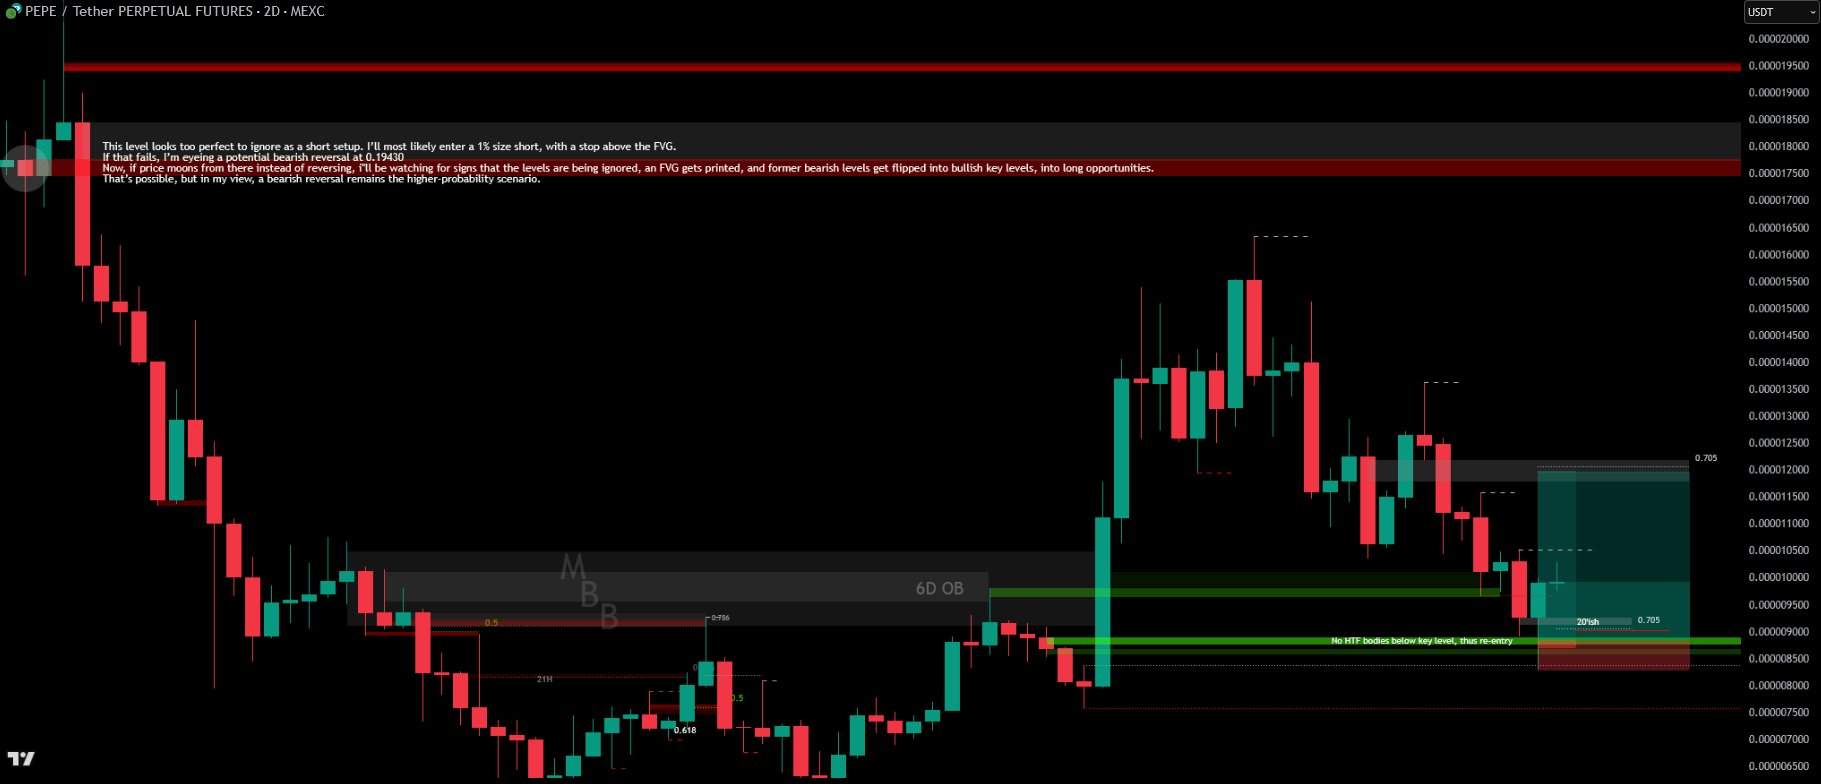
A short setup at a "too perfect to ignore" level:
I'll most likely enter a 1% size short, with a stop above the FVG. If that fails, I'm eyeing a potential bearish reversal at 0.19430. If price moons from there instead of reversing, I'll be watching for signs that the levels are being ignored, an FVG gets printed, and former bearish levels get flipped into bullish key levels — into long opportunities. That's possible, but a bearish reversal remains the higher-probability scenario.
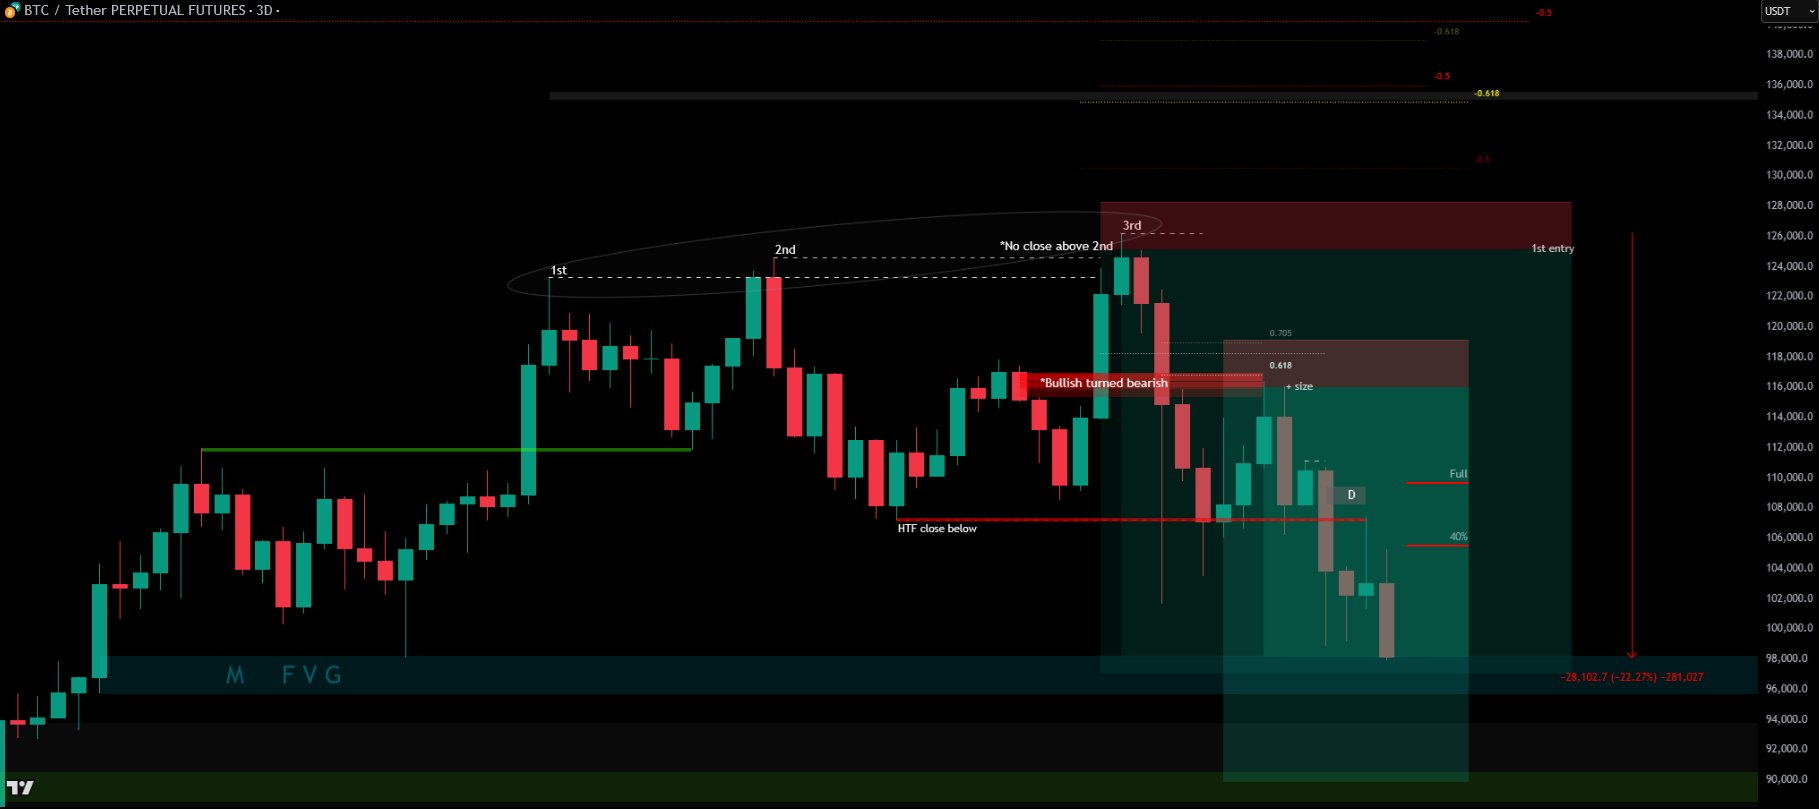
A Not-Ideal BO
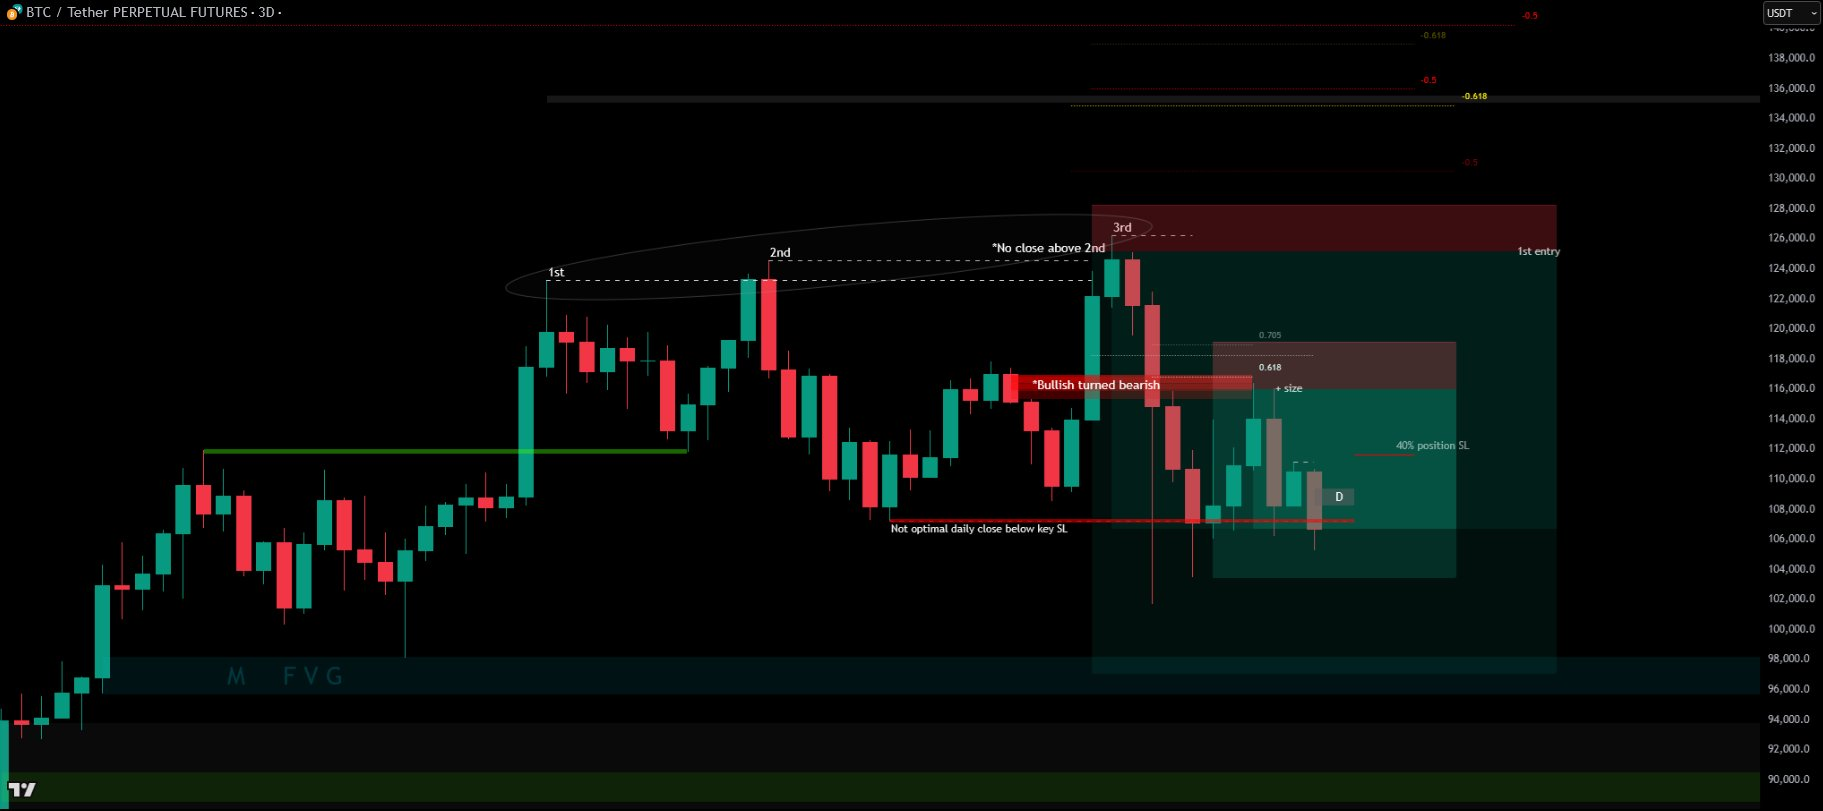
Not optimal daily close below key SL. Not every confirmation is created equal — sometimes the close happens, but the structure of the candle, the surrounding context, or the absence of a clean key level makes the play sub-optimal.
$HOOK — Looking for Pullback into Confluence
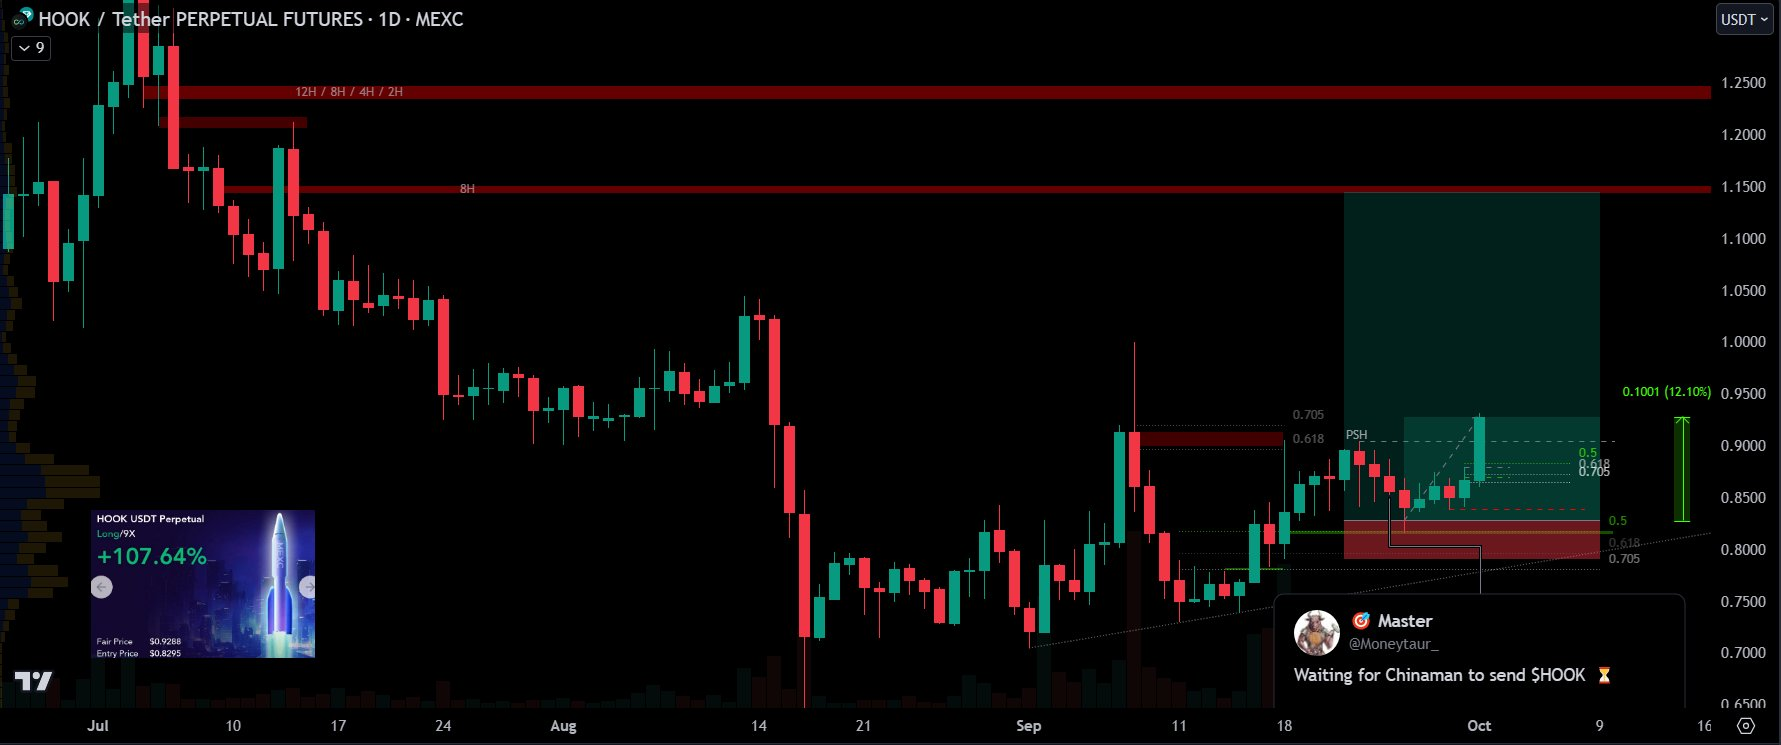
HTF break > PSH (need to confirm with close). If so, look for pullback into confluence level before bullish continuation. Ideally you want fresh imbalances > liquidity, alongside fibs.
Bitcoin with its traditional EOM momentum — as long as it stays above $26,670, expect alts to gain bullish momentum.
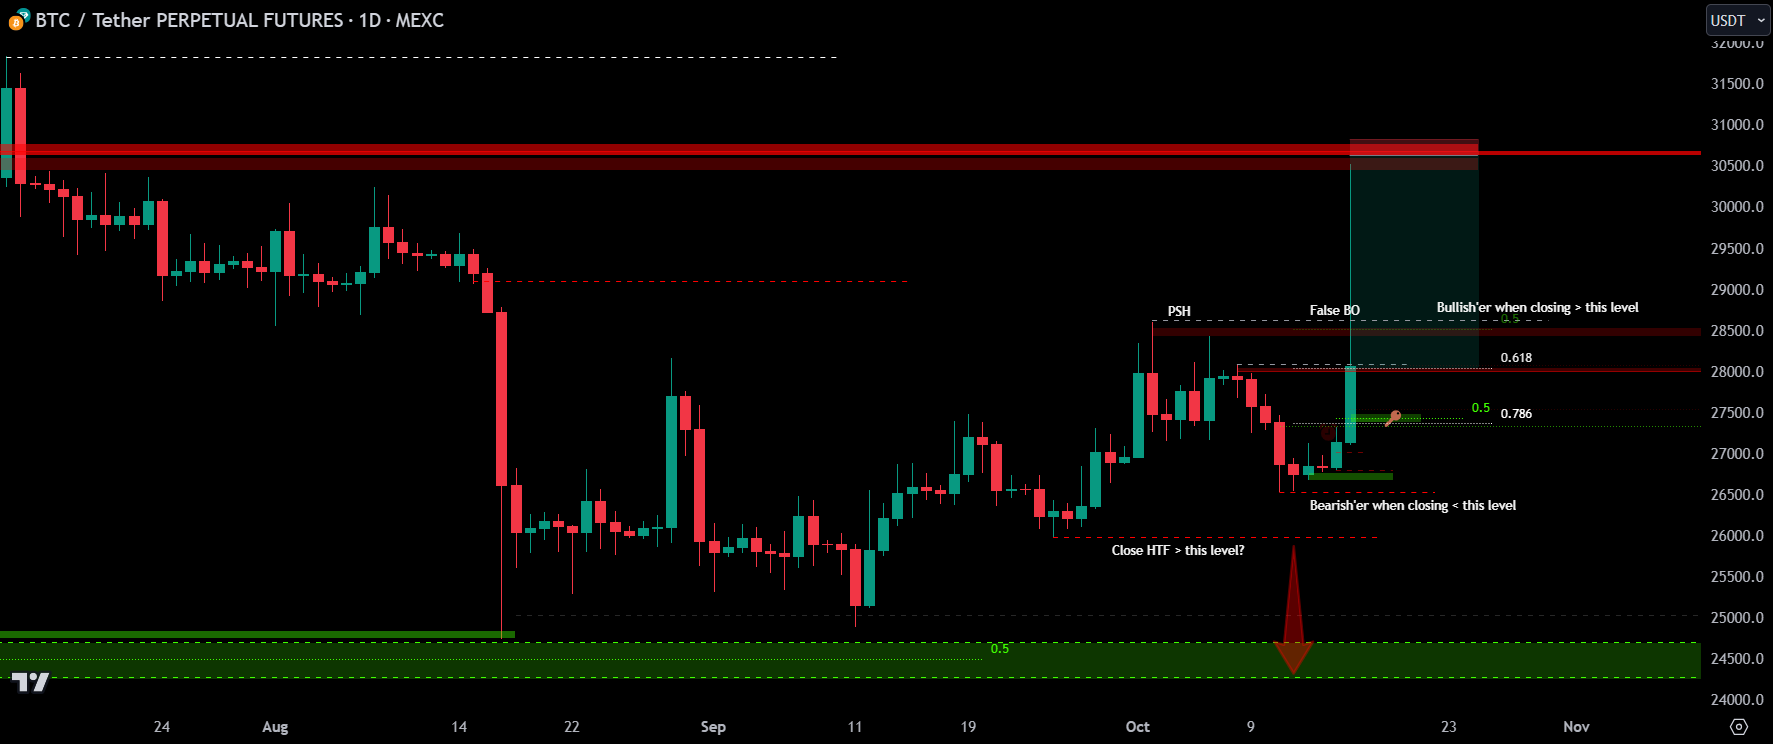
False Breakouts in Detail
A False Breakout occurs when price breaks a key level only to reverse shortly after, trapping traders who entered too early. Identifying them involves looking for signs of weak momentum or lack of volume behind the move.
May 2024 — a quick lesson on a false break-out:
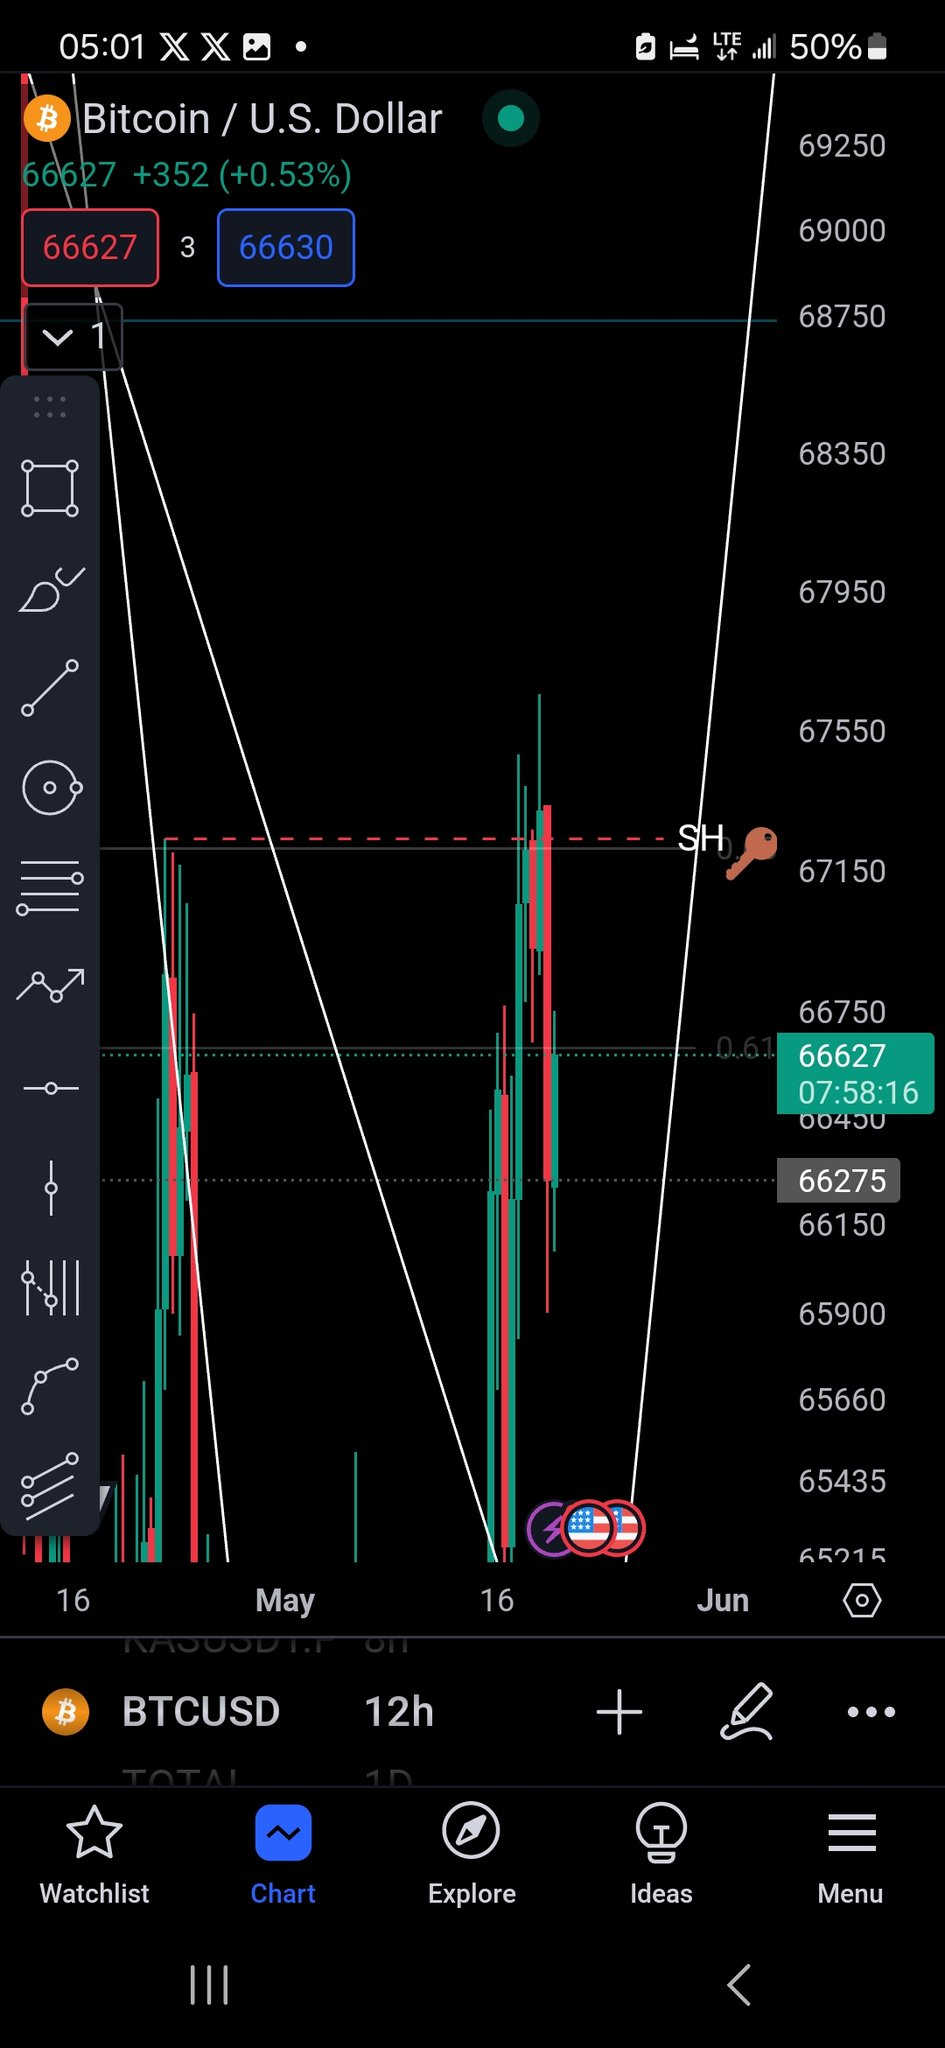
There were no MTF or HTF candles closing above the key PSH, so you don't long here. For the highest-probability long, it's the squiggle on the chart — with MTF (at least) close above key PSH + pullback (the entry) before bullish continuation.
If you're looking to long an altcoin, you're better off if your levels hit when BTC is on the short-term last stage of the step-by-step (the pullback). In most cases, after a false BO, there's a pullback steep enough to REKT longs and LTF scalpers.
I saw a 12hr close above PSH. Was this considered HTF close or no?
Weak. No full OB above on any TF. No Daily.
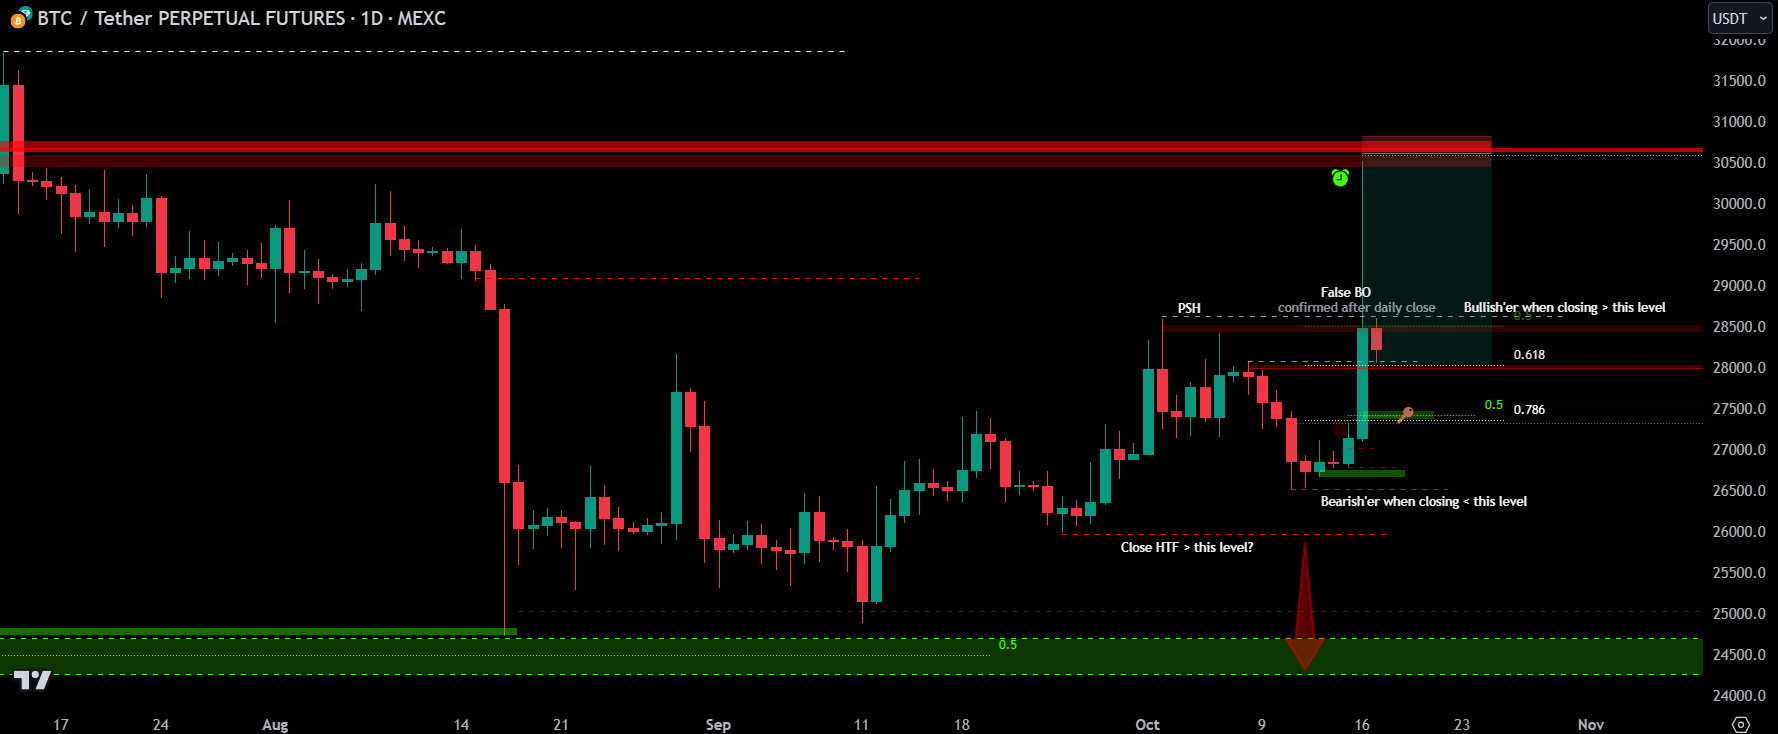
The next day:
Scalpers got REKT trying to long a false BO into a -3ish% drop. If you're new to the game, this % drop is enough to flush high-leverage traders.
Phase 1 of the opportunity to long-scalp BTC is on. Need to wait for HTF close above PSH — 12H+ and better if Daily. If so, and if it gives a pullback into an MTF key level, that's the (not optimal) opportunity to long for a short-term trade.
Many Retail🧠 traders go long here as they expect a break-out, without liquidity-related confirmations.
TAO:
BTC zoomed-in, October 2023:

Don't fall for false moves. Learn to identify confirmed BOS on HTF and you'll level up instantly.
The next day:
HTF False BO ✅.
February 2024 — no HTF BOS confirmed for BTC yet:
September 2023:

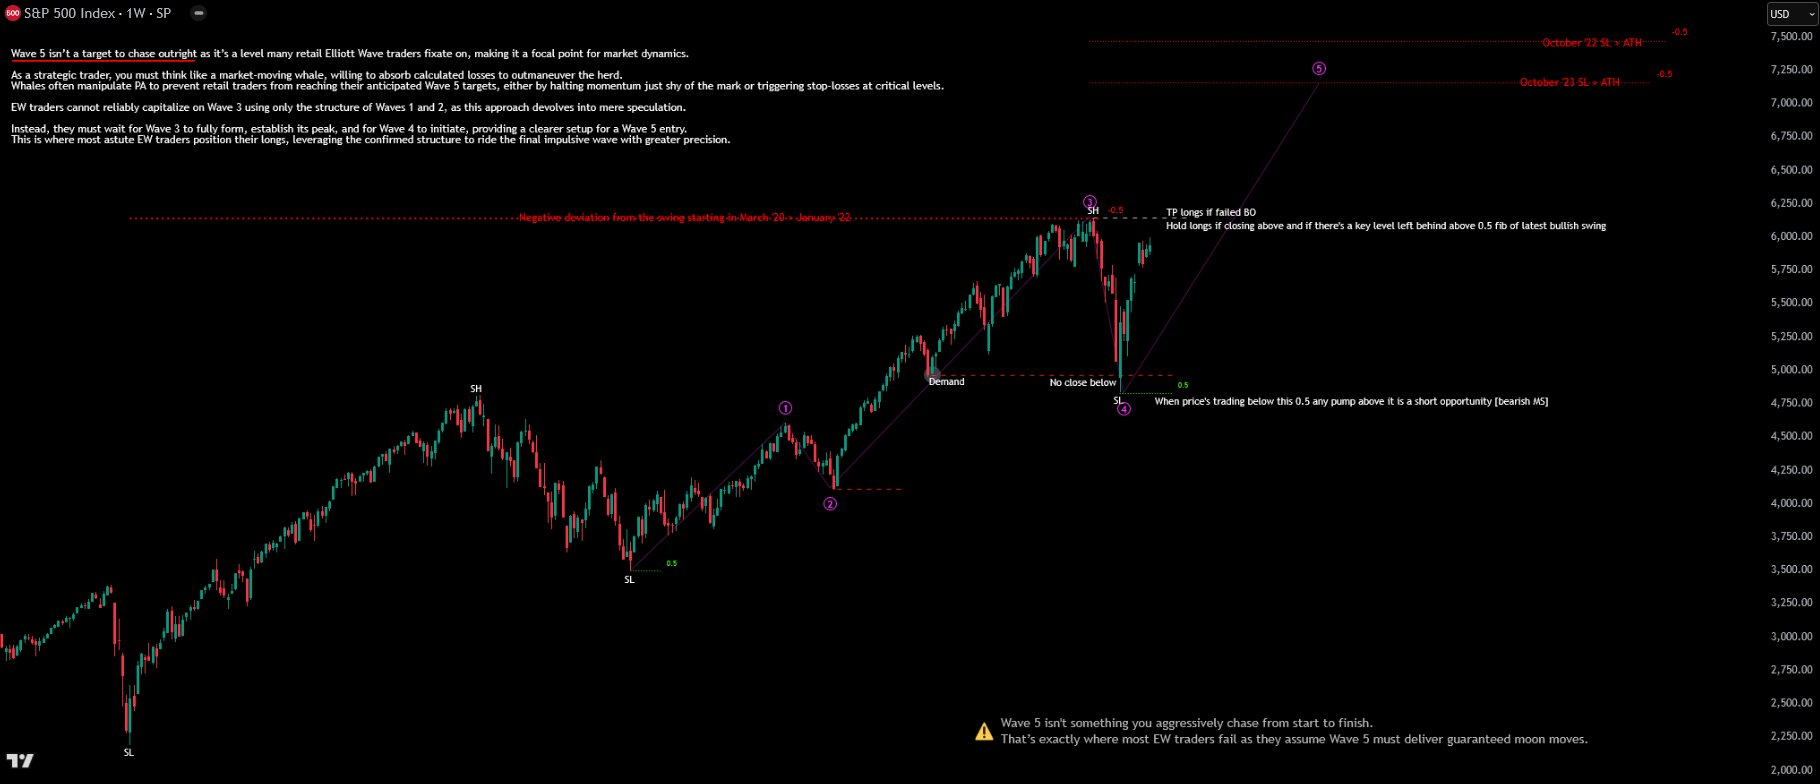
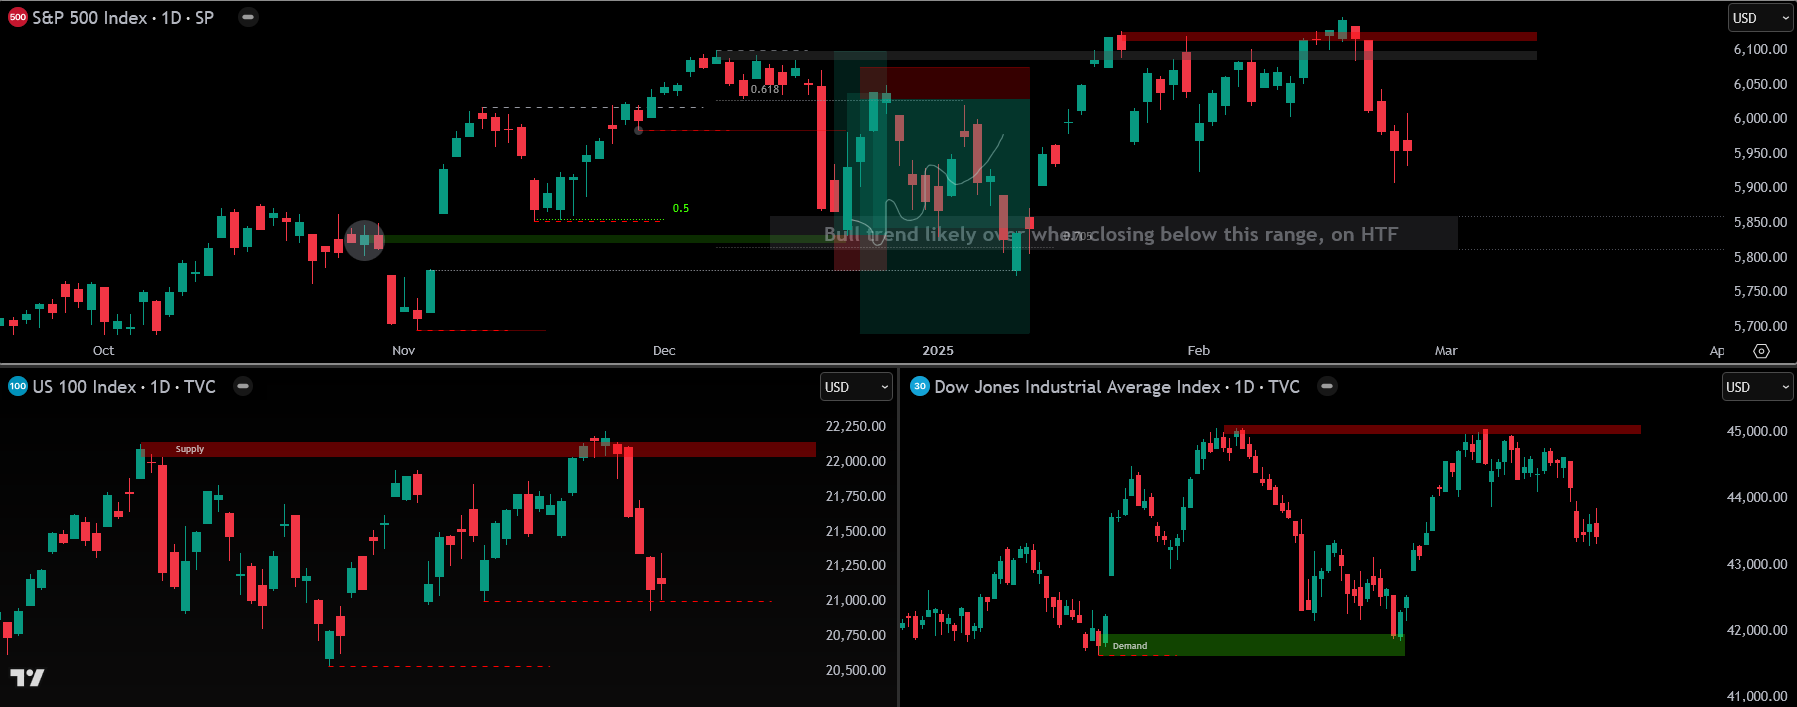
February 2025 — failed bullish BO across SPX, NDX, DJI shortly before tariff news:
The Charts That Define a True BOS
The illustration of BOS:
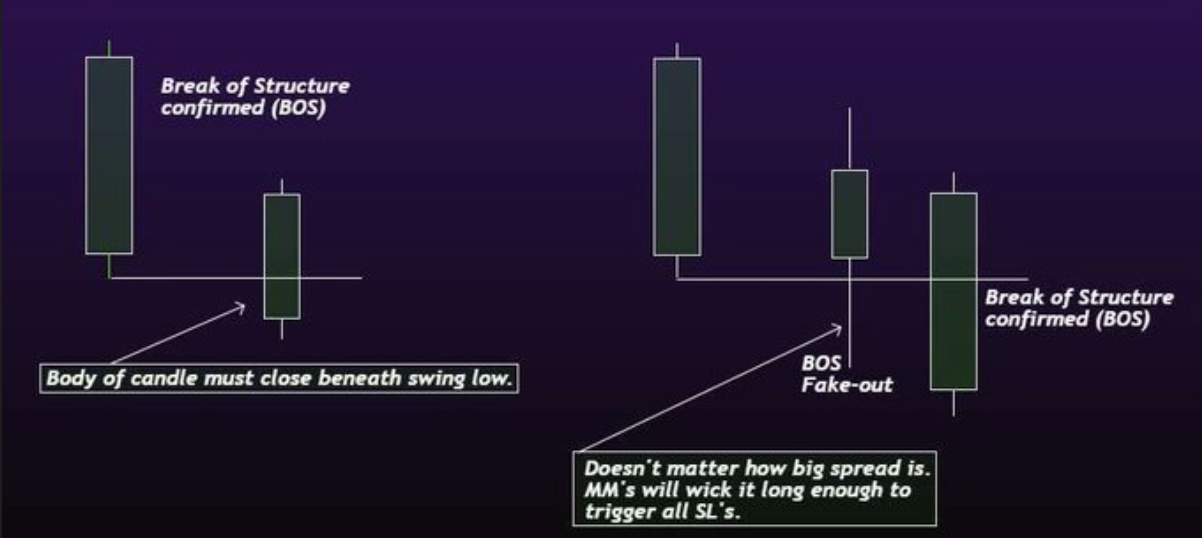
If you can identify BOS without looking at the picture, you've got the lesson. If not, look at it again and review the next images. Ignore the fibs in this lesson — they're needed elsewhere, but they aren't the focus here.
Most important for ranges and key levels:
- The higher the timeframe, the more powerful the BOMS is.
- When it's more powerful, the higher you can risk.
- Don't trade against the HTF trend on LTFs.
- We don't chase. We wait and earn.
A breakout occurs when the price of an asset moves beyond a key level of support or resistance — a previous high, low, trendline, or pattern. However, not all breakouts are genuine. Many are designed to trap retail traders and reverse quickly, leading to significant losses.
A common mistake is jumping into a trade as soon as a breakout occurs, only to see price reverse almost immediately. The need to confirm a BOS on higher time frames is what separates a real trade from a False Breakout.
A true breakout is often confirmed by a close on a higher time frame (such as the daily or 12H chart) above the breakout level. This filters out false signals from lower time frames.
Patience and waiting for confirmation can save you from costly mistakes.
The best entries often occur on pullbacks, not on the breakout itself. Once a breakout is confirmed, waiting for price to pull back into a key level or area of liquidity before entering increases your chances of success. After a breakout, the importance of a retest is where the best entry point lies. This strategy helps you avoid getting caught in a fakeout and positions you for a more secure trade.
Once more, because this is the hinge of the entire lesson:
A wick doesn't confirm it broke. It's a false break. A body does. Bodies hold institutional trading volume. Wicks can hold no liquidity on them.
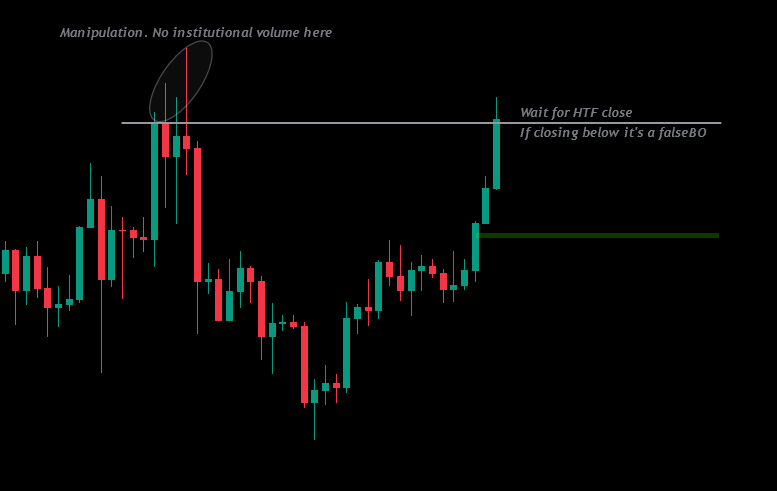
False Breakout explained visually:
There was no MTF or HTF candle closures above 🔑 PSH, so don't long here. For the highest probability long, it's the squiggle on the chart where MTF (at least) close above 🔑 PSH + pullback (the entry) before bullish continuation.
Note if you're looking to long an altcoin, you're better off if your levels hit when BTC is on the short-term last stage of the step-by-step I mentioned above (the pullback) because majority of the time, after a false BO, there's a pullback steep enough to get REKT longers and LTF scalpers.
The Same Lesson, Repeated for the Students Who Need It Twice
Because this content matters, the second pass through the structure intro:
There was no MTF or HTF candle closures above 🔑 PSH, so don't long here. For the highest probability long, it's the squiggle on the chart where MTF (at least) close above 🔑 PSH + pullback (the entry) before bullish continuation.
Note if you're looking to long an altcoin, you're better off if your levels hit when BTC is on the short-term last stage of the step-by-step I mentioned above (the pullback) because majority of the time, after a false BO, there's a pullback steep enough to get REKT longers and LTF scalpers.
The Punchline
Mastering breakouts isn't about spotting price moving beyond a key level. It's about understanding market structure, waiting for confirmations, and being patient enough to enter on pullbacks rather than chasing the initial move.
- A wick is not a break.
- A body on the right timeframe is.
- The right timeframe scales with the asset's trading volume — Daily for BTC and ETH, 12H for high-TV alts, full daily blocks for everything else.
- After a confirmed close, you wait. You don't long the breakout. You long the pullback into a ♨️Key Levels🗝️.
- If there's no key level for price to pull back into, you accept that BO without pullback is on the table.
- A CHoCH on HTF is the signal a real trend reversal is starting — and a CHoCH is always also a BOS.
Find > Wait > Enter > Win. Never chase — always strategize. See ⚠️ Never Chase..