Ranges, Range Highs/Lows, and Trend Strength
Ranges are the skeleton of every chart you'll ever trade. Before you can read schematics, before you can call a reversal, before you can size a position with conviction — you need to know where price is inside its range. This lesson builds that foundation: how to define a range, how nested ranges relate to each other, how to use range highs and lows as decision points, and how to read trend strength through momentum and dominance once price finally leaves the range.
There is a lot of talk of FIBS in this lesson. This is a more advance lesson covering ranges compared to the previous lesson that just talked about basic structure. If you are confused because of that, DO NOT WORRY. FIBS are covered in-depth in a future lessons and are not required to understand the core concepts of ranges discussed in this lesson
What a Range Is and Why It Matters
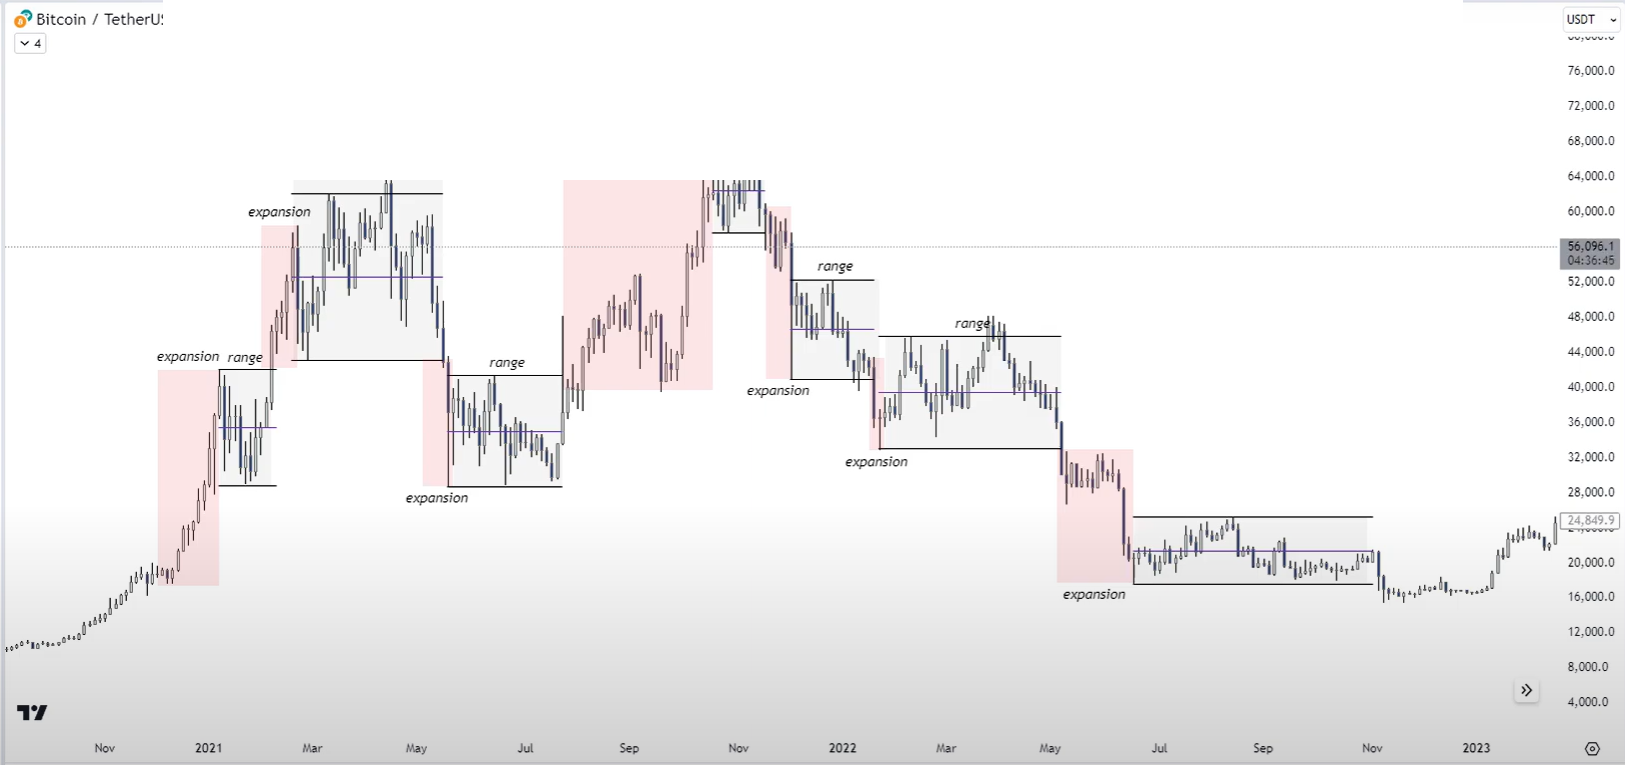
A range occurs when price moves sideways, forming a horizontal structure instead of trending up or down. Ranges are often referred to as consolidation phases. After a strong directional move (an expansion), markets pause to re-equilibrate — similar to how a human sprints and then needs rest. A range restores order flow balance: after too many buyers (or sellers) dominate, the market must consolidate because there aren't enough counterparties to continue the move.
Ranges are foundational to trading because the schematics you'll learn later are built around range deviations and the behavior of price inside ranges. Understanding ranges improves clarity in applying these concepts later — schematic models like Accumulation and Distribution, 🎁Supply & Demand, and multi-timeframe trading logic.
You can identify a range when the PA of an asset moves sideways between a SH and SL. PA will continue to play in that range until a SH or SL is broken. Once broken, assume PA to pull back into the range and reverse for continuation into the broken SH or SL direction.
MMs and algorithms will always play the game within a range until broken — they buy/long in the discount zone and sell/short in the premium zone. That's why ranges are heavily tied to discount & premium zones. Both topics are crucial, and if you don't understand both, you will not make it.
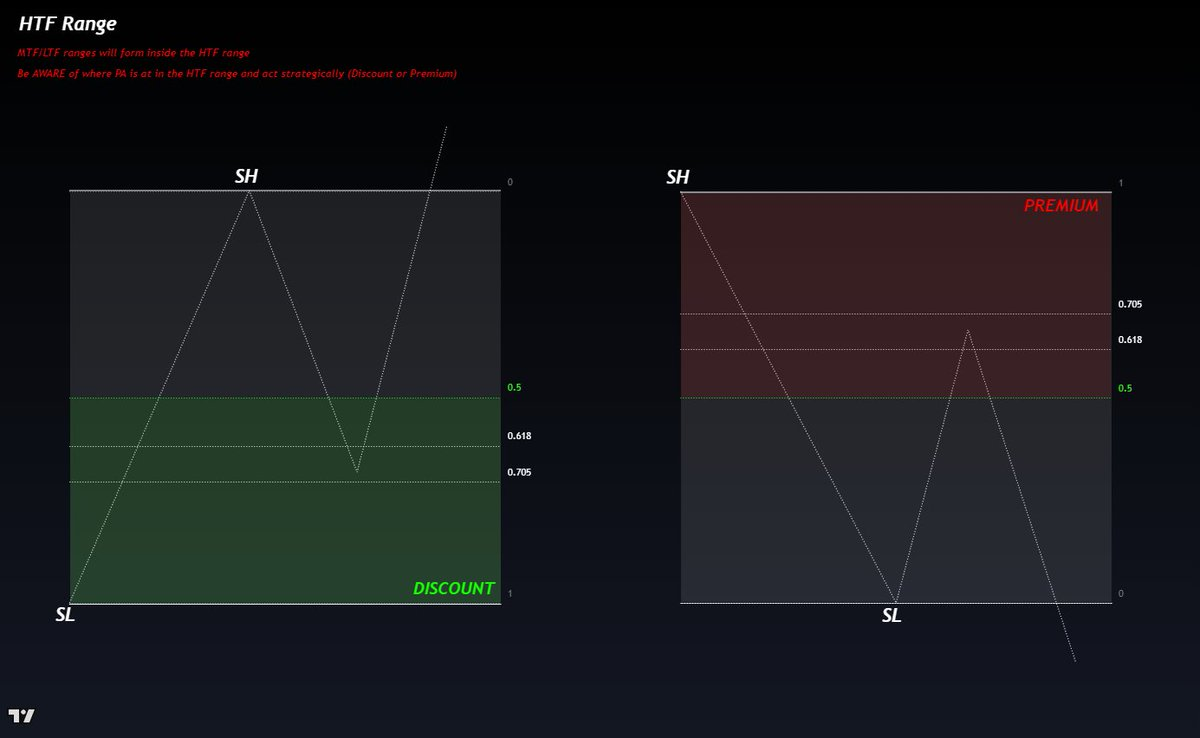
Defining a Range with Fibs
Once you've spotted sideways price action, you define the range by anchoring fibs from swing high to swing low (or low to high). This gives you the structure of 🔷Premium & Discount:
- Set fibs from range high to range low.
- Above 0.5 = Premium.
- Below 0.5 = Discount.
- The 0.5 fib is Equilibrium.
- Range High = Premium.
- Range Low = Discount.
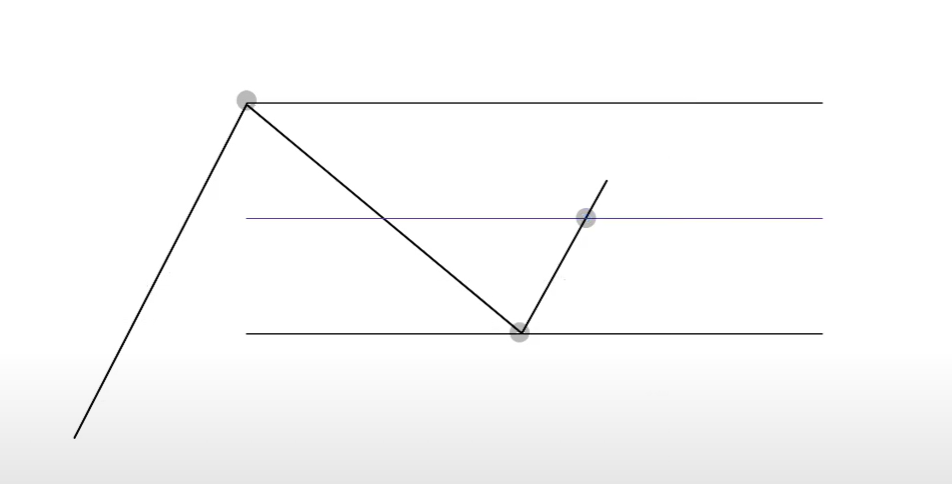
The direction you pull fibs depends on the trend you're inside:
In an uptrend:
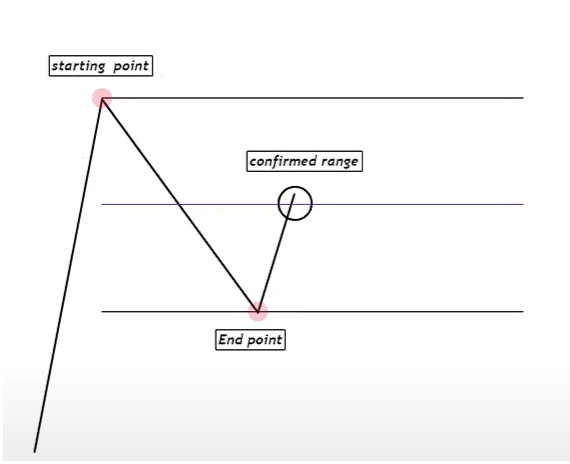
Pull fibs from top to bottom (latest swing high to swing low). A range is confirmed when price moves back up to the 0.5 fib (equilibrium).
In a downtrend:
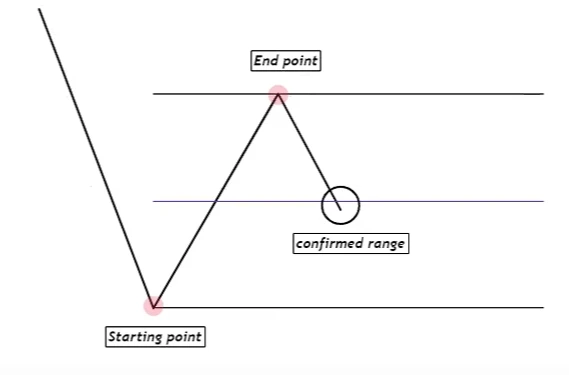
Pull fibs from bottom to top (latest swing low to swing high). A range is confirmed when price moves back down to equilibrium (0.5 fib).
A note on structure: the range low or range high can be confirmed before a market structure low or high is confirmed. MARKET STRUCTURE confirmation requires price moving to a higher high or lower low, while a range only needs a touch of equilibrium. See MARKET STRUCTURE Basics for the underlying definitions.
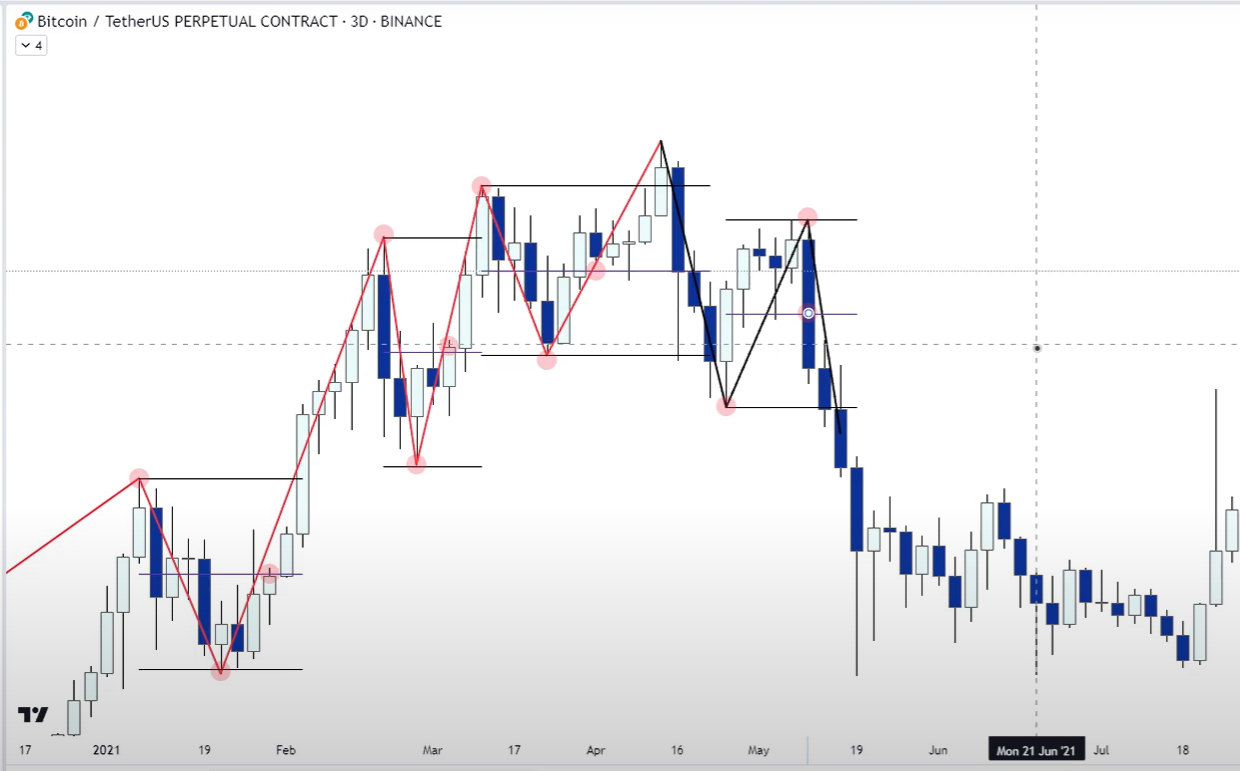
The Six-Candle Rule
A range is valid on a specific timeframe only if the six-candle rule applies:
- 2 candles in the direction of the trend, then
- 2 candles in the opposite direction, then
- 2 more candles back in the original direction.
That sequence confirms the formation of a range. Always apply the six-candle rule on the specific timeframe being analyzed.
You can also confirm a range simply by waiting for it to print 2 tops and 2 bottoms. If someone asks how long price needs to stay sideways before a range is "formed" — 2 tops, 2 bottoms, range formed.
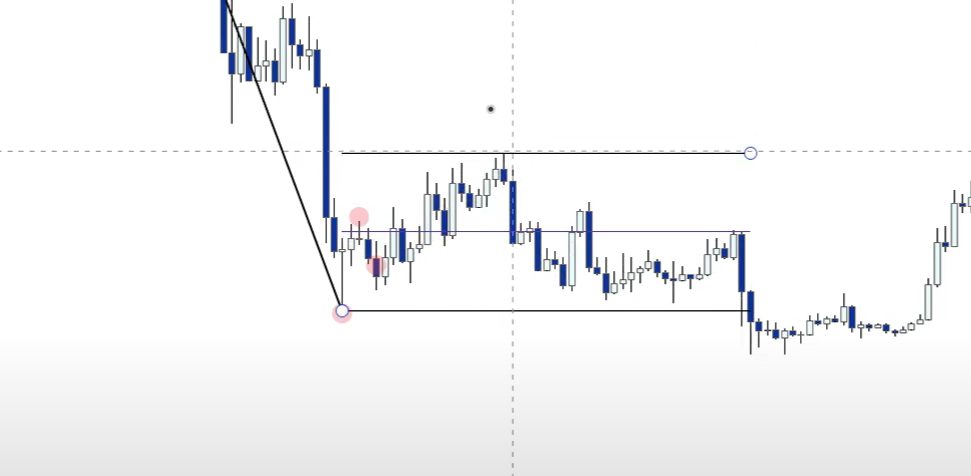
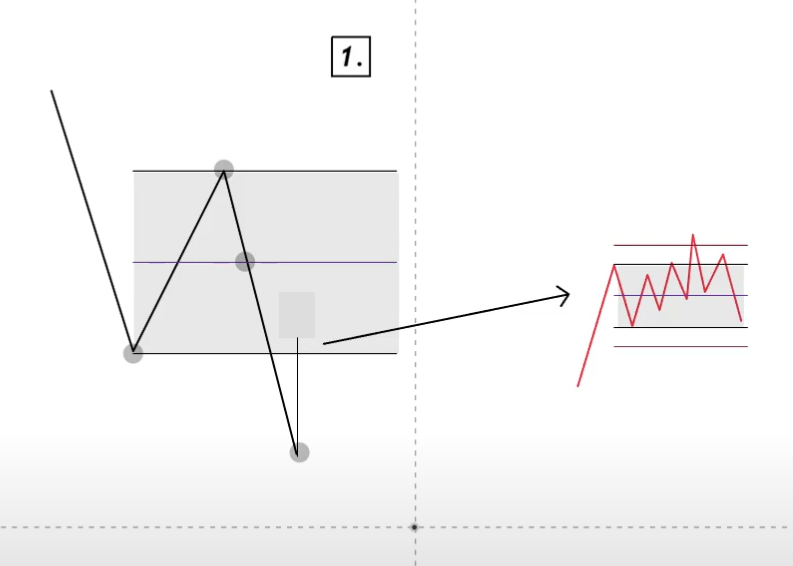
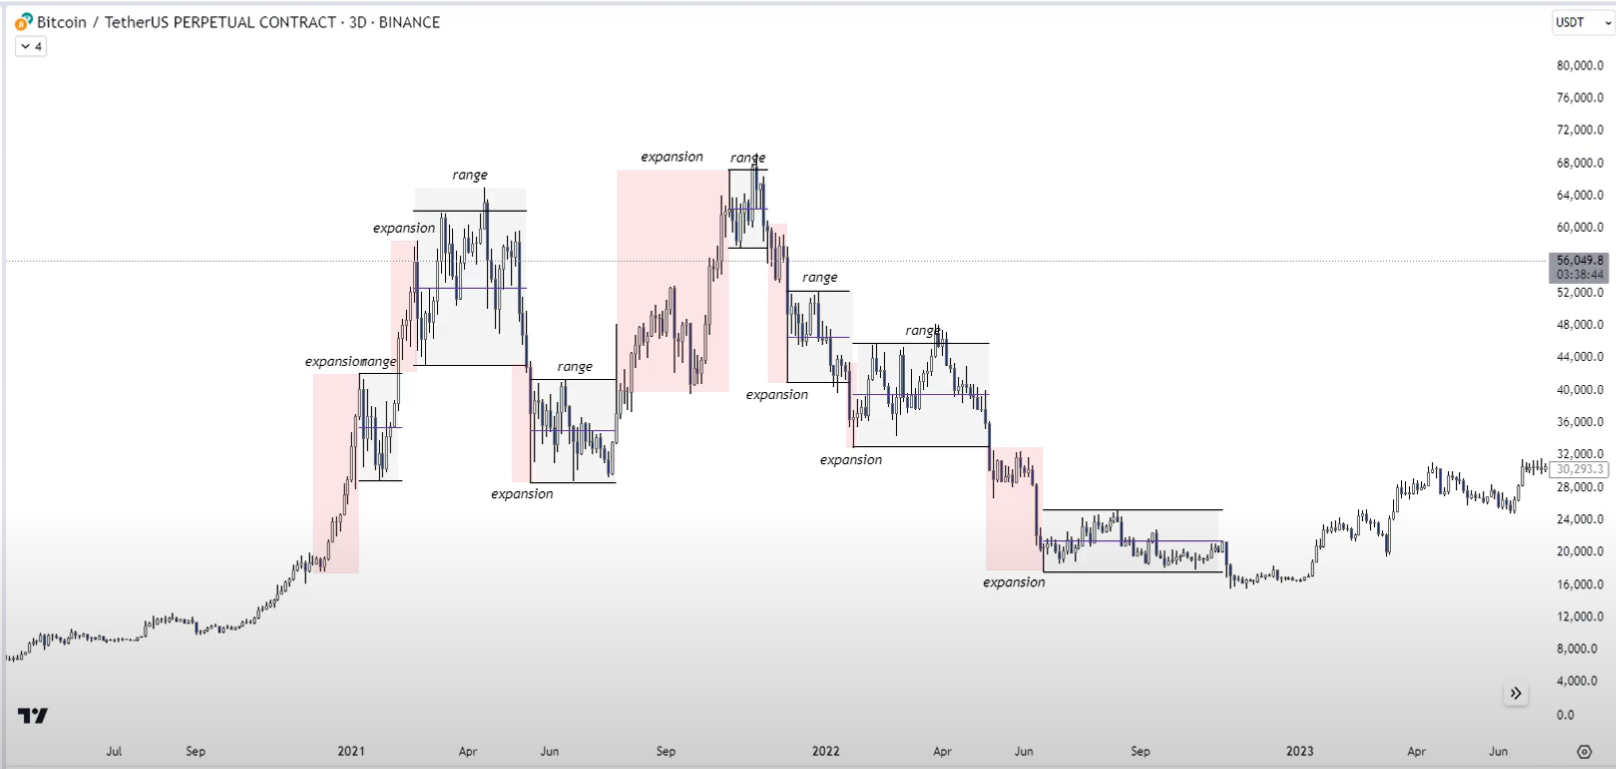
When you apply this on a real chart, you often discover the range you originally drew has expanded:
The latest range had a range high, and then later a market structure high — which is a deviation of this range, not the same thing. Even when price continues trending, the intermediate structure forms new ranges and deviations.
Original range:
New range to include the deviation:
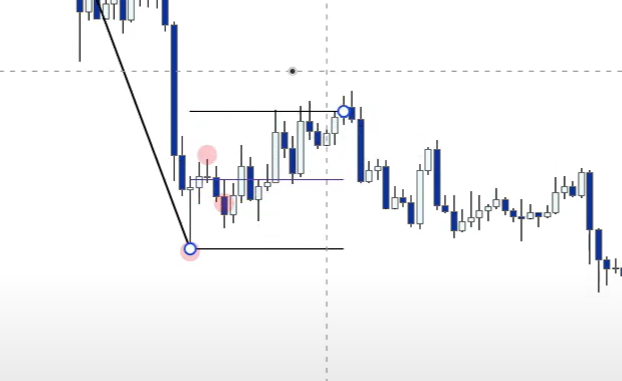
Final range:
Always check the highest timeframe the range is valid in. Apply the six-candle rule on that timeframe.
Deviations
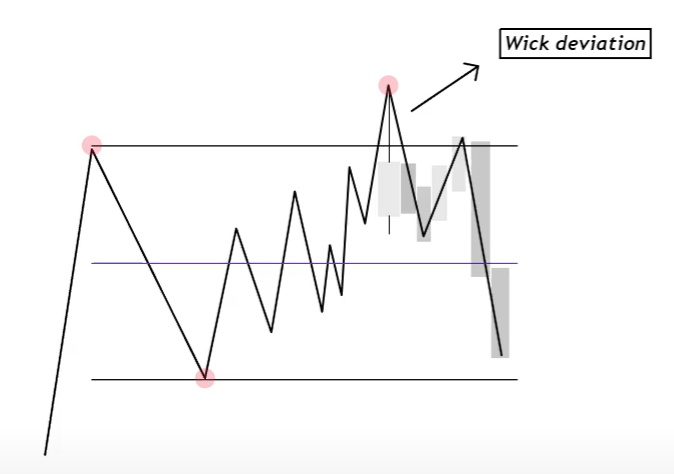
A deviation happens when price temporarily breaks the range high or low but fails to continue — in other words, it doesn't confirm a breakout. Deviating the high usually signals price will reverse down toward the range low. Deviating the low usually signals a reverse back up to the range high.
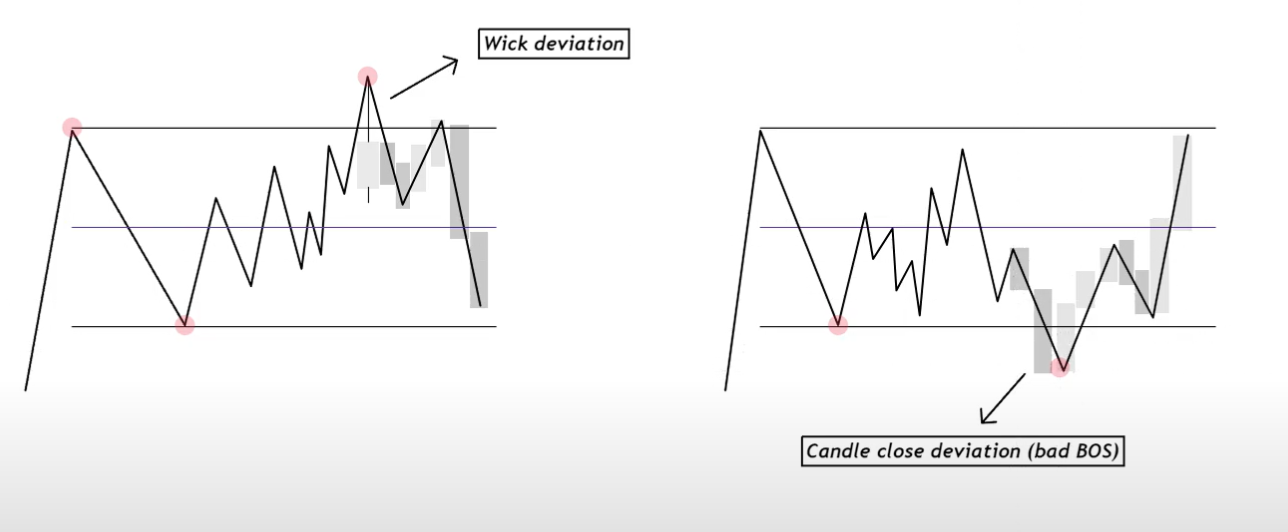
There are two common types:
Wick deviations are the most obvious and easy to spot. A wick through a range boundary that doesn't break structure = likely reversal.
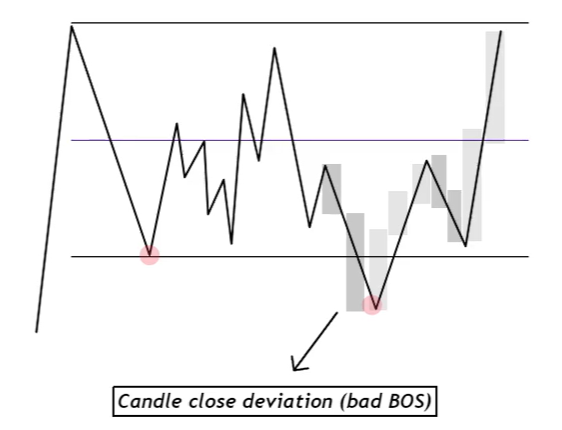
Candle close deviations (bad breaks) are when price briefly closes beyond the range, but quickly returns inside. These are bad break-of-structures, and fall under the category of deviations.
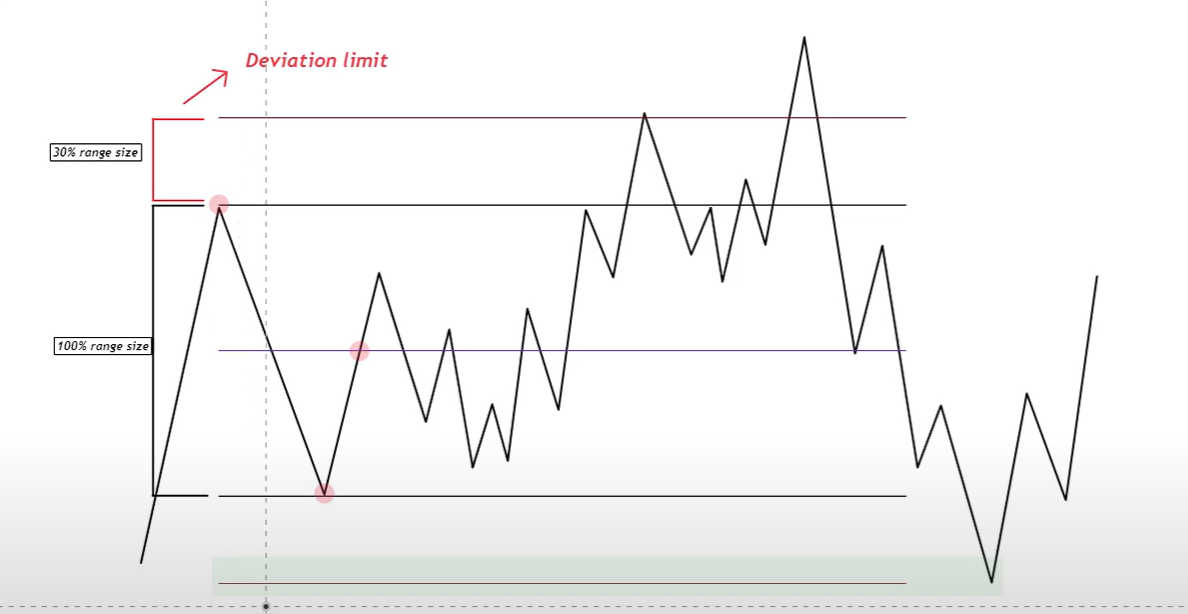
The Deviation Limit (DL) Tool
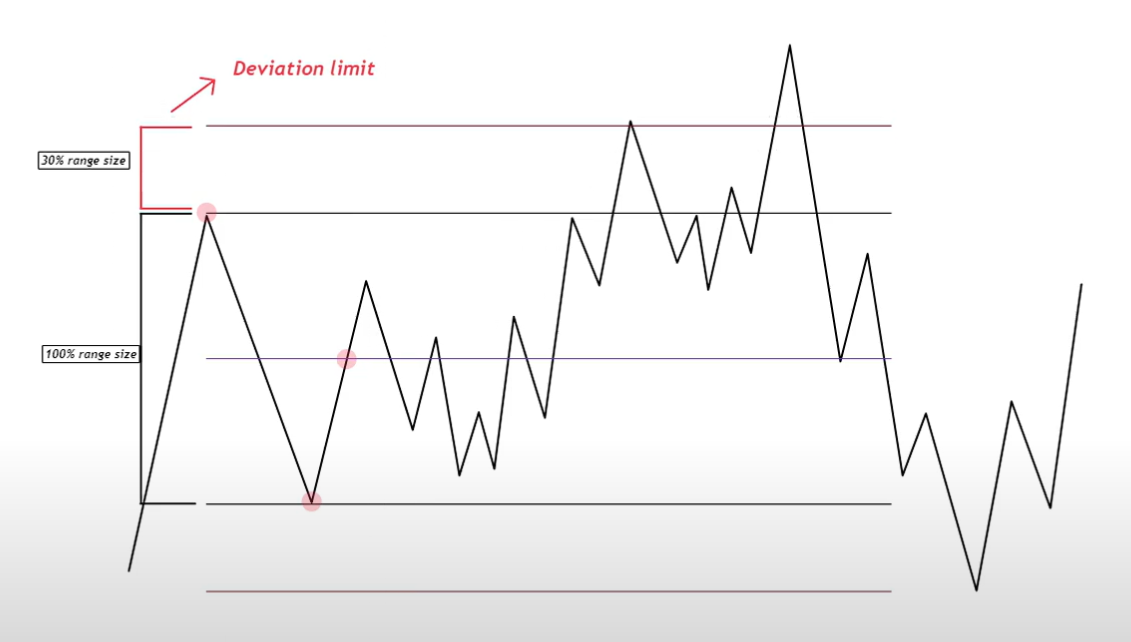
DL is a tool to quantify deviations using a 30% threshold.
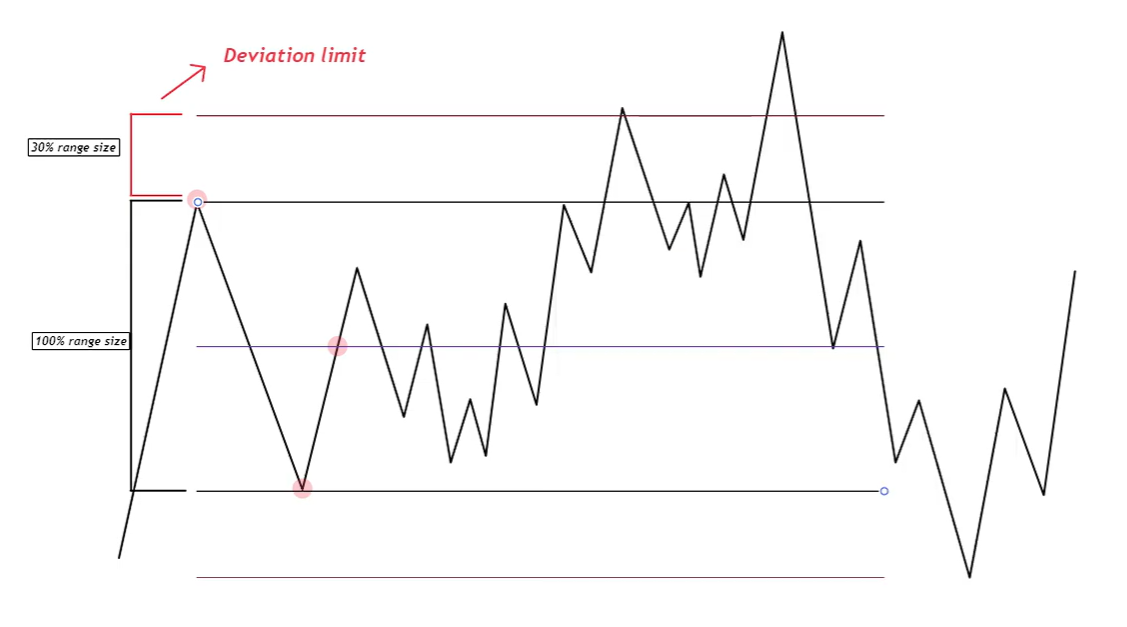
How to implement: add 1.3 and -0.3 levels on the Fibonacci tool. The area 30% above the Range High and 30% below the Range Low defines the maximum range for a deviation.
- If price exceeds DL and closes, it's no longer a deviation — it's a true break.
- If price touches or closes just slightly beyond, but is within or at DL and returns, it's still a valid deviation.
Additional rules:
- When price deviates but doesn't close beyond DL and then returns inside, extend your Range High/Low to the new deviation point.
- If a demand or Supply zone overlaps with the DL zone, DL should be slightly adjusted to account for those. Demand in green — we can close within the demand zone and still bounce:
- Lower timeframes = stricter deviation requirements. Wicks and fast rejections preferred. Higher timeframes allow more lenience, as they naturally include deeper moves and longer manipulation (heavier) to trap more people.
Why Highest Valid Timeframe Matters
Always check the highest timeframe that the range is valid on — especially to assess if something is truly a deviation or a break of structure.
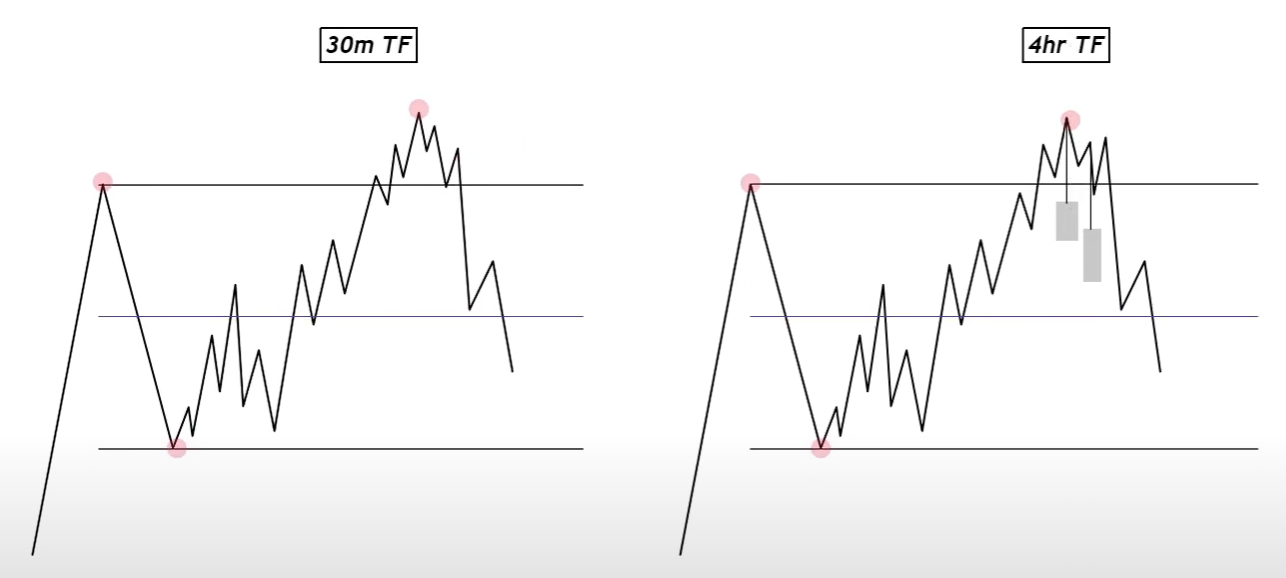
A move may look like a breakout on the 30-minute chart, but on a 4-hour or daily chart, it may only be a wick or a minor deviation. You can always check using your DL tool.
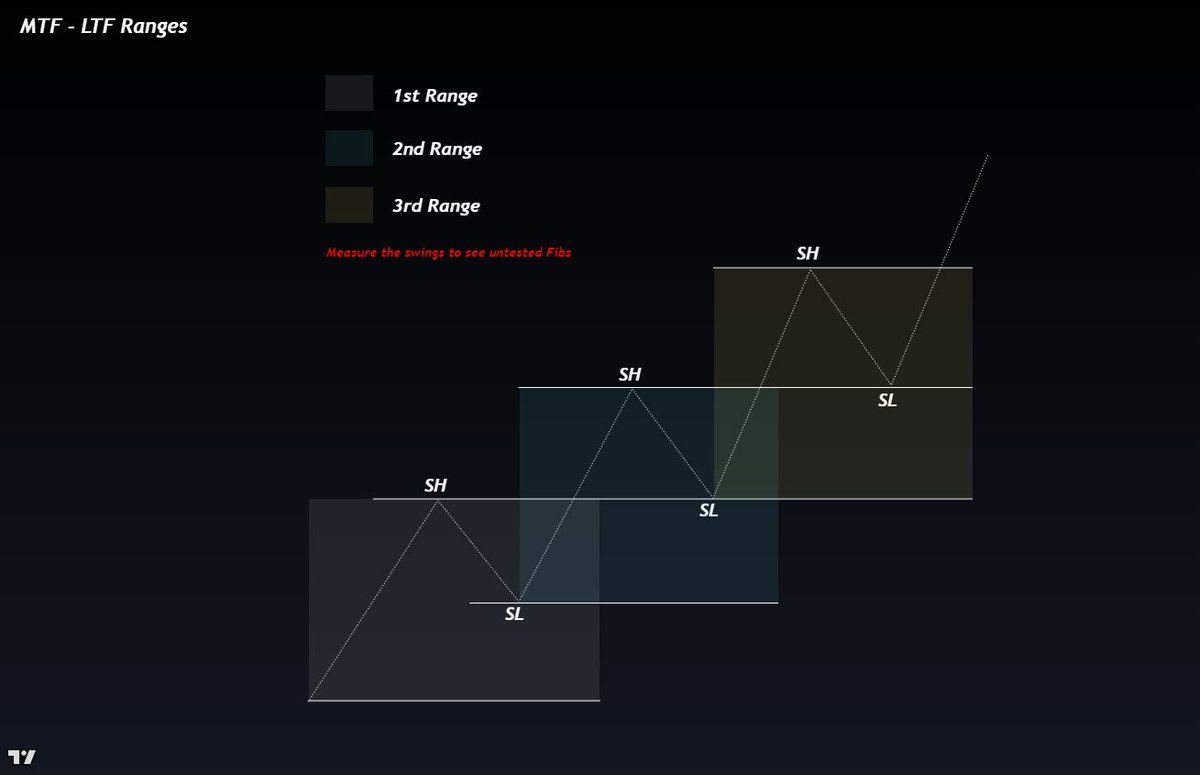
Nested Ranges: Ranges Within Ranges
When multiple market structures exist across different timeframes, this leads to multiple valid range pools.
A macro trend might show an uptrend from A → B → C:
But within that leg from A to B, a lower timeframe may show a local downtrend:
This means: on the HTF, you pull a range from top to bottom; on the LTF (during the retrace), you may have a downtrend, so you pull a range from bottom to top. These overlapping structures create nested ranges: a local range inside a macro range.
Almost every macro range contains multiple internal ranges. This occurs because price makes multiple rotations between premium and discount zones of a macro range before reaching extremes:
You can have:
- A 3-day range containing a 4-hour range.
- That 4-hour range can contain a 1-hour range.
- And that 1-hour range can contain a 15-minute range.
There can be multiple ranges within a range. Your job is to find the most appropriate range for your trade.
From equilibrium (0.5 fib): above 0.5 → Range High = Premium zone. Below 0.5 → Range Low = Discount zone. Price may rotate repeatedly between these zones without ever breaking out.
Drawing Structure While Ranging
While price is ranging, do not attempt to draw market structure trend legs (HH, HL, LH, LL, etc.) unless a clear trend emerges. Instead, focus on the most recent expansion leg inside the range:
- If price just moved up, look at structure from low to high.
- If price then starts dropping, look from high to low.
This allows proper range drawing and analysis of internal range rotations.
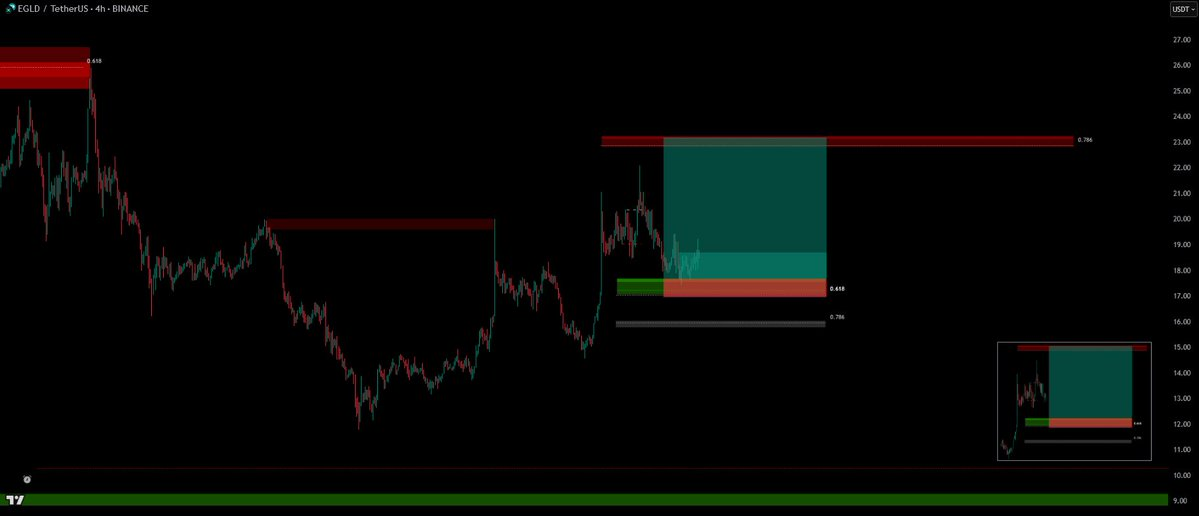
In the bottom mini-range, as price stalled into this range, you can look for longs into the premium section of the macro range. In the top mini-range, as price stalled into this range, you can look for shorts into the discount section of the macro range.
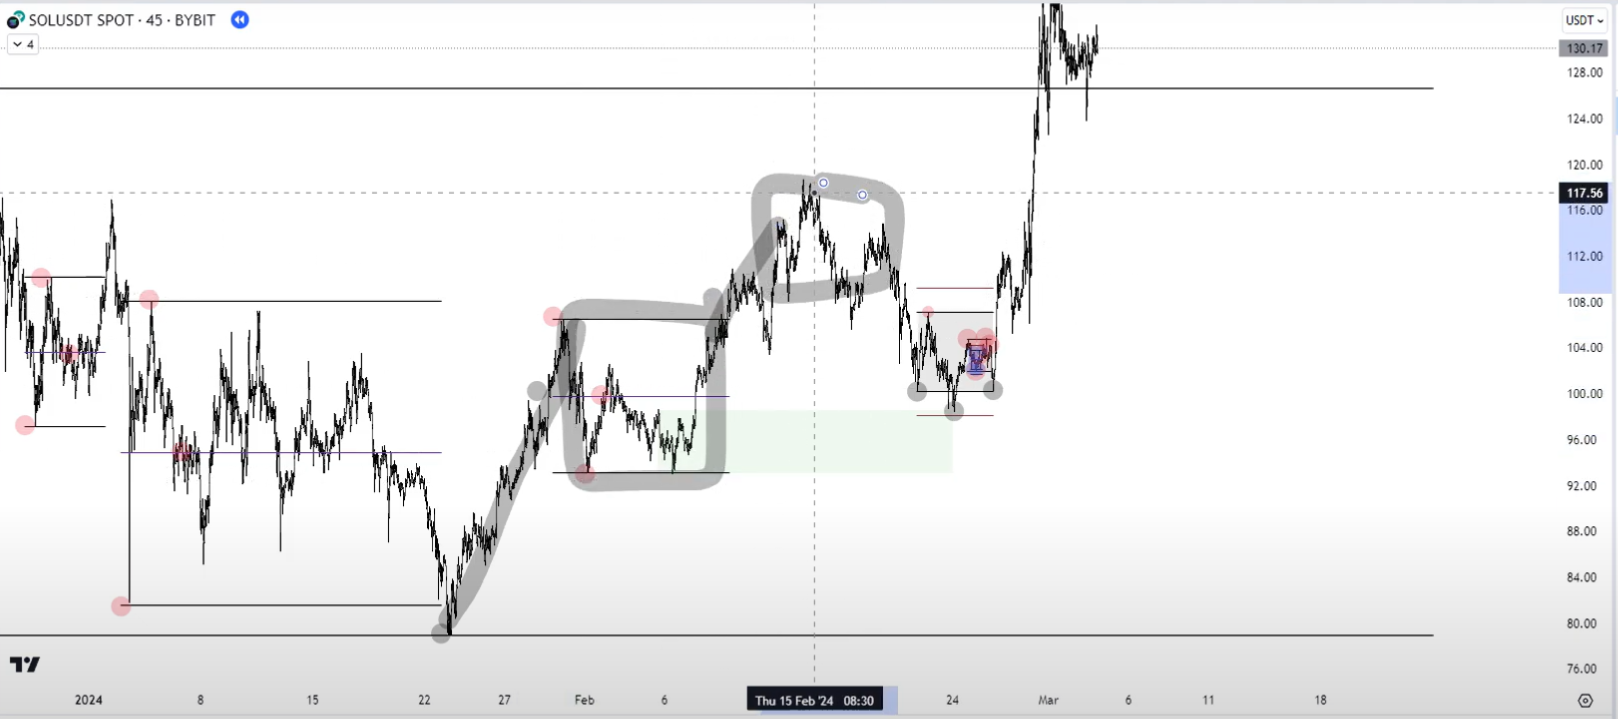
Live Example: Solana
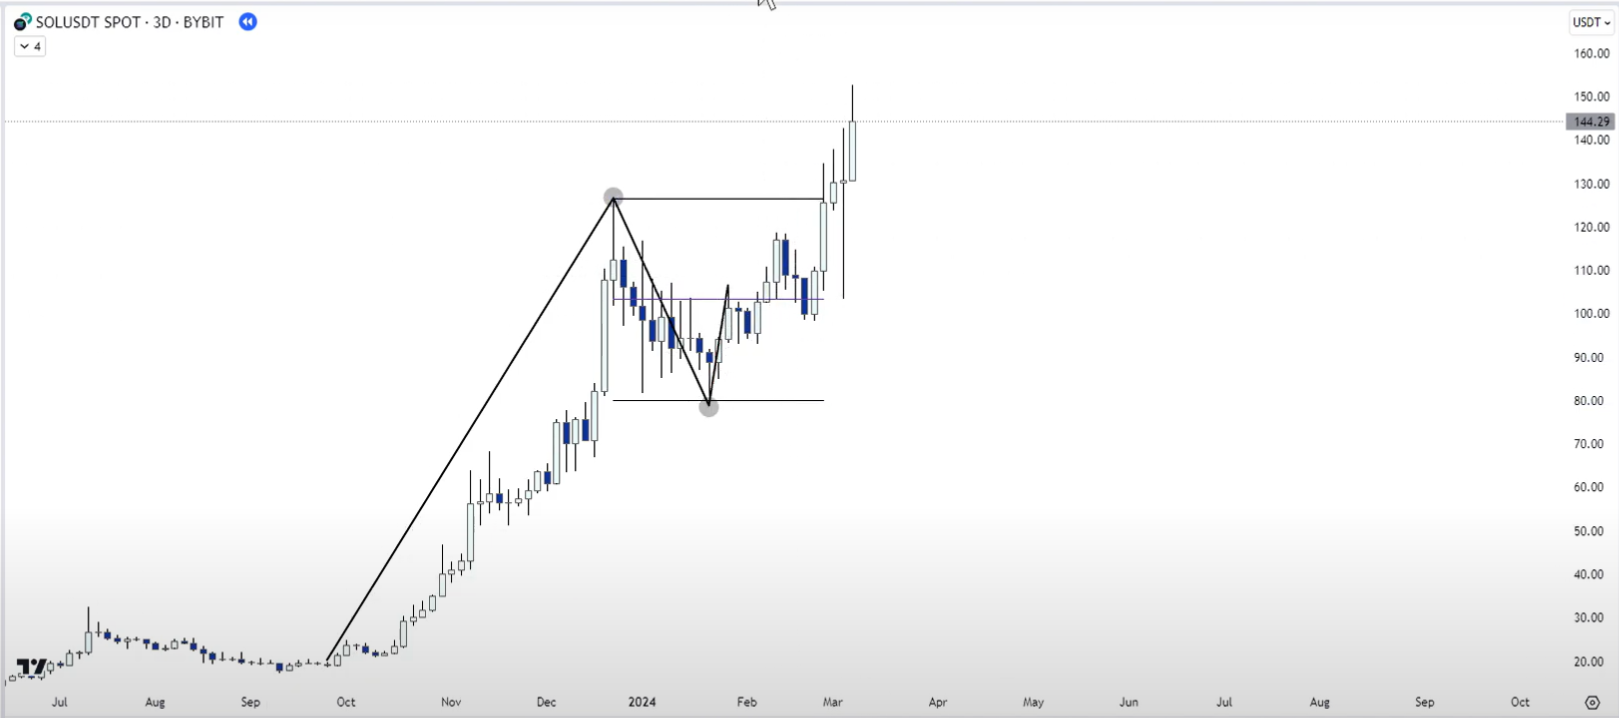
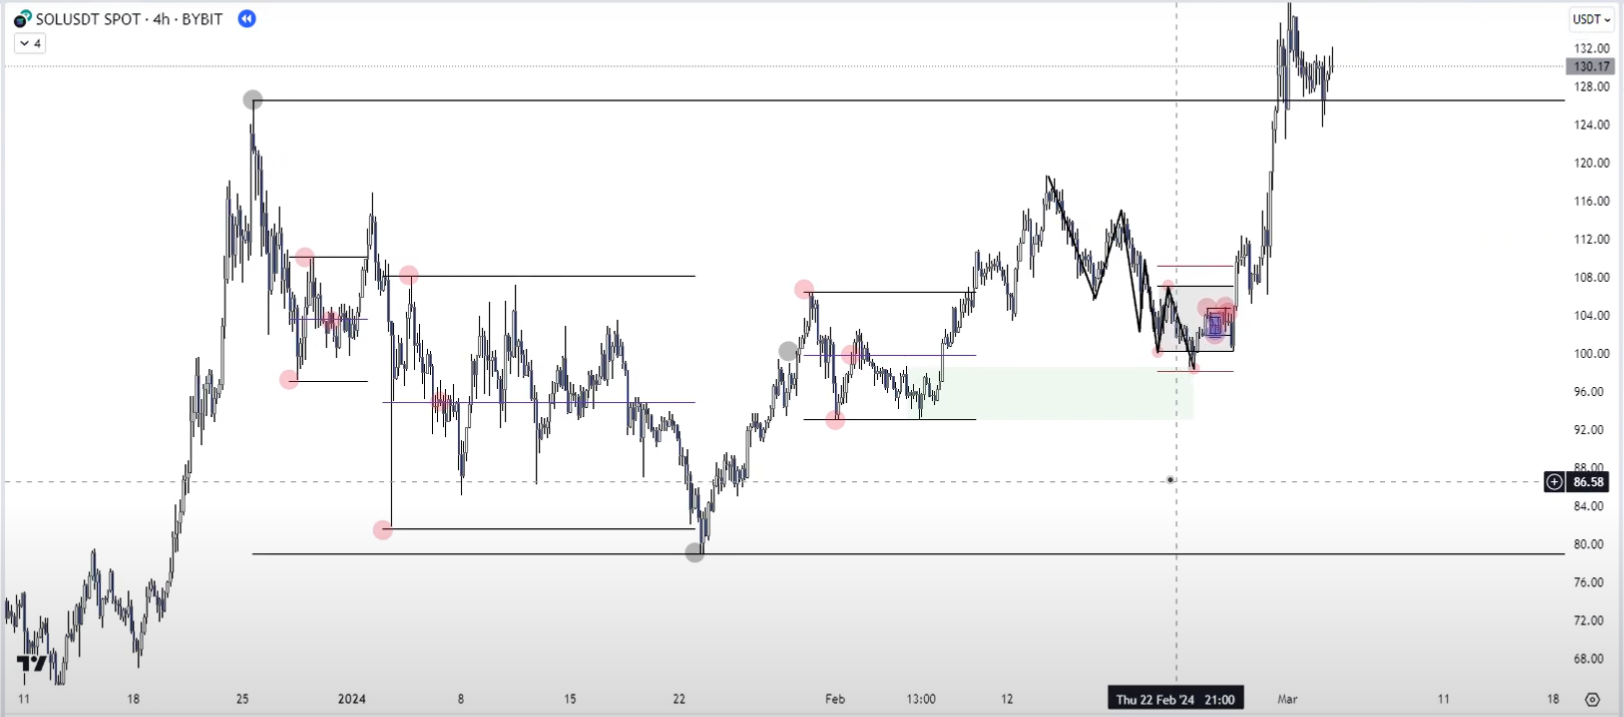
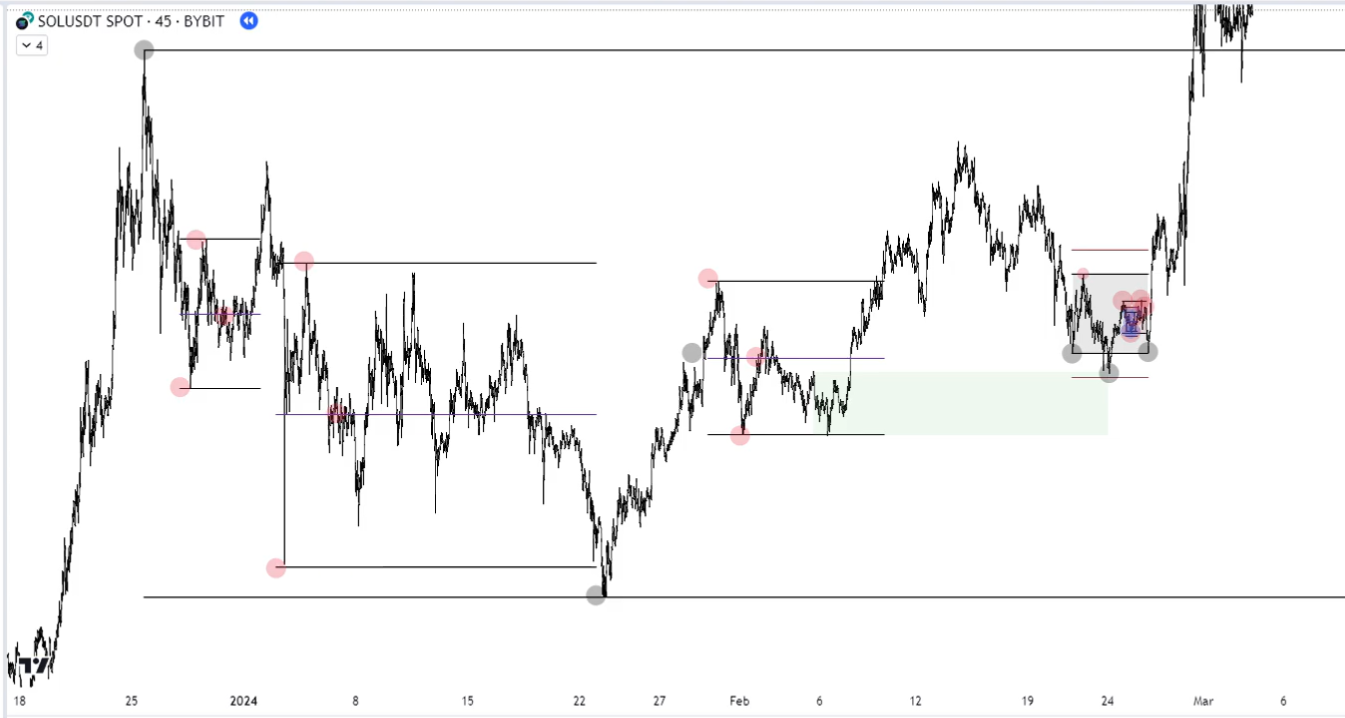
Macro 3-day range: price trended up then stalled → pulled range top to bottom. Six-candle rule applied → range confirmed after equilibrium touch. This large 3-day range was then filled with multiple lower timeframe ranges.
Local ranges inside the macro:
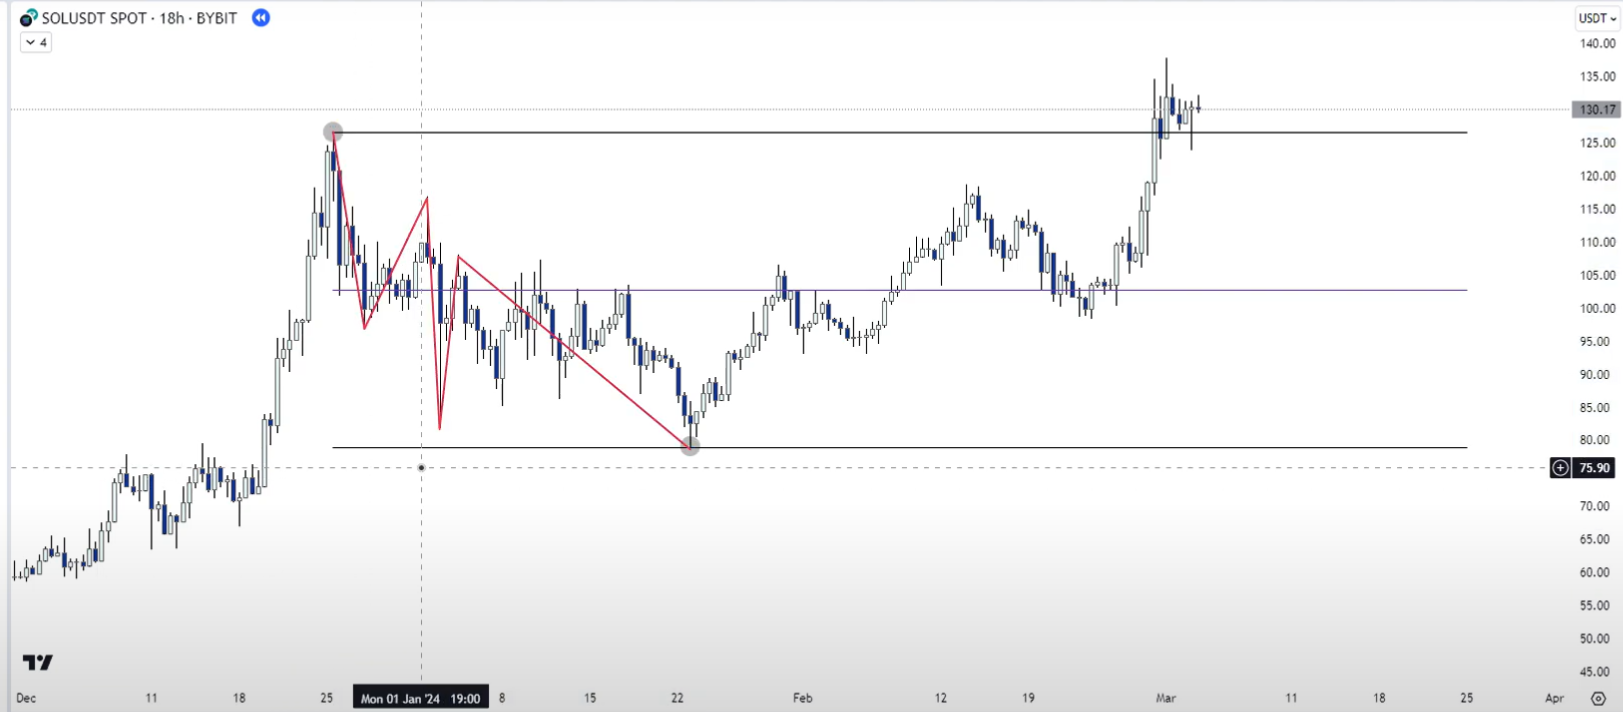
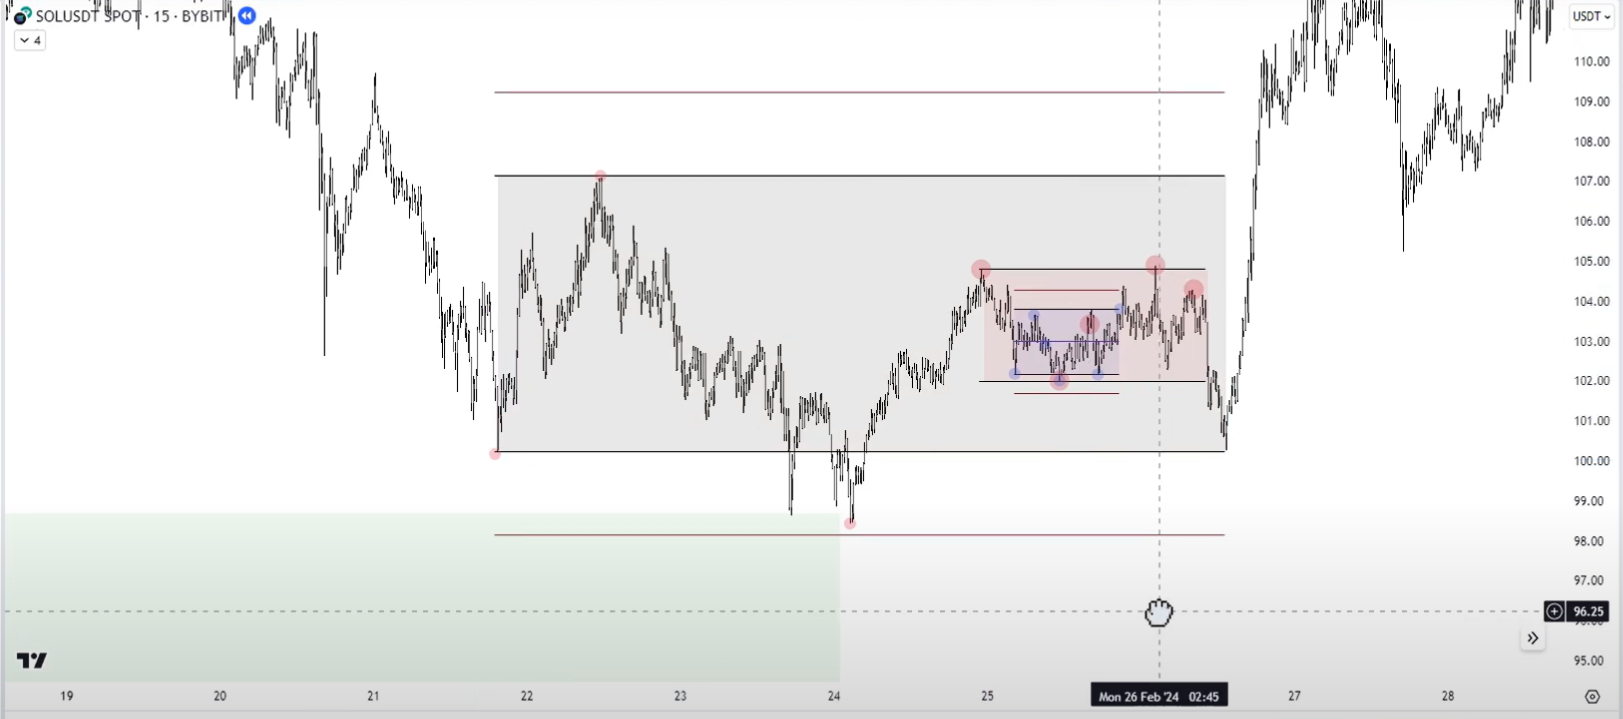
On the 18H chart, price showed a downtrend (high → low → LH → LL). Range pulled bottom to top. Equilibrium touched → range confirmed. A wick deviation above Range High occurred, but price did not close above DL.
This made it a range deviation, not a breakout. Then a new lower-high/lower-low structure formed → another range drawn bottom to top:
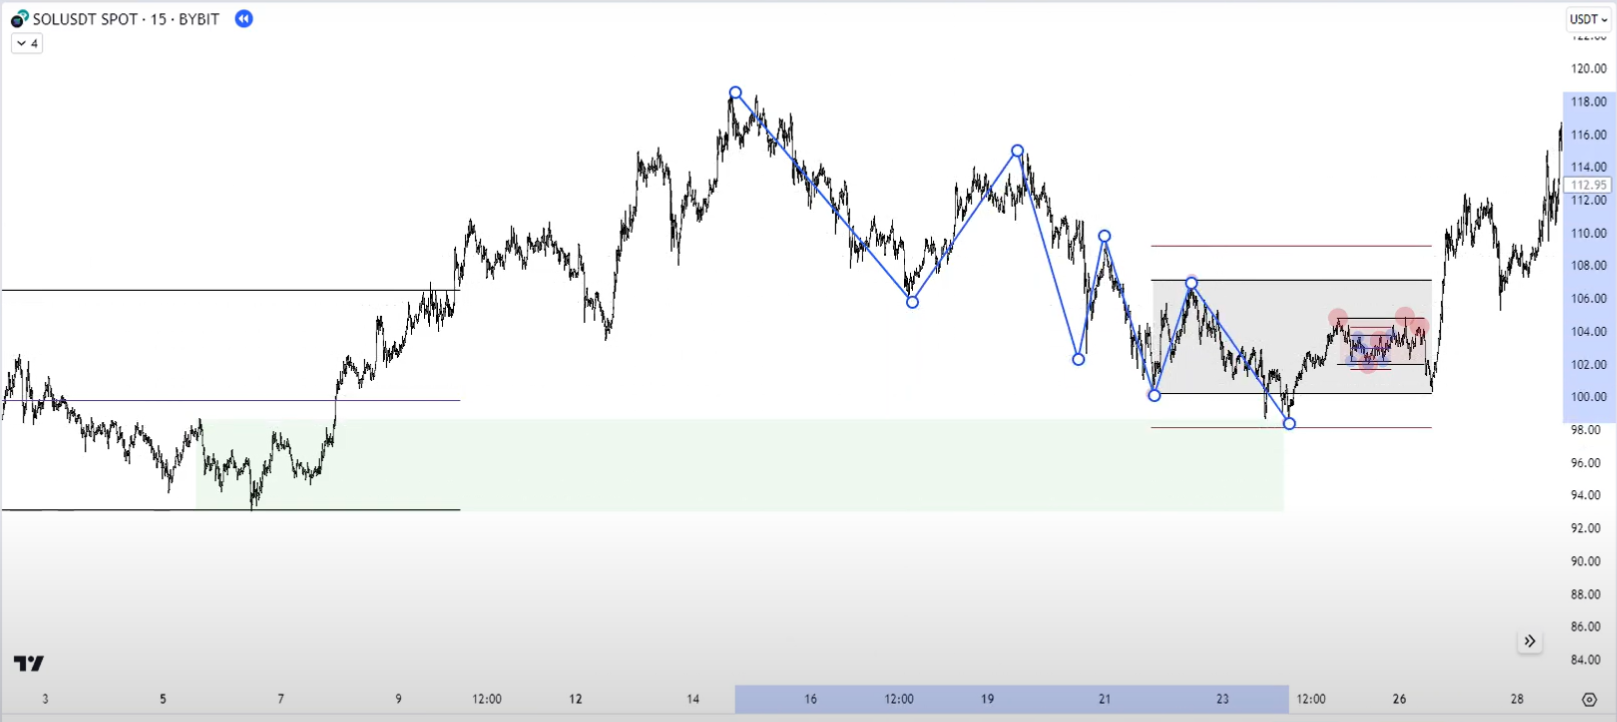
Internal Range Rotations
Inside a large range, price will oscillate many times: premium → discount → premium, etc. During these oscillations, each move (up/down) can be treated as a micro-trend with its own mini-range.
In a range, price drops from premium to discount → this is a downtrend → pull range bottom to top → confirm at equilibrium → watch for rotation. Then price rises again from discount to premium → uptrend → pull range top to bottom → same logic.
Each internal rotation has its own range, and each can be used to find: deviation setups, range-to-range rotations, or micro accumulation/distribution schematics.
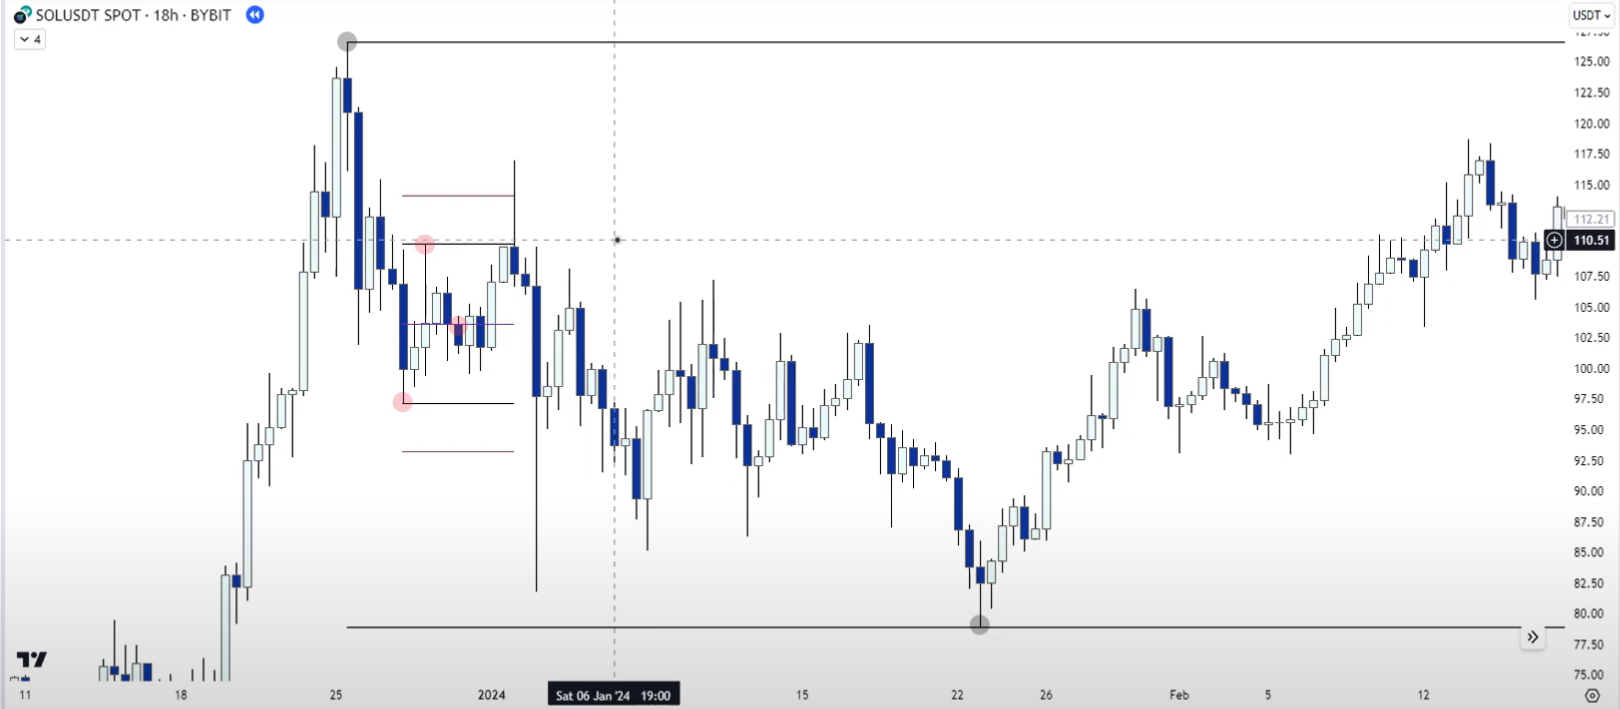
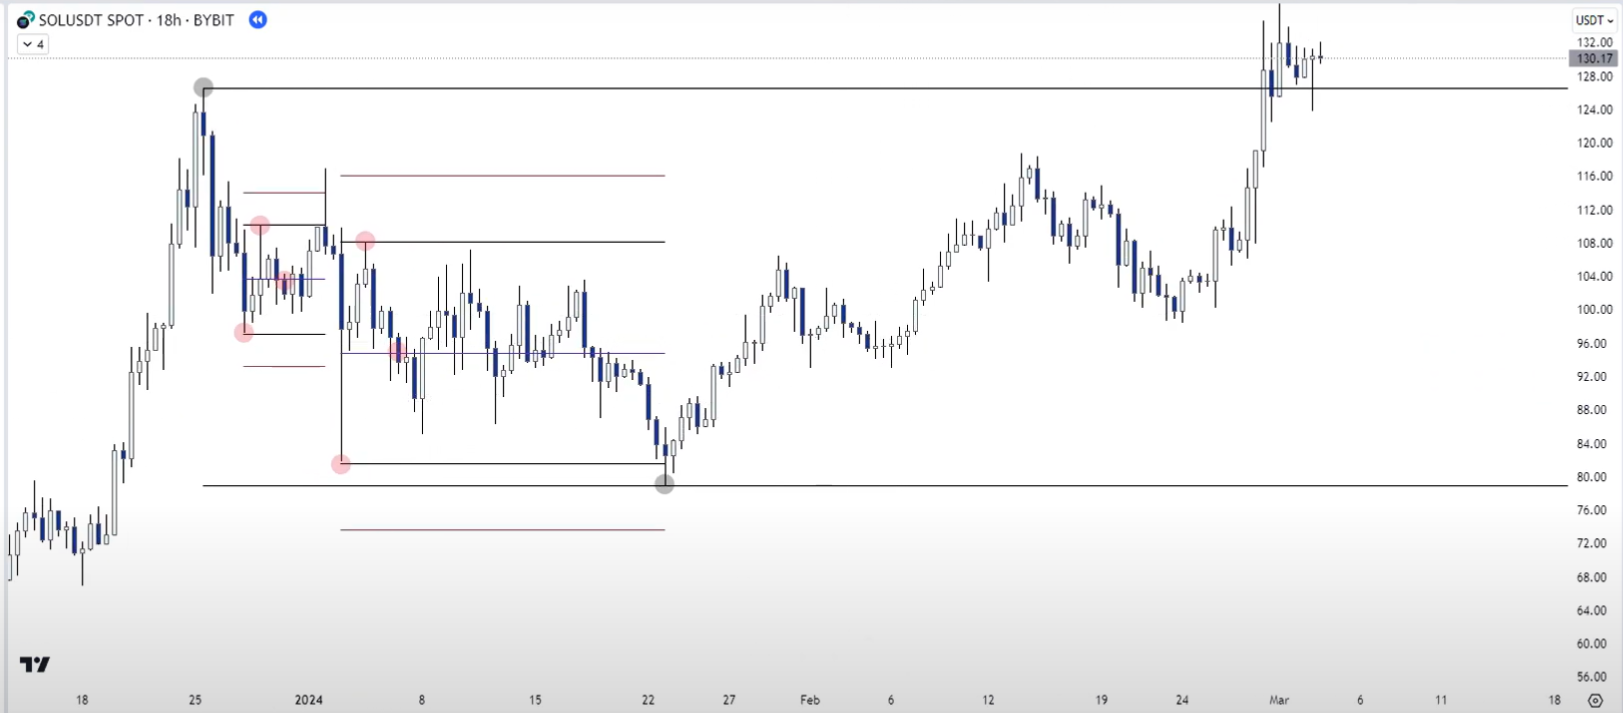
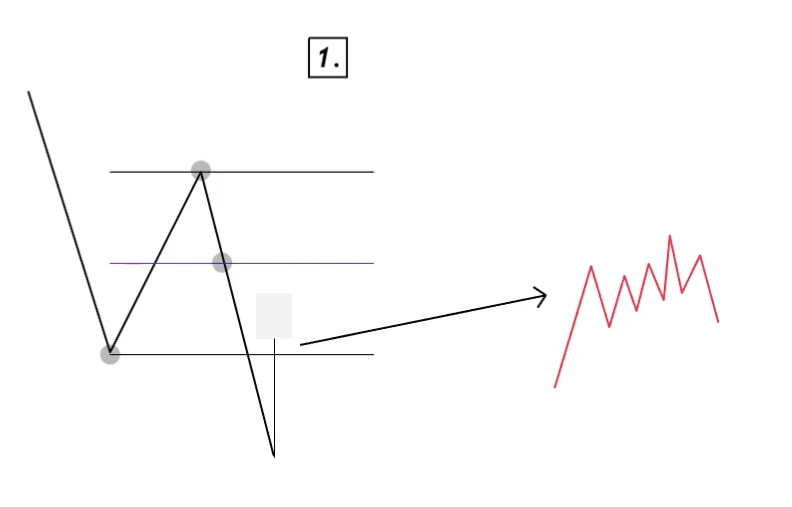
Deviations Within Deviations
A single deviation on a macro timeframe may contain nested schematic behavior. A deviation at 4H could be built from multiple 15m deviations and micro ranges.
- Black range = 3-day macro range.
- Red range = 4H range inside the black range.
- Blue range = 15m range inside the red range.
The red 4H range had a deviation. Inside that deviation, there was a blue range showing a Model 2 accumulation. That accumulation's purpose was to tap the red range's high, leading to a Model 2 distribution. That distribution's purpose was to send price back down to fulfill the higher timeframe accumulation.
This demonstrates the hierarchical structure: higher timeframe dictates direction, lower timeframes provide the setups. Each level has its own range high/low/equilibrium, its own deviation structure, and can contain full schematic patterns. Price continuously respects deviation limits and equilibrium levels.
Any asset not in all-time-high territory will always have ranges within ranges.
Always give priority to the higher timeframe when analyzing market structure, range validity, and deviation importance. High-timeframe schematic setups override lower ones — a local distribution inside a red 4H range may still be part of a macro accumulation on the 3-day chart. The principle of 👑Timeframe Rules applies: HTF > MTF > LTF.
Good Ranges vs Bad Ranges
While many ranges can be technically valid, not all are practically tradable or rational from a price action perspective.
Technically valid ranges follow the rules: price moves from high to low or low to high, returns to equilibrium (0.5 fib), and is confirmed via the six-candle rule. But even if a range is valid structurally, it may not be rational or clean.
Bad range characteristics:
- Very V-shaped price action.
- Sharp and aggressive moves, not sideways consolidation.
- Often seen during aggressive trends — price just wicks and flies back, leaving no clean internal structure.
These types of ranges are hard to trade, offer poor schematics, and usually don't present ideal accumulation/distribution setups.
Good range characteristics:
- Horizontal price action.
- Clear rotations between premium and discount.
- Clean deviations (wick or candle close) that respect DL thresholds.
These offer easier internal structure drawing, better schematic formations, and higher-probability setups.
Don't draw ranges just because the rules allow it. Ask yourself: does price actually look like it's consolidating? If the price action is too sharp, the better approach is to wait for cleaner, more horizontal structures.
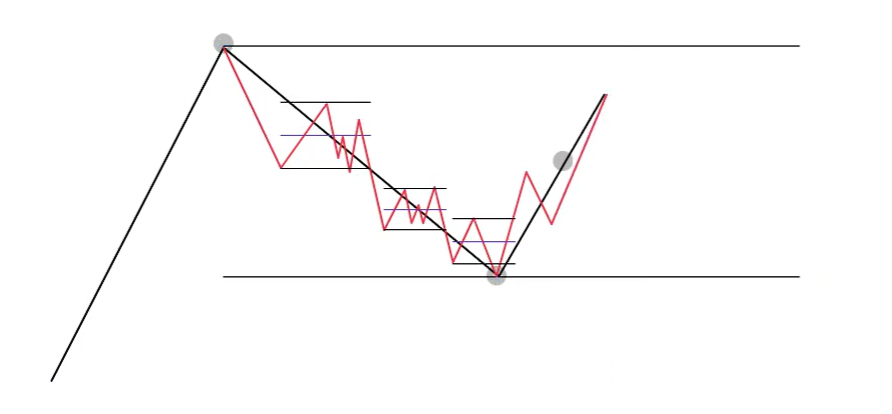
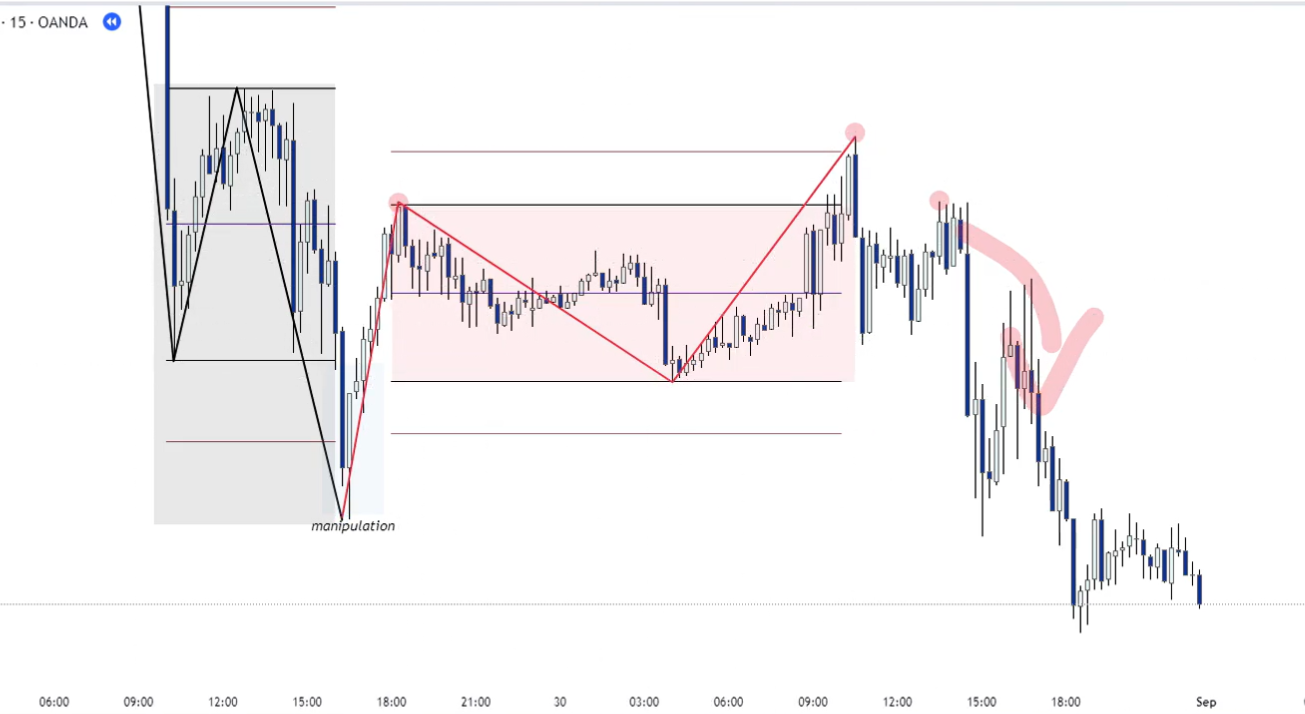
LTF PA in red from the wick. Technically valid range with deviation (based on structure rules). But it has very sharp movements. There's an HTF range and an LTF range — you'd rather trade the LTF range which looks better:
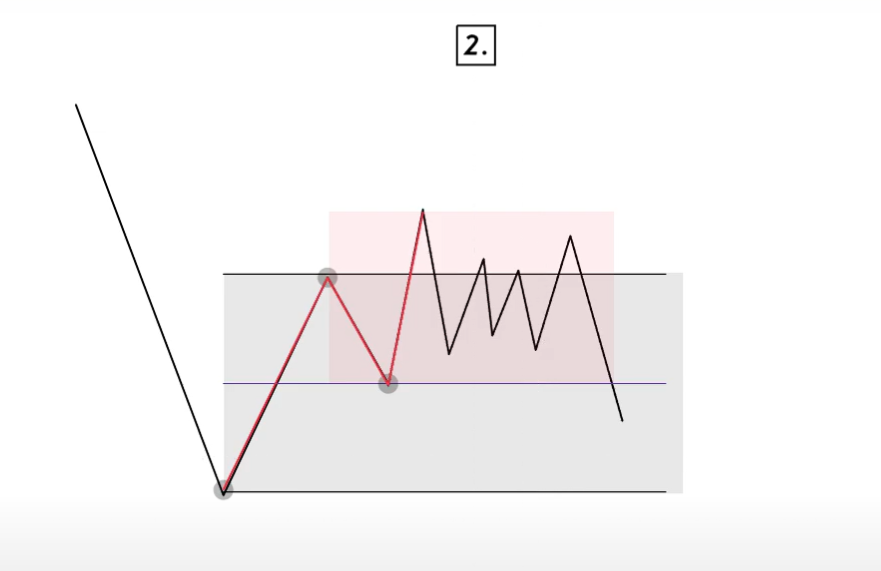
You'd pay more attention to the red range than the black range. What could happen is the LTF red range breaking down and deviating the range low to make a bigger range:
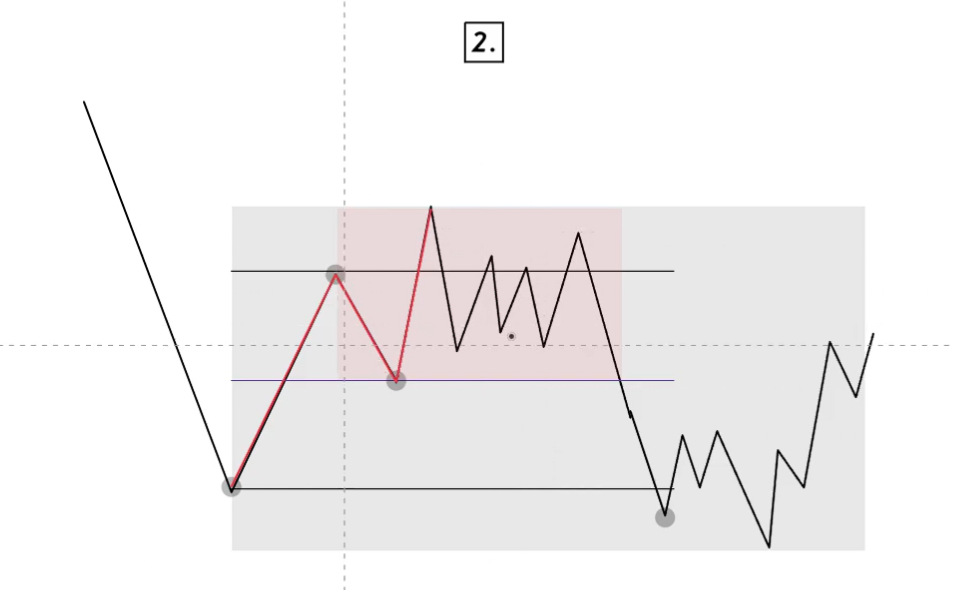
Scenario Comparison
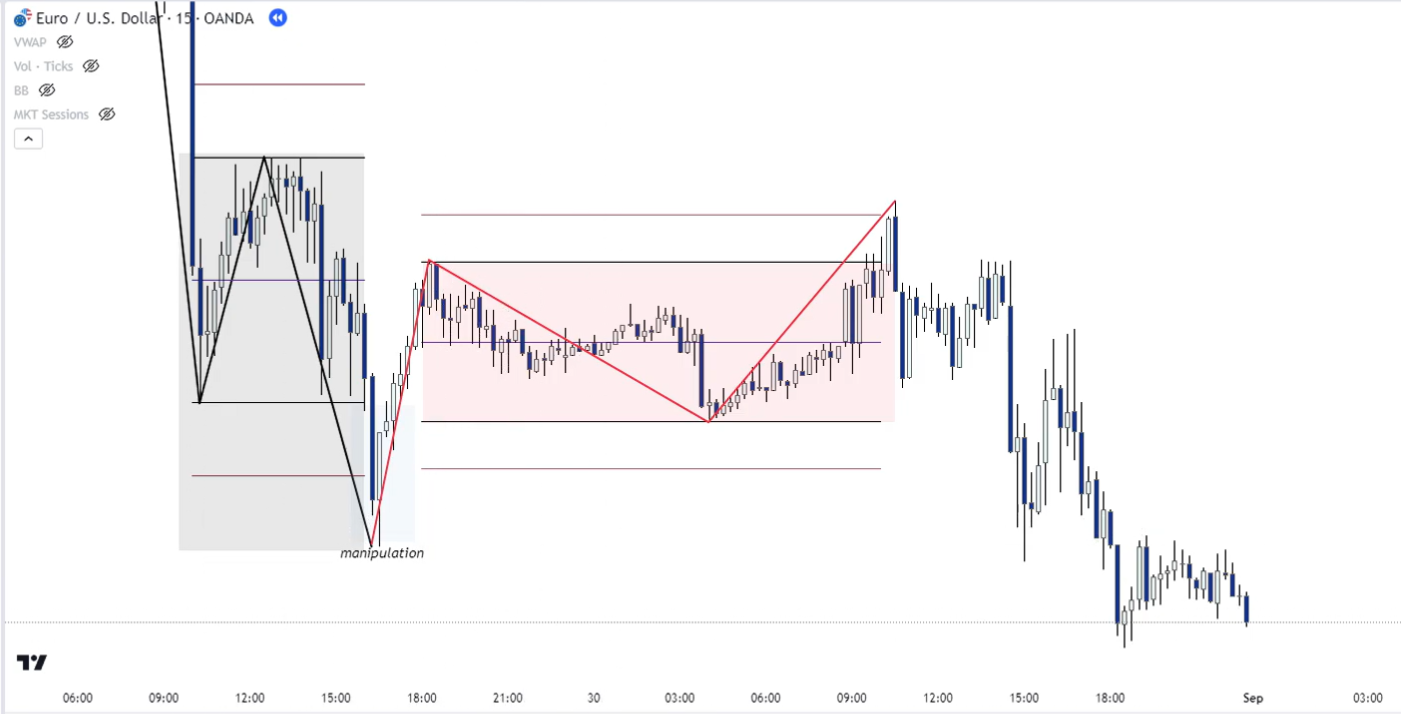
Scenario 1 (black): V-shaped aggressive downtrend. Price moves down sharply → creates a wick → bounces up. Technically valid range with deviation, but it's V-shaped, no clean horizontal movement, difficult to trade, little schematic clarity.
Scenario 2 (red): clean sideways movement. Instead of a V, price consolidates. Clear structure with highs/lows. Multiple deviations. Easy to spot accumulation/distribution patterns. Way more tradeable and reliable.
Both are "valid" ranges, but only the second is rational to trade.
Summary of the Range Framework
Core recap:
- A range is when price moves sideways to re-balance buyers and sellers.
- When uptrending, pull your range top to bottom.
- When downtrending, pull your range bottom to top.
- A range is only valid on a timeframe if the six-candle rule applies.
- A range is confirmed after a touch of the equilibrium (0.5 fib).
Deviation types:
- Wick = simplest and cleanest.
- Candle close deviations = bad break of structure → still a deviation.
- Use the DL set at 30% to quantify extreme deviation limits:
If price closes beyond the DL, it's a true breakout. If price stays within the DL, it's a deviation.
Nested ranges are normal:
Expect ranges within ranges — 3D → 4H → 1H → 15m. Each can be used for its own structure, deviation, schematic, and entry strategy. Lower timeframes feed into the goals of higher timeframe schematics.
When we have a range, the most important market structure to look at is the most recent rotation:
After each big move, the range to monitor is boxed.
Be rational: if price is not moving sideways, don't treat it like a range.
All of this builds toward understanding schematic models. Knowing how to properly draw ranges, identify valid deviations, and recognize structure inside ranges gives you the framework to detect Accumulation and Distribution patterns that fuel trades.
Range Highs and Lows as Decision Points
Now apply this. Once you have a range drawn properly, the high and the low become decision points — places where you act, not where you hope.
Focus on the 🔑 levels at HTF demand, at the lows of the HTF range (extreme discount), as the best R/R is there. If you're playing on the HTF, focus on a bigger range. If you're on the MTF/LTF, focus on a smaller range.
Reference the major charts when buying or selling altcoins at the bottom or top of their ranges — they act as confluence. If an altcoin gets to a key level in the discount zone early and Bitcoin is due to lose its HTF/MTF range (broken past its SL), then you can assume the altcoin will go down even further. Check Multiple Charts.
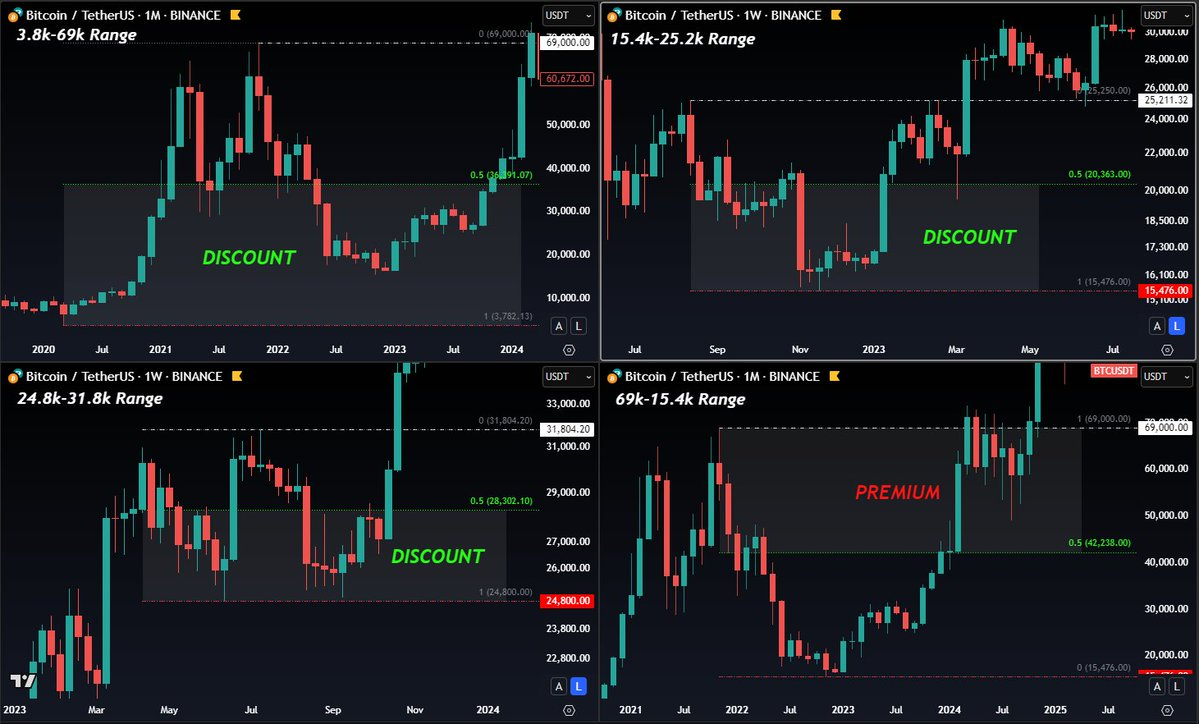
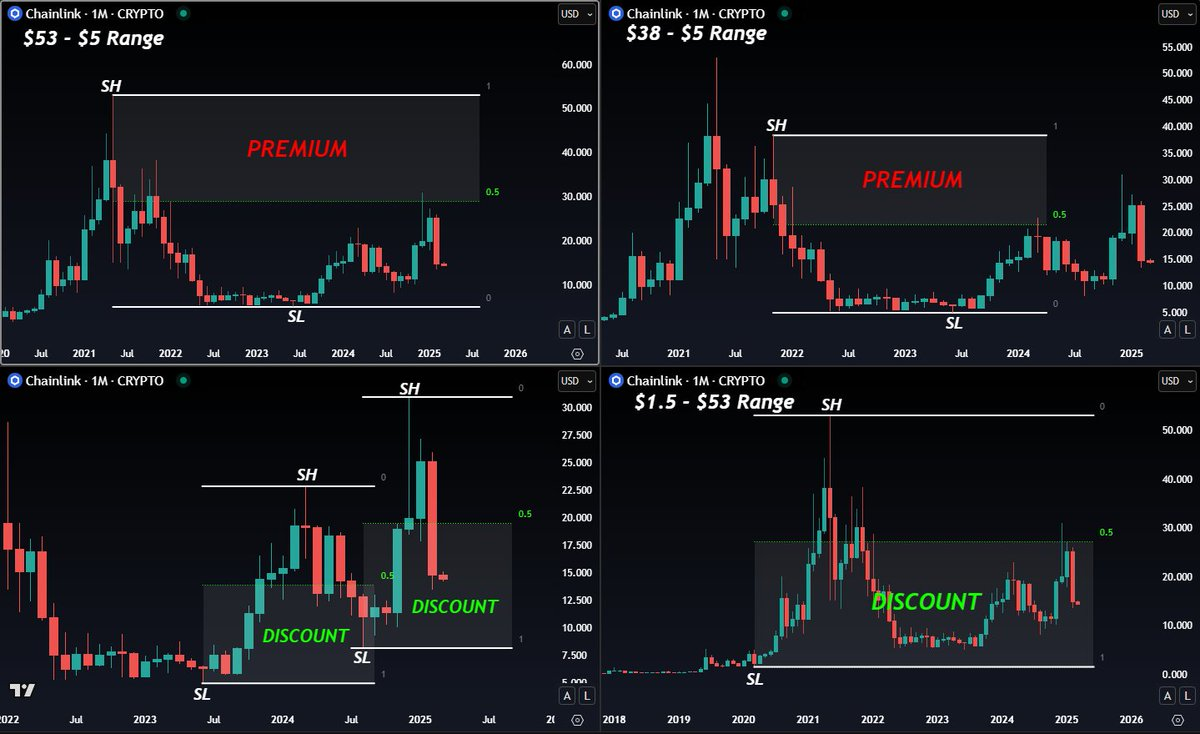
It's always important to identify where PA is currently within the chosen range — Discount, Extreme Discount, Premium, Extreme Premium, or Equilibrium. From the HTF, find the range high and low, set fibs, and read the level:
"Trade on that range, not to the moon."
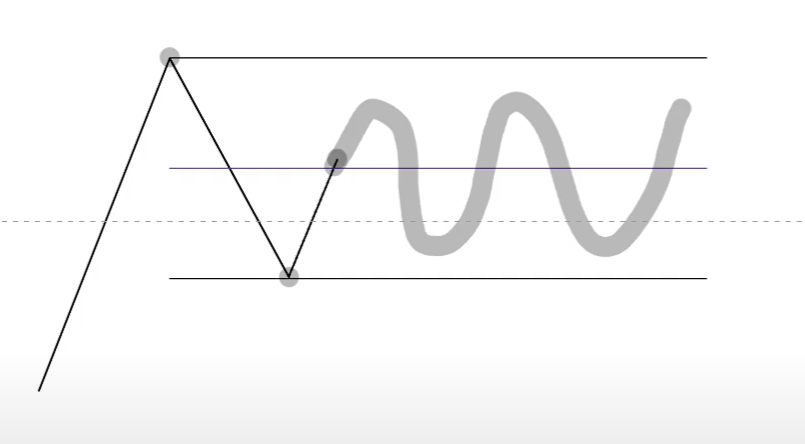
If there are no significant imbalances, OBs, or fresh supply/demand levels, PA will fly into a "fresh" level and build a new trading range:
If your coin is in price discovery, a new MTF range will often form, and new profitable entries can be found. However, such trades are not optimal, and not all coins will be in price discovery simultaneously. If you can't find the type of trades you normally look for, look at a different chart and find your nice key levels. There are multiple charts with ♨️Key Levels🗝️ due to be hit; you just have to take the time to find them.
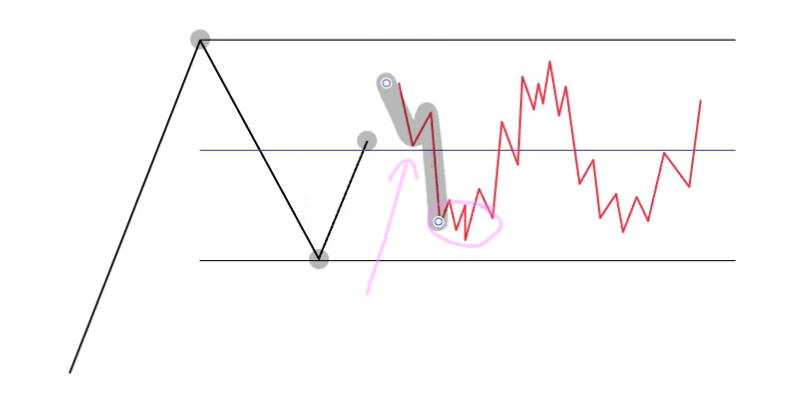
If your coin has gone past ATHs and there are no key levels above, where can you expect PA to be attracted? You have to be cautious — PA will fall straight back into its range where the key levels are presented. If you're an investor or HTF trader and you think the coin will reverse sharply after passing ATHs, you can use negative Fibonacci levels to find the most suitable areas to sell.
If no blow-off top is printed on a new coin, one will be created. Once PA retraces into the equilibrium (discount zone) on the HTF after the ATH, your new range will be formed. Over time it will range between the lows and the printed ATH until there is a BOMS. With the newly formed range, you can find your new premium zone.
If existing coins already had a blow-off top in the previous cycle, they will most likely stay under the ATH and react to all imbalances, HTF supply/demand levels, and untapped OBs.
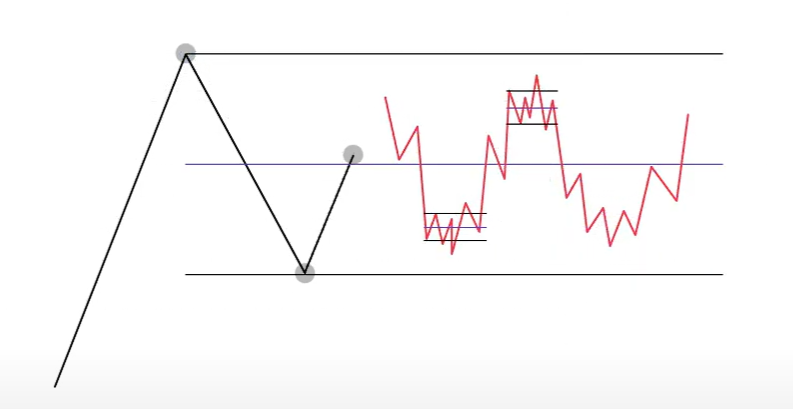
Master identifying the current range and avoid reacting late to PA in the middle of ranges, as the higher probability of success lies at the top/bottom of the ranges. Keep an eye on BOMS on the HTFs:
- There will be GREED and FOMO at the top of the range.
- There will be FEAR and PANIC-SELLING at the bottom of the range.
At the bottom of ranges, engineering liquidity occurs before the strong move. PA accumulates over time. Retail loses money regularly in this range, and the MMs fill their bags in preparation for the next major move out of the smaller range, ready to sell at major key levels in the bigger range.
BTC and other majors need to show a BOMS on the HTF if you want to see altcoins break out into their new trading range. Keep an eye on the ranges on major charts.
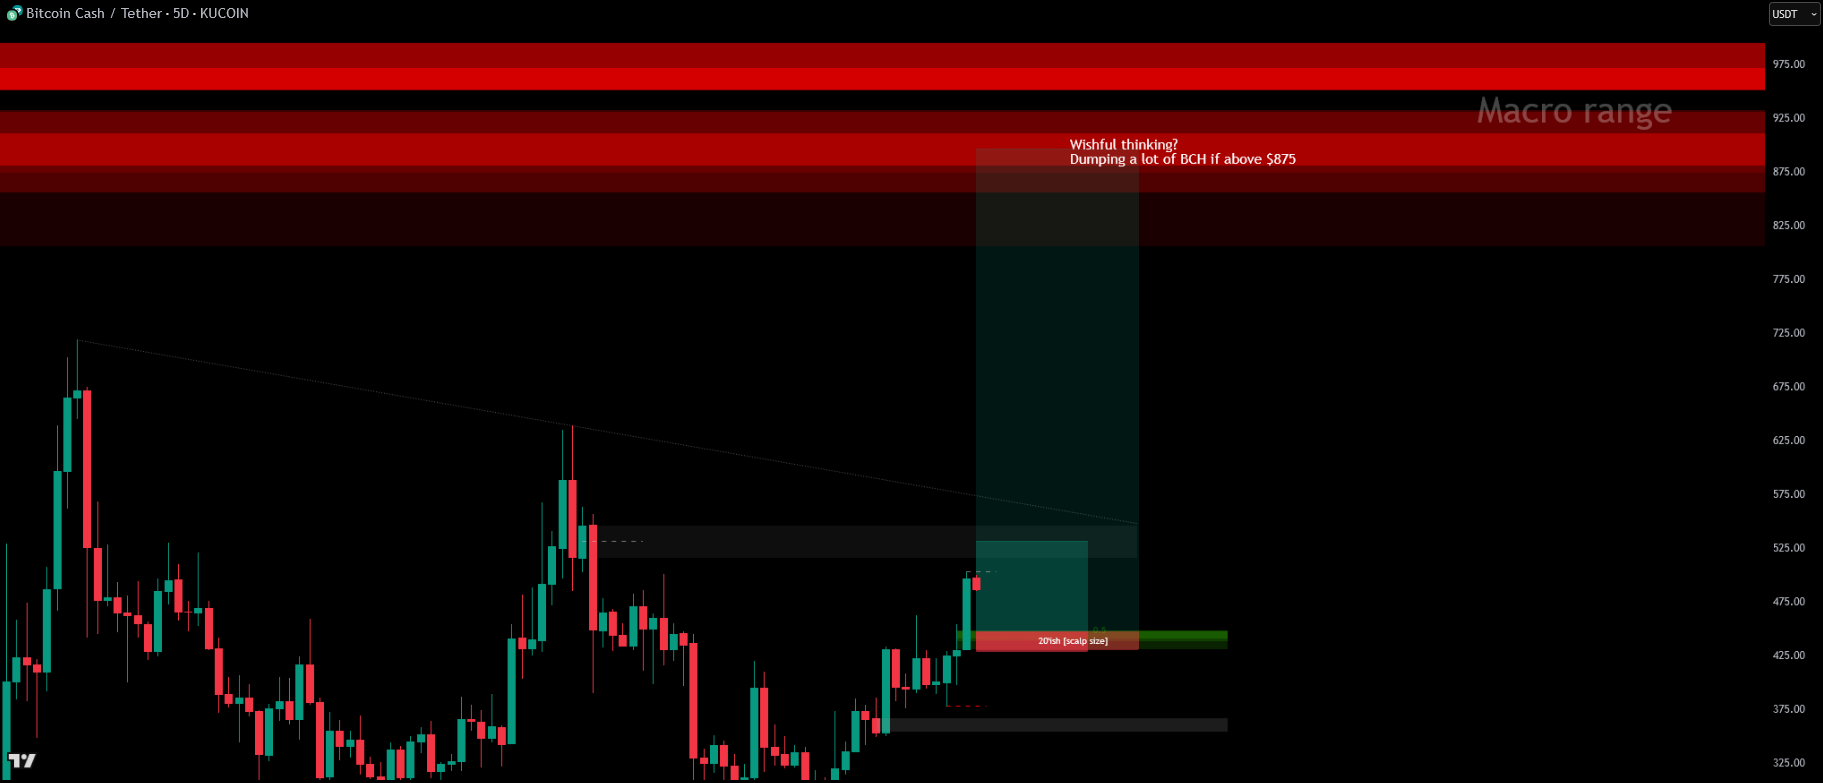
Whales don't have wishful thinking; they play the game strategically within a range. Anything above/below the range is a bonus.
Field Notes: Reading Ranges Live
A few applied principles that come up over and over.
If you sell a project that drops below HTF low and you're wondering when to reconsider buying — let ranges form, and/or wait for price to come back inside the HTF range. Too much risk otherwise as there's no PA to tell where it can reverse. If an idea fails, ditch it and move on. You pay back a few % and make hundreds of % on other opportunities. Math does math if you play it right. It's a take-give game. You win if you take more than you give.
The simple bullish/bearish bias around a range:
- Go below range, expecting blood.
- Go above range, expecting new ATH.
Not just "go" — HTF body close above, rather than just wicks. See RANGES Tips for the full collection.
When Bitcoin sits in sideways boring momentum, it's ranging — engineering liquidity before a strong move. Price stays accumulating liquidity where retail loses on a daily basis and MMs fill their bags in prep for the major move out of that range.
In an unstable market, always Trail Your SL's. You're better off guaranteeing some profit than seeing MMs print scam wicks that close you on B/E (or liquidate your position if you're an extremely dumb trader).
Extreme Premium = HTF Supply. Extreme Discount = HTF Demand. Plus a ton of 🎁 setups in between:
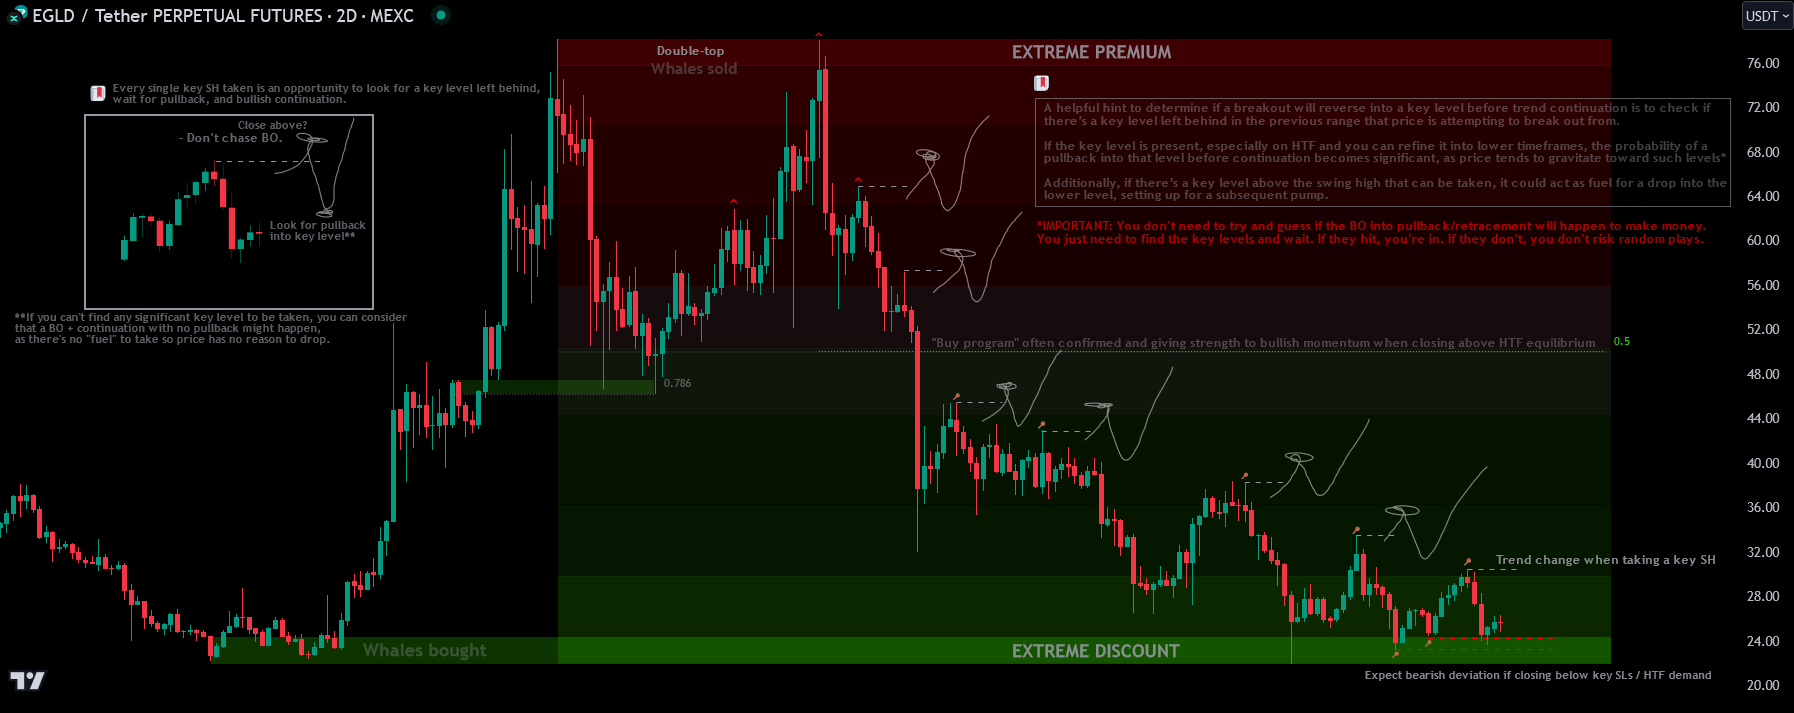
A "buy program" is often confirmed and gives strength to bullish momentum when closing above HTF Equilibrium. Expect bearish deviation if closing below key SLs / HTF demand. See Buy & Sell Programs for the full framework.
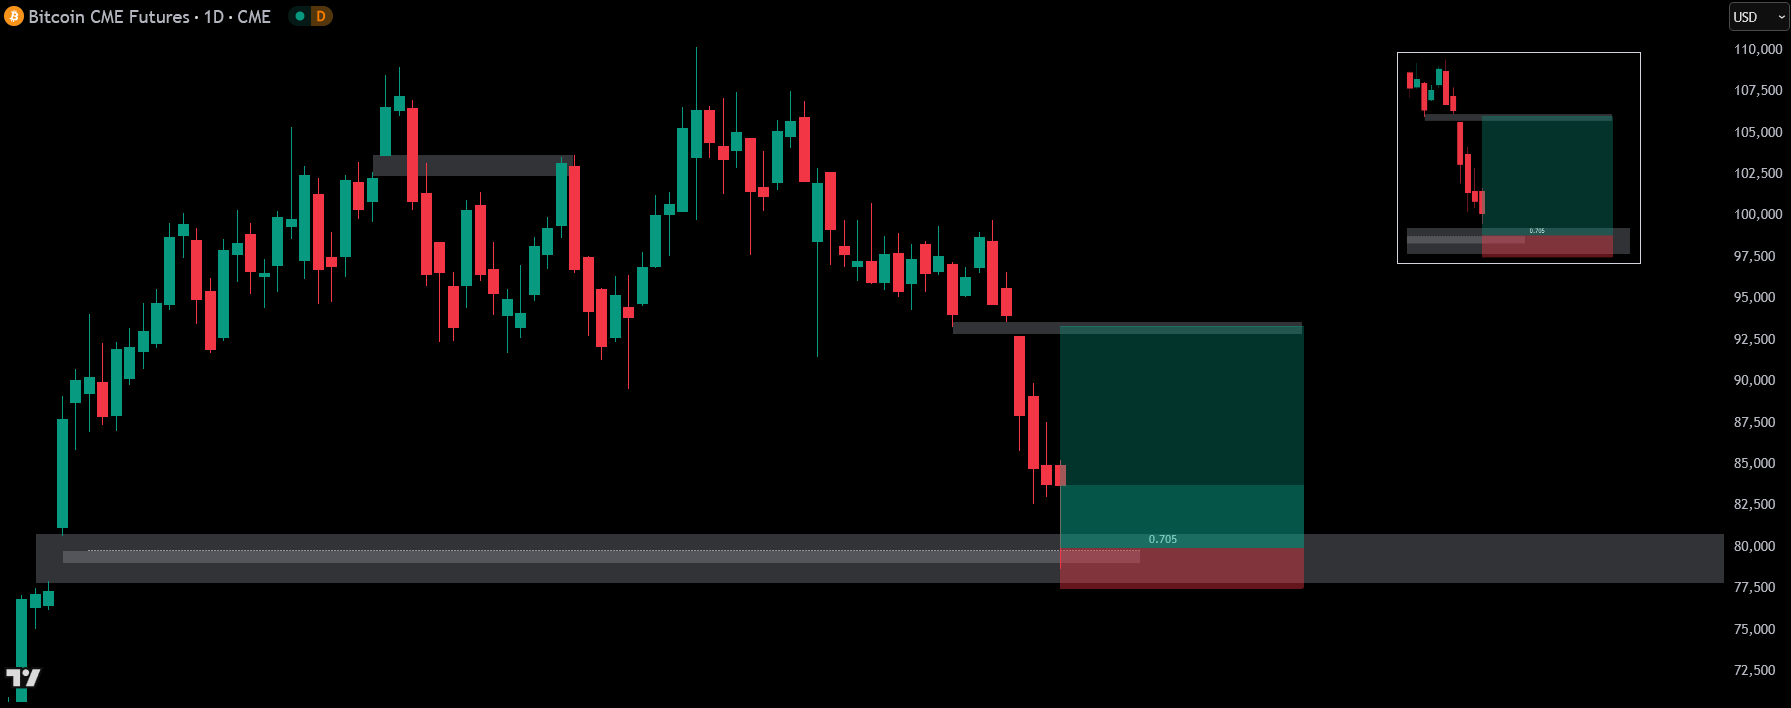
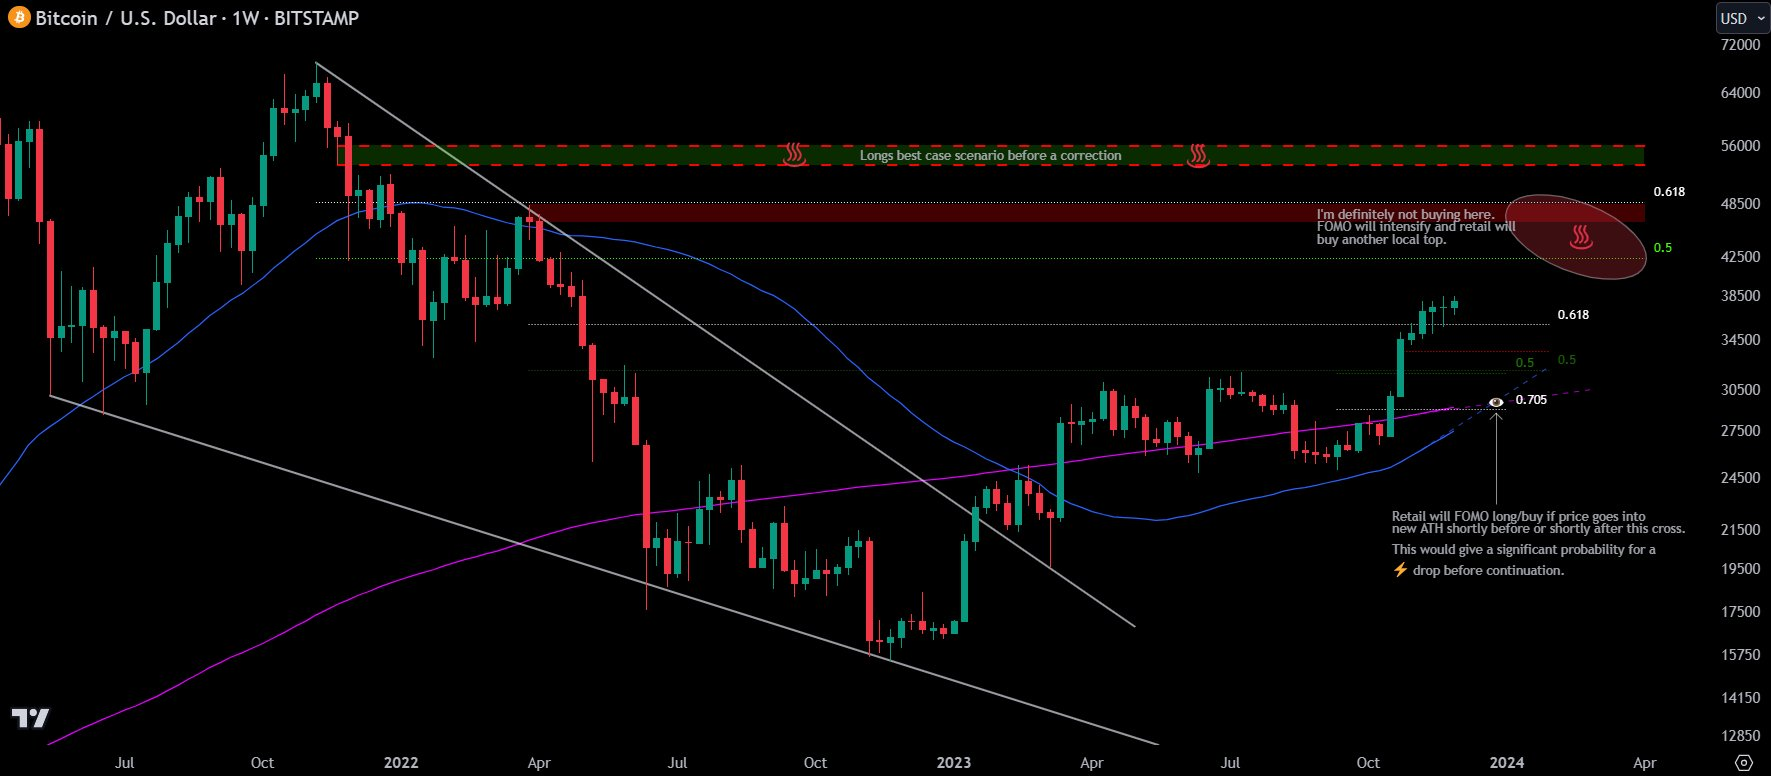
Bitcoin updates with trailing stops wide from CME gap:
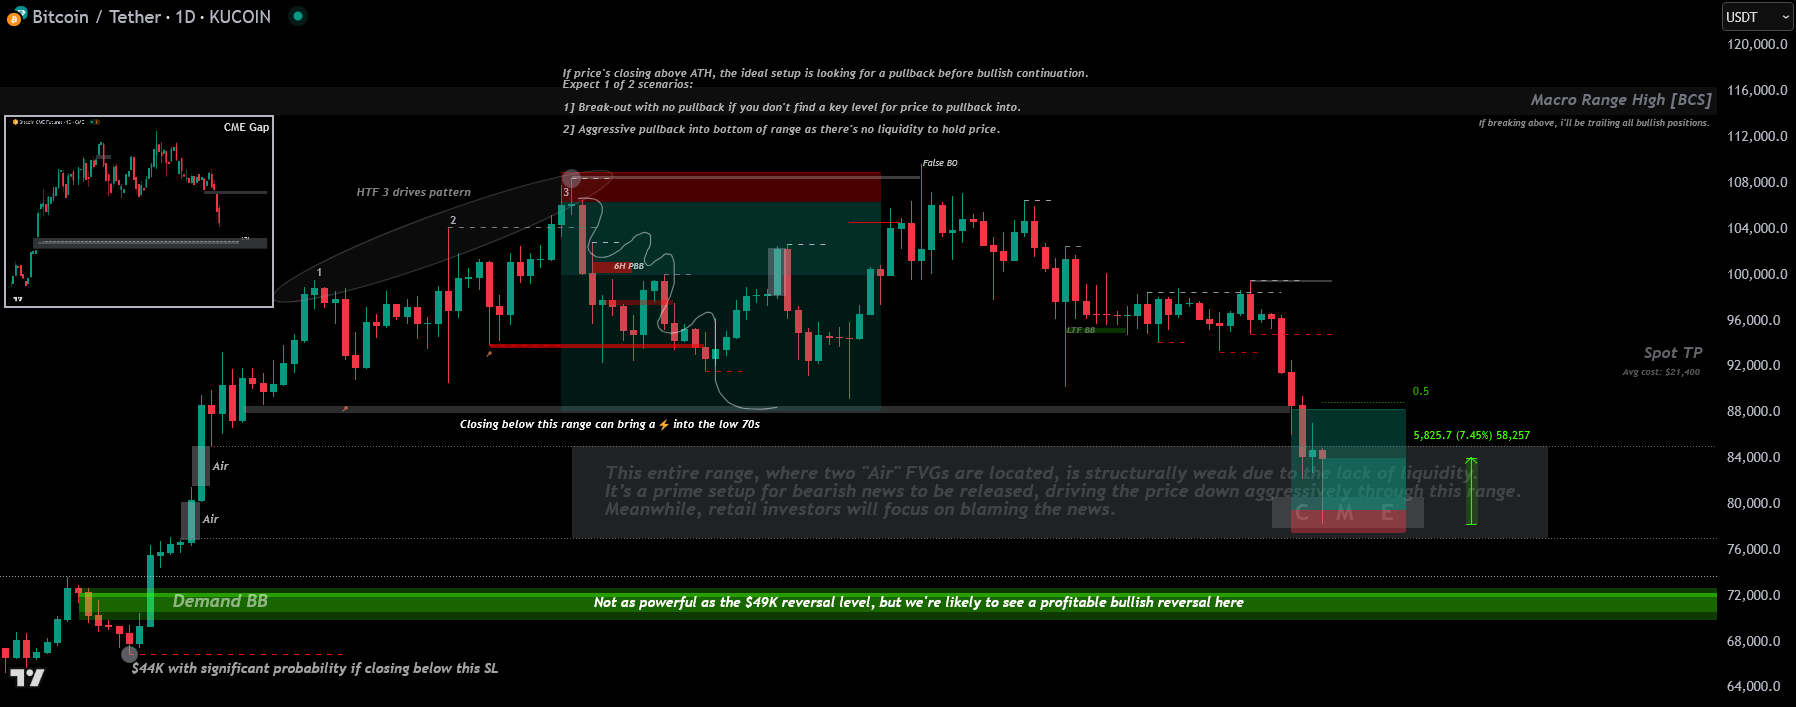
Macro range high (BCS): if breaking above, I'll be trailing all bullish positions.
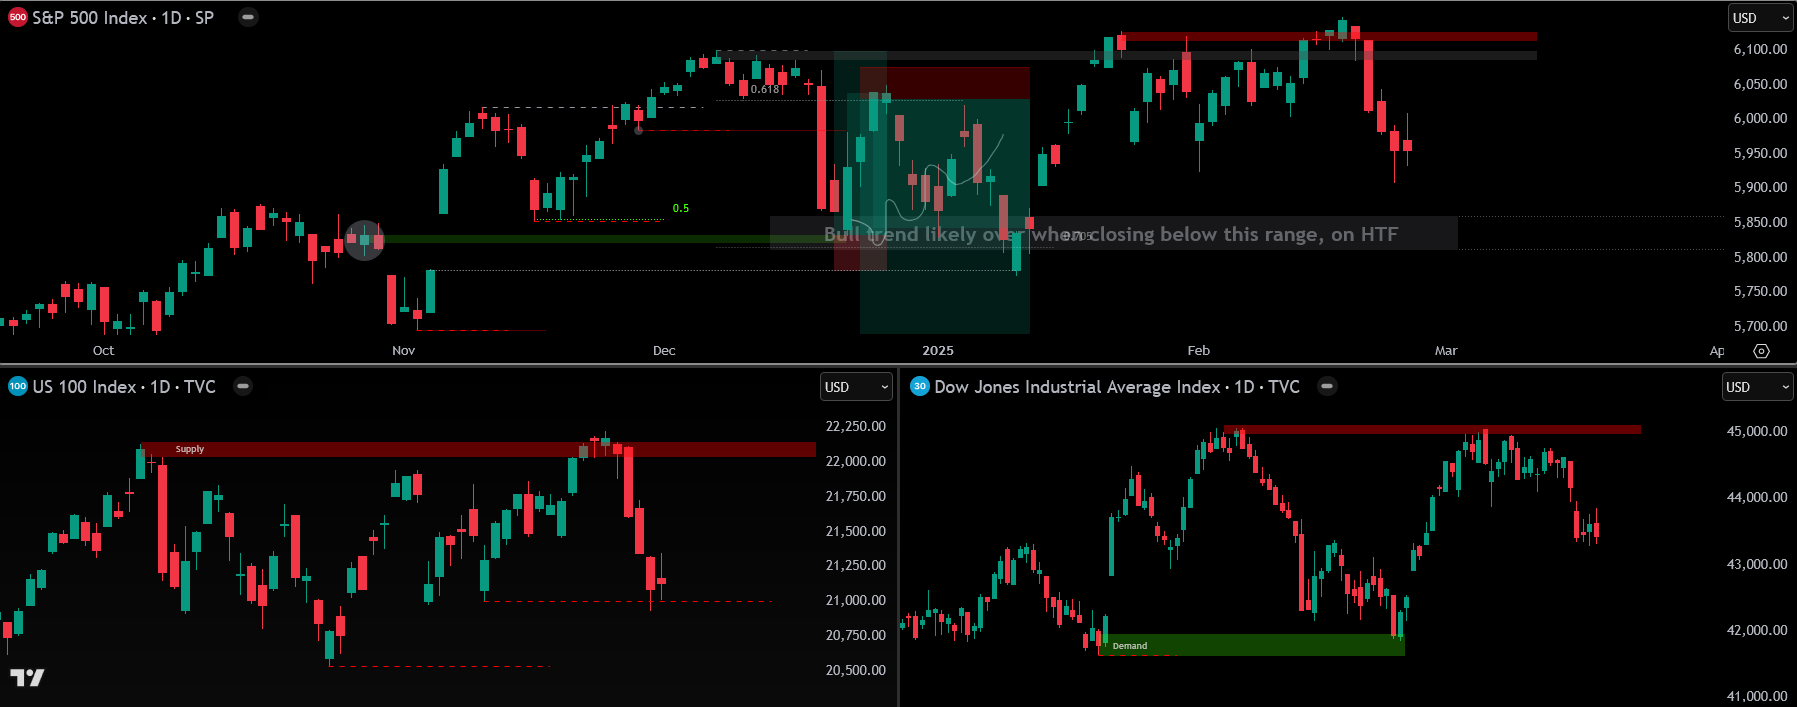
SPX, NDX, DJI — failed bullish BO shortly before tariff news. All ranging:
ETH/BTC again:
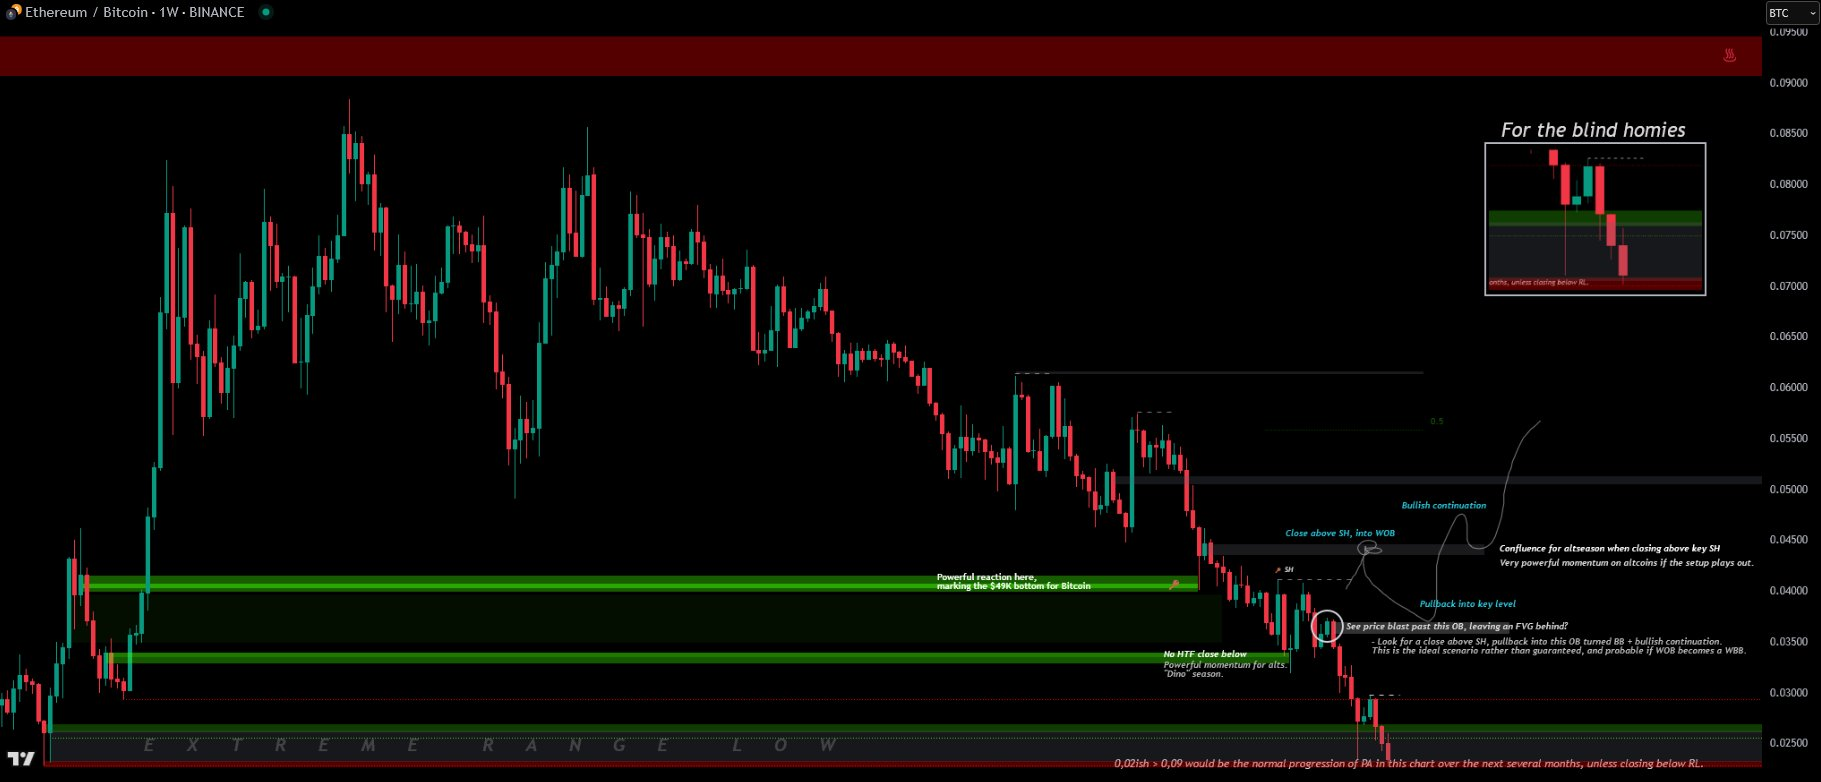
No MTF close below key level (which we did) but also the 0.02 → 0.09 progression. Aren't these two opposing each other?
The February 13th post had it written, because it didn't. As of today, it did. Only reason for concern on this chart is if closing below RL.
Range high decision tree:
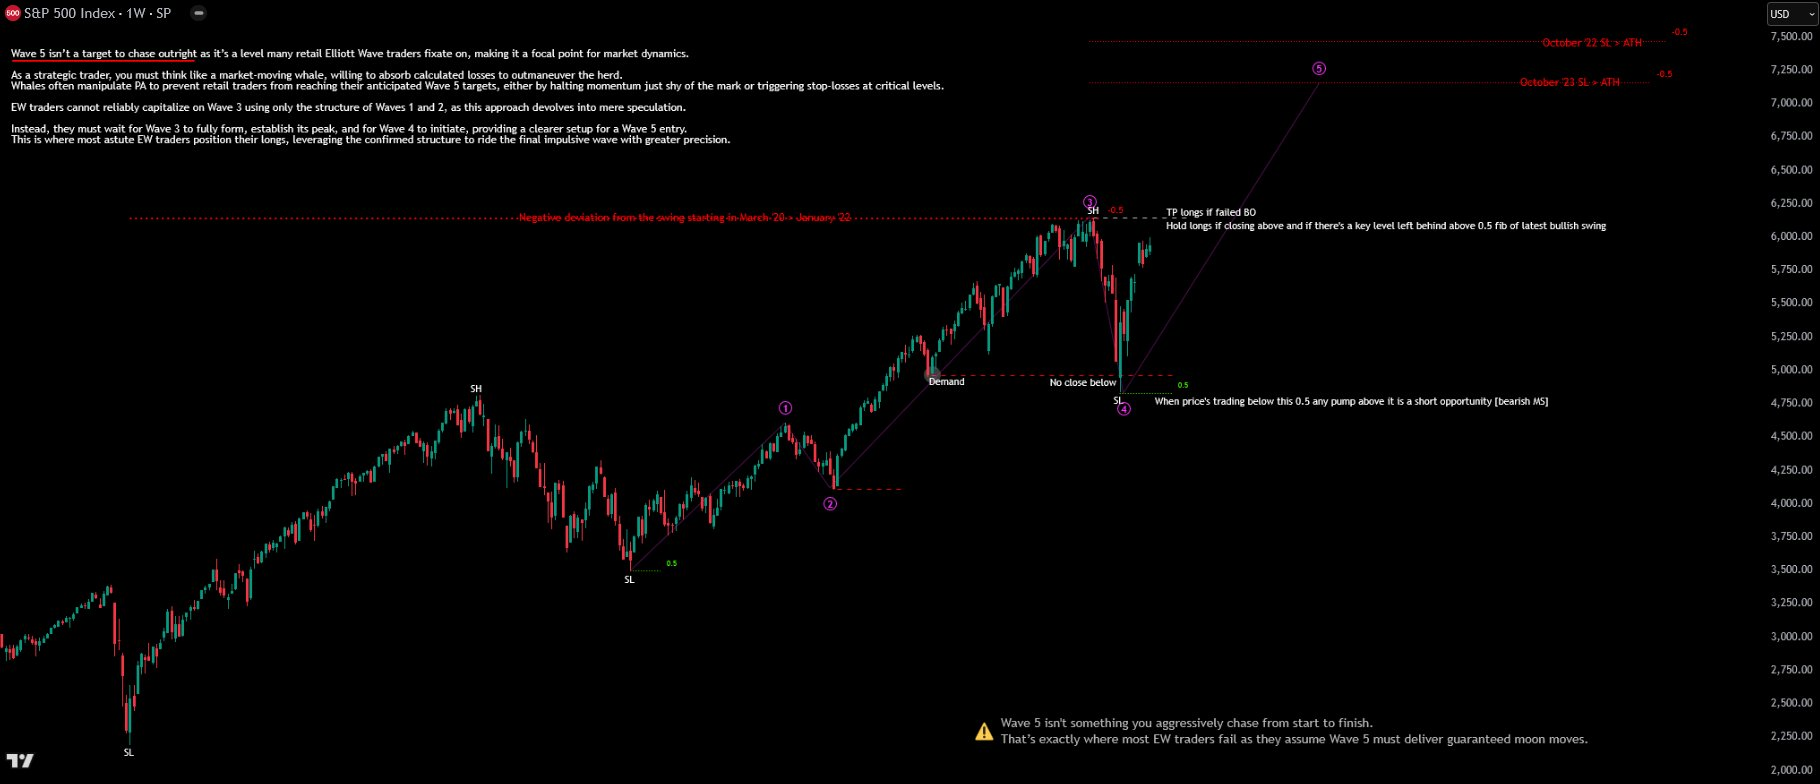
- TP longs if failed BO (False Breakout). Hold longs if closing above and if there's a key level left behind above the 0.5 of the latest bullish swing.
- When price's trading below this 0.5, any pump above it is a short opportunity (bearish MS).
CRV at $0.50:
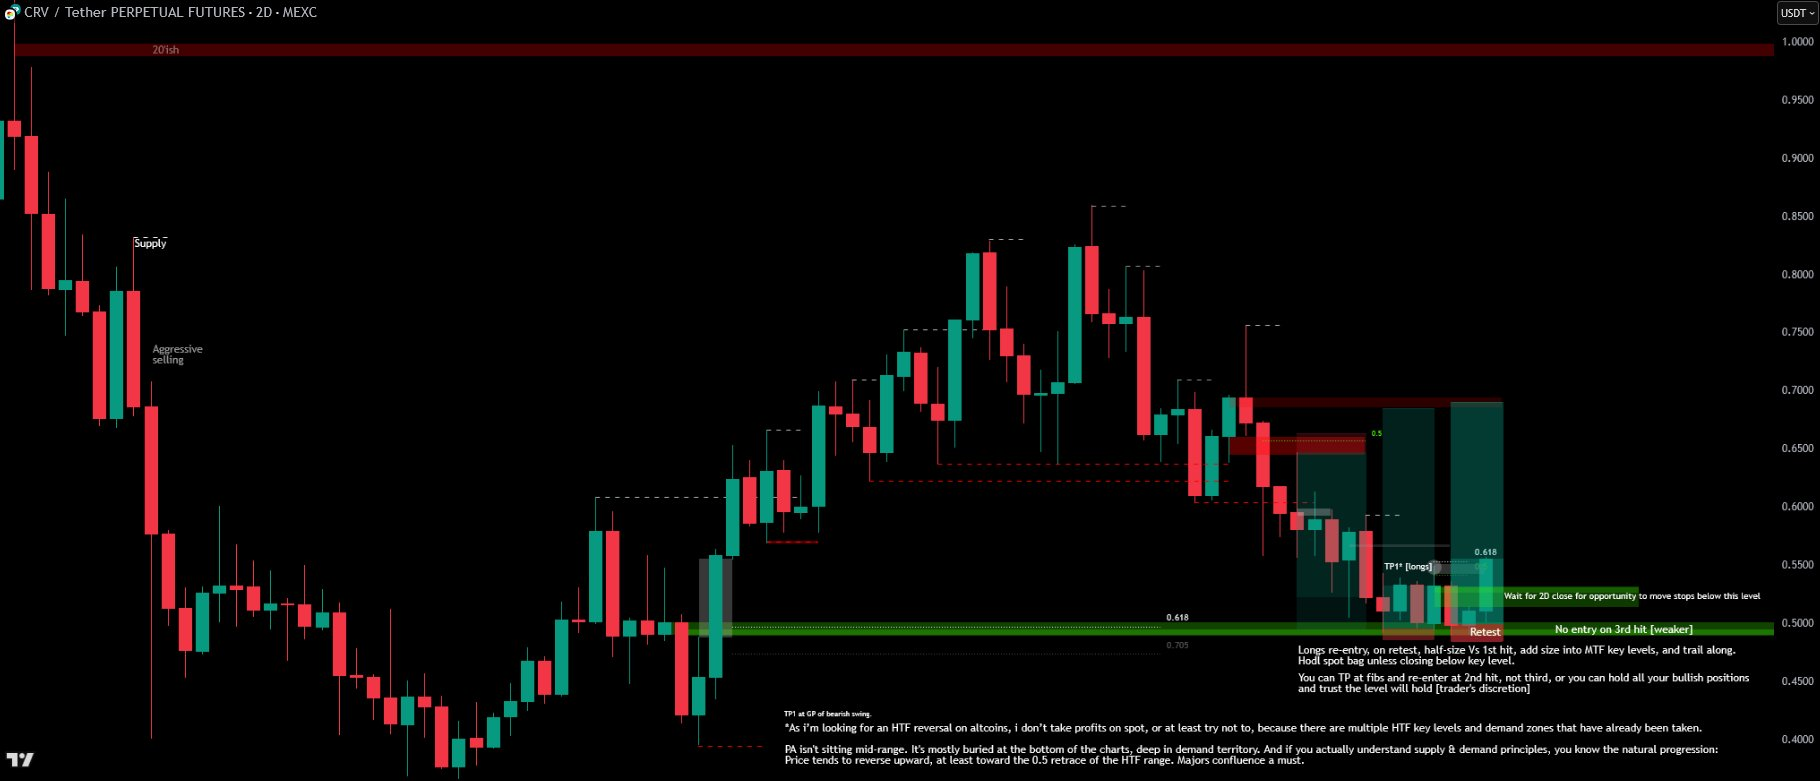
Longs re-entry on retest, half-size vs first hit, add size into MTF key levels, and trail along. Hodl spot bag unless closing below key level. You can TP at fibs and re-enter at second hit (not third), or hold all bullish positions and trust the level will hold — trader's discretion.
When looking for an HTF reversal on altcoins, I don't take profits on spot, or at least try not to, because there are multiple HTF key levels and demand zones that have already been taken. PA isn't sitting mid-range. It's mostly buried at the bottom of the charts, deep in demand territory. And if you actually understand 🎁Supply & Demand principles, you know the natural progression: price tends to reverse upward, at least toward the 0.5 retrace of the HTF range. Majors confluence is a must.
Bitcoin monthly — IYKYK:
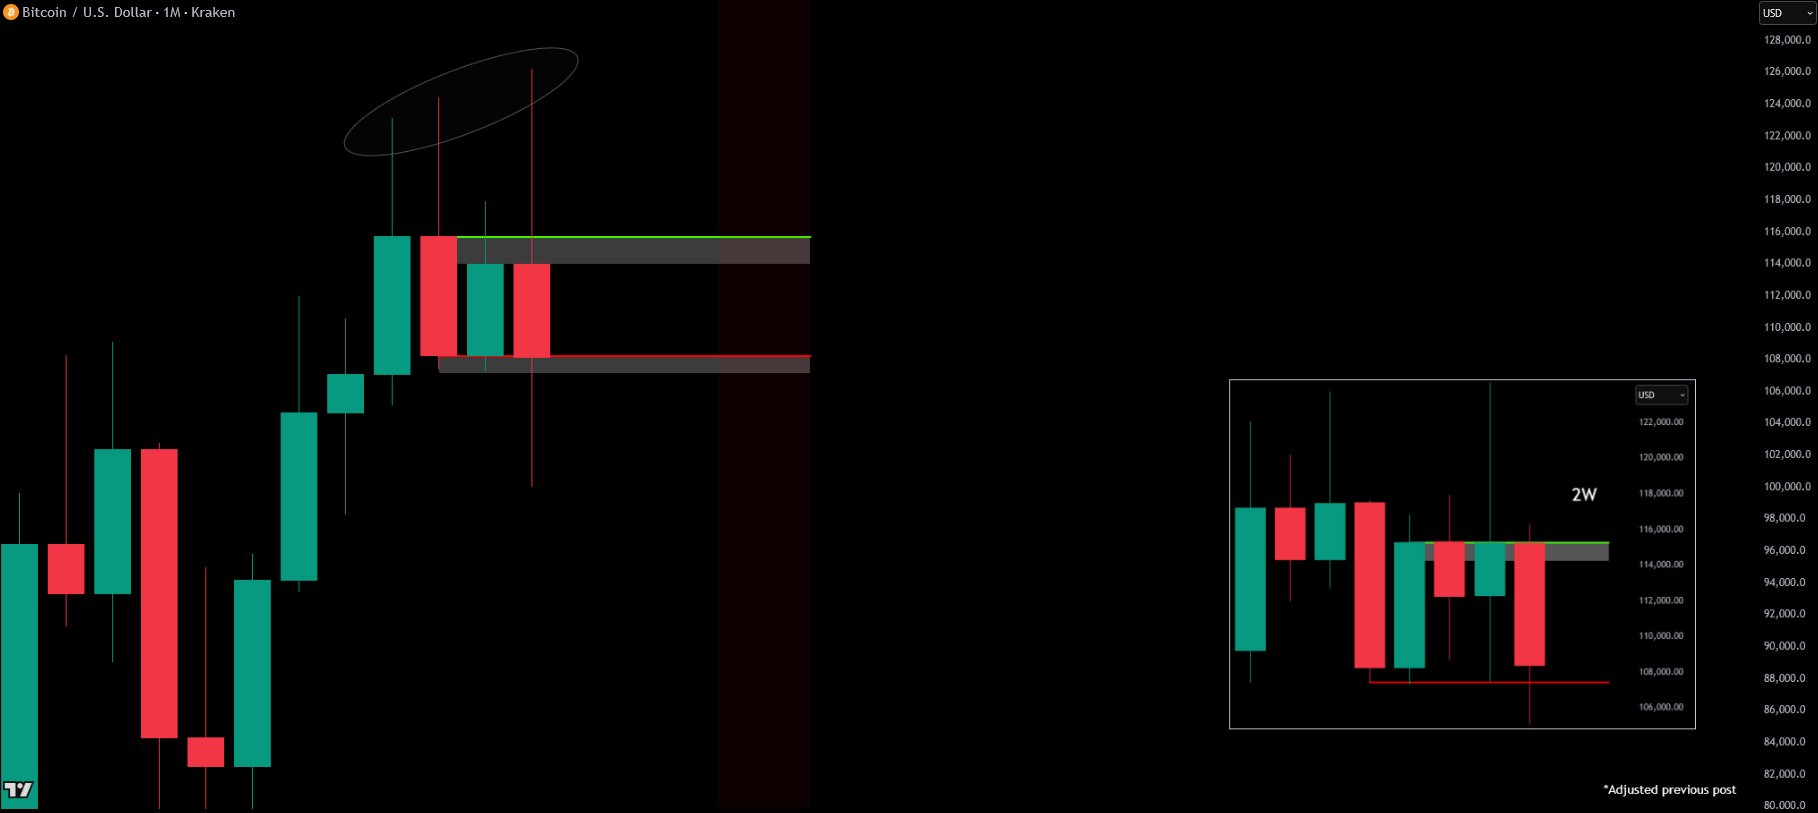
BTC ranging, possibly distribution. Wait for BO for clarity.
Trend Strength: Reading the Move Out of the Range
Once price leaves a range and starts trending, you need a way to gauge how strong that trend actually is. This is where Trend Strength comes in.
"The Trend Is Your Friend Until The End"
You've heard this in trading or investing. It's famous because it's true: it doesn't matter what asset you're holding or how many developments are being delivered, the price of that asset will continue to rise or fall until the overall trend shifts.
There's a reason why an asset is tradable: it's in a financial market, populated by buyers and sellers. From Market Structure (Intro):
- Bullish trend: a series of HH + HL.
- Bearish trend: a series of LH + LL.
The classic "zig-zag" structures gain more relevance and strength when projected on higher timeframes (daily/weekly/monthly). That's the base for everything that follows.
Trendlines (and Their Real Use)
You've identified a trend graphically — now you want more confirmation. One way is to draw a trendline.
Just be honest about what trendlines are: they're Retail TA Patterns. I don't like them, but I use them to predict what retail is thinking.
If you're going to draw one:
- The wicks of the price (not the candle bodies) should touch the trendline at least 2 but better 3 times to validate it.
- 3 touches make the trendline stronger.
- From the 1st touch to the 3rd touch, if the trendline is correct, you should be able to draw two dotted lines forming an acute angle of around 90 degrees.
- Volume plays a significant role — a decent amount of volume strengthens the trendline.
Quick advice: you can use trendlines for momentum breaks.
Identifying Strength: Impulses vs Retracements
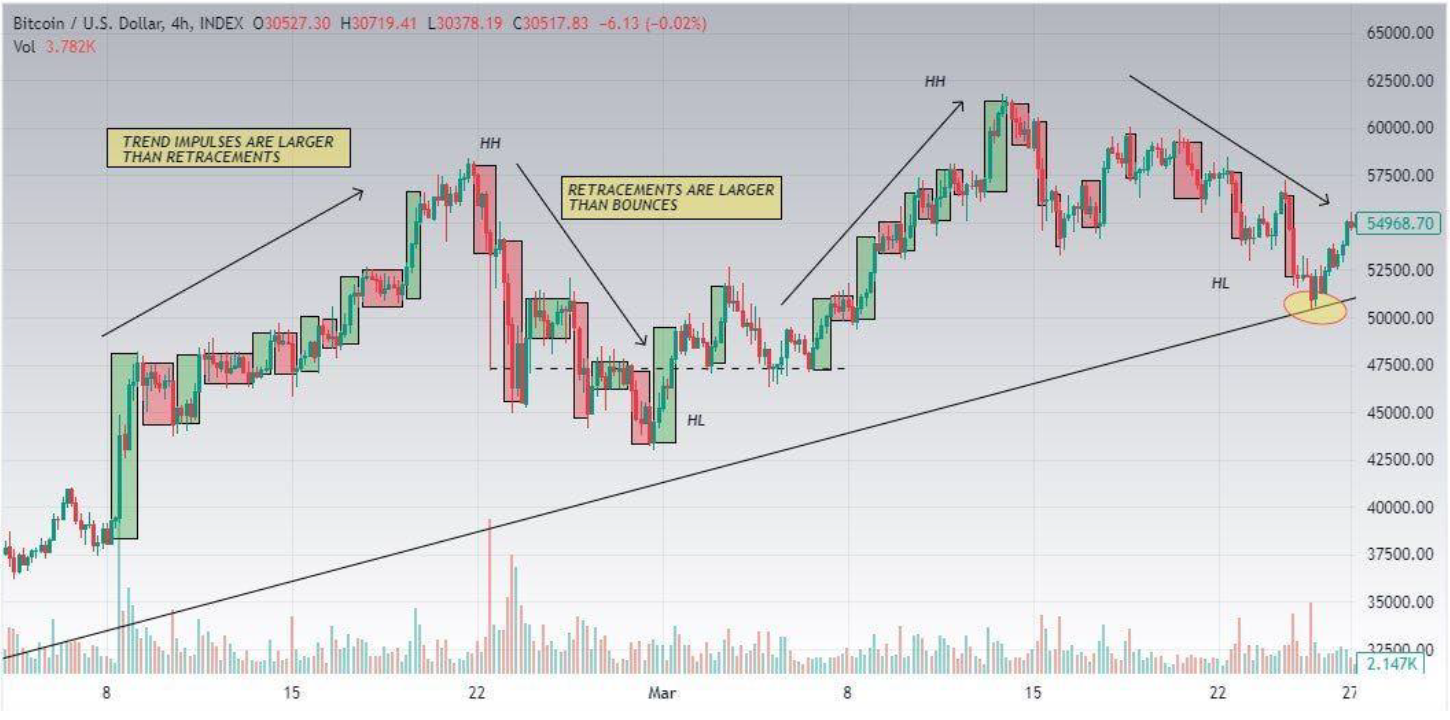
During a bullish trend, the impulses are larger than the retracements — buying pressure is heavy. I draw green squares around the bullish moves so I don't lose focus on the predominant trend, and so I can recognize when green candles start to lose strength. The more the price rises, the more the candles become thinner. The number of buyers is reducing.
During a bearish trend, the opposite occurs. Retracements become larger than bounces. Red candles become heavier. Red squares help visualize. The more the price dumps, the more red candles become thinner — sellers are reducing. At some point, the structure reverses.
Even when price prints a downtrend, if it never falls below the trendline, the macro uptrend is confirmed. This is why it's important to use the trendline and always watch the HTF. Each asset is subject to the structure law — never make the mistake of thinking it'll just go up because of fundamentals. There are buyers and there are sellers.
Dominance
The ideas of Dominance & Momentum turn around classic market structure. In any market, independently of trend direction, the chart is the coexistence of buyers and sellers. Each high or each low can help us pinpoint where they entered.
Key note: while wicks are important (liquidity grabs), we watch the bodies of the candles to gauge relative strength — HTF closures above/below.
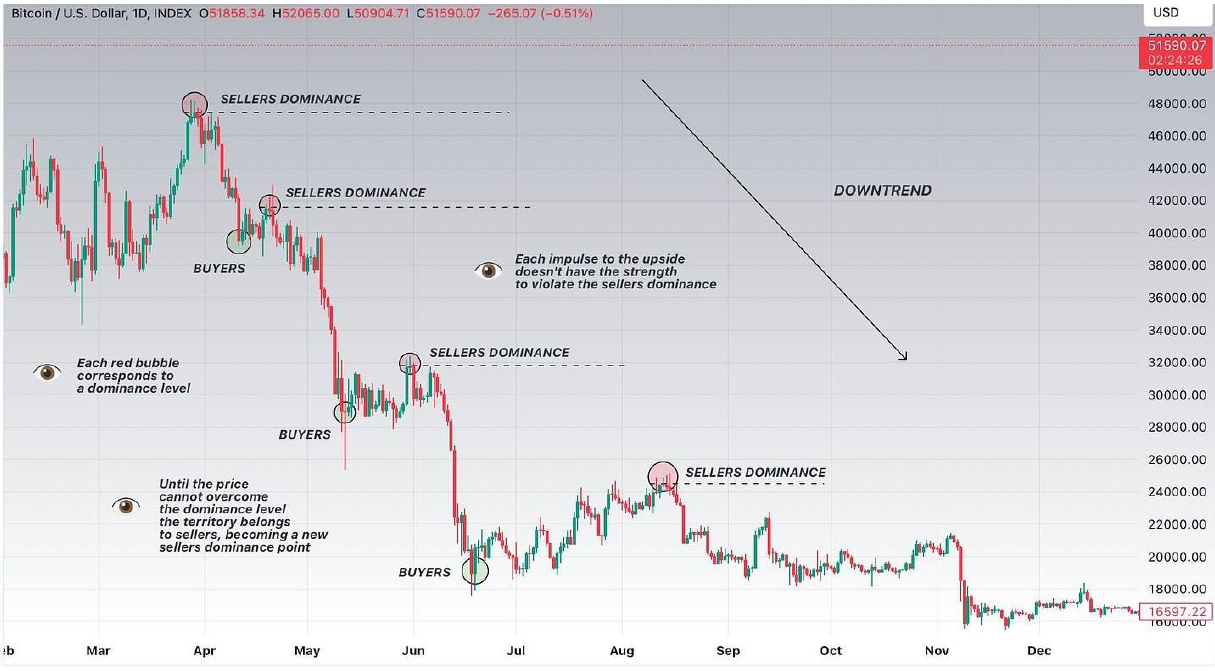
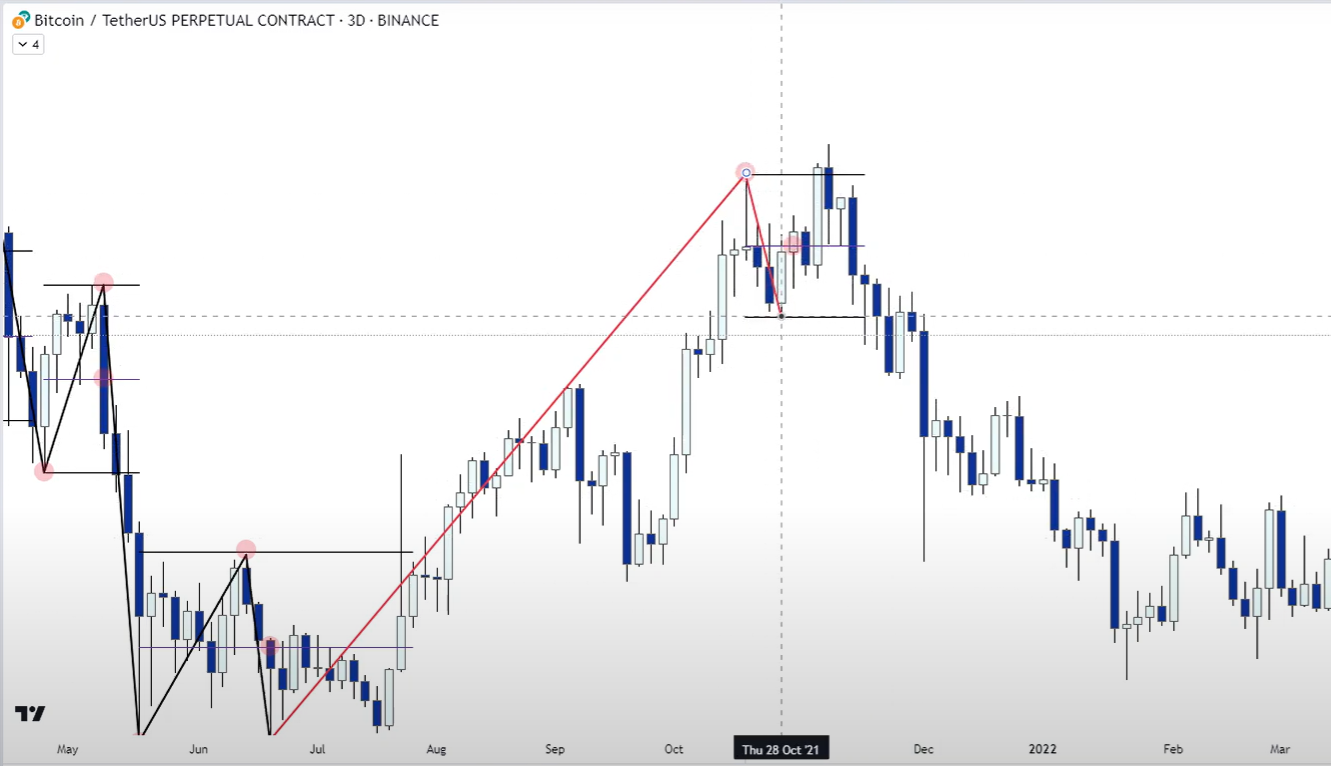
This chart shows a clear Bitcoin downtrend with multiple lower highs and lower lows. The directional bearish impulse starts from each high (red bubble), flashing more supply than demand and pushing price down. At some point buyers enter (green bubble) but cannot overcome the past sellers' dominance zone — notice the lower highs — becoming a new level where sellers push price down again, transforming into a new sellers' dominance zone.
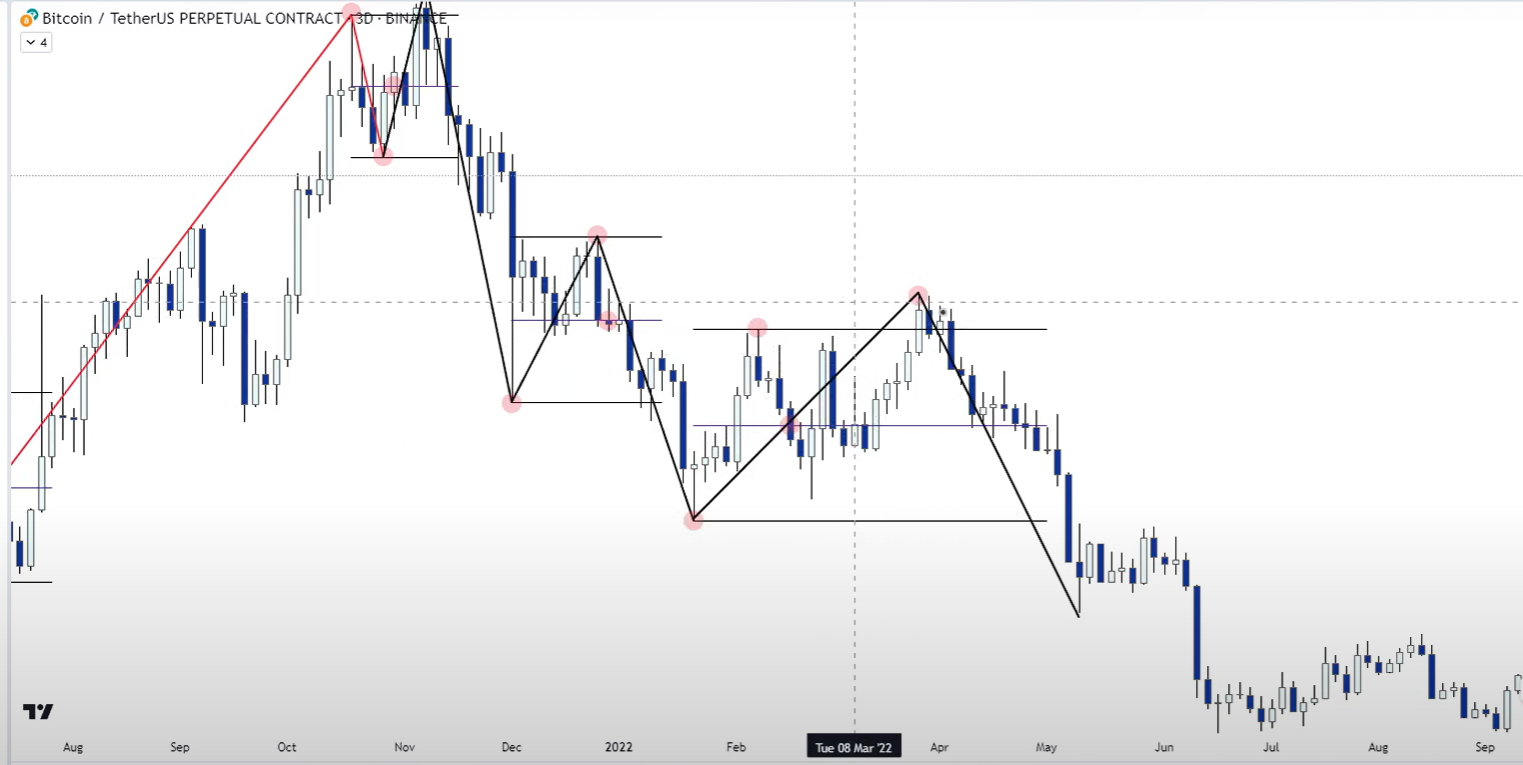
In the next chart, price violates the sellers' dominance area — that's the first sign that the tides are turning and buyers are starting to push to reverse:
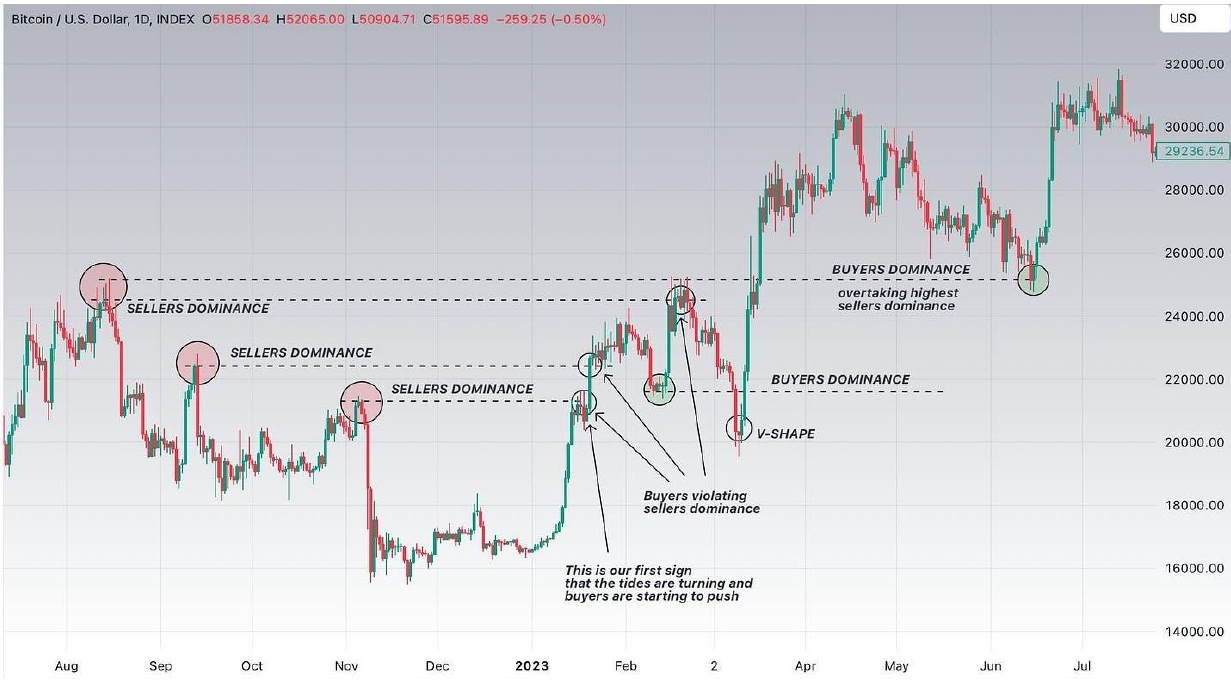
With developments in the price action, buyers establish new dominance levels. This is dominance in trading: a way to decide if it's worth selling or buying.
Momentum
"But how can I have a stronger signal of buying or selling strength?"
With the use of momentum.
Momentum is the speed at which price reaches the sellers' or buyers' dominance:
- The less time it takes, the stronger the momentum for that side.
- The more time it takes, the weaker the momentum for that side.
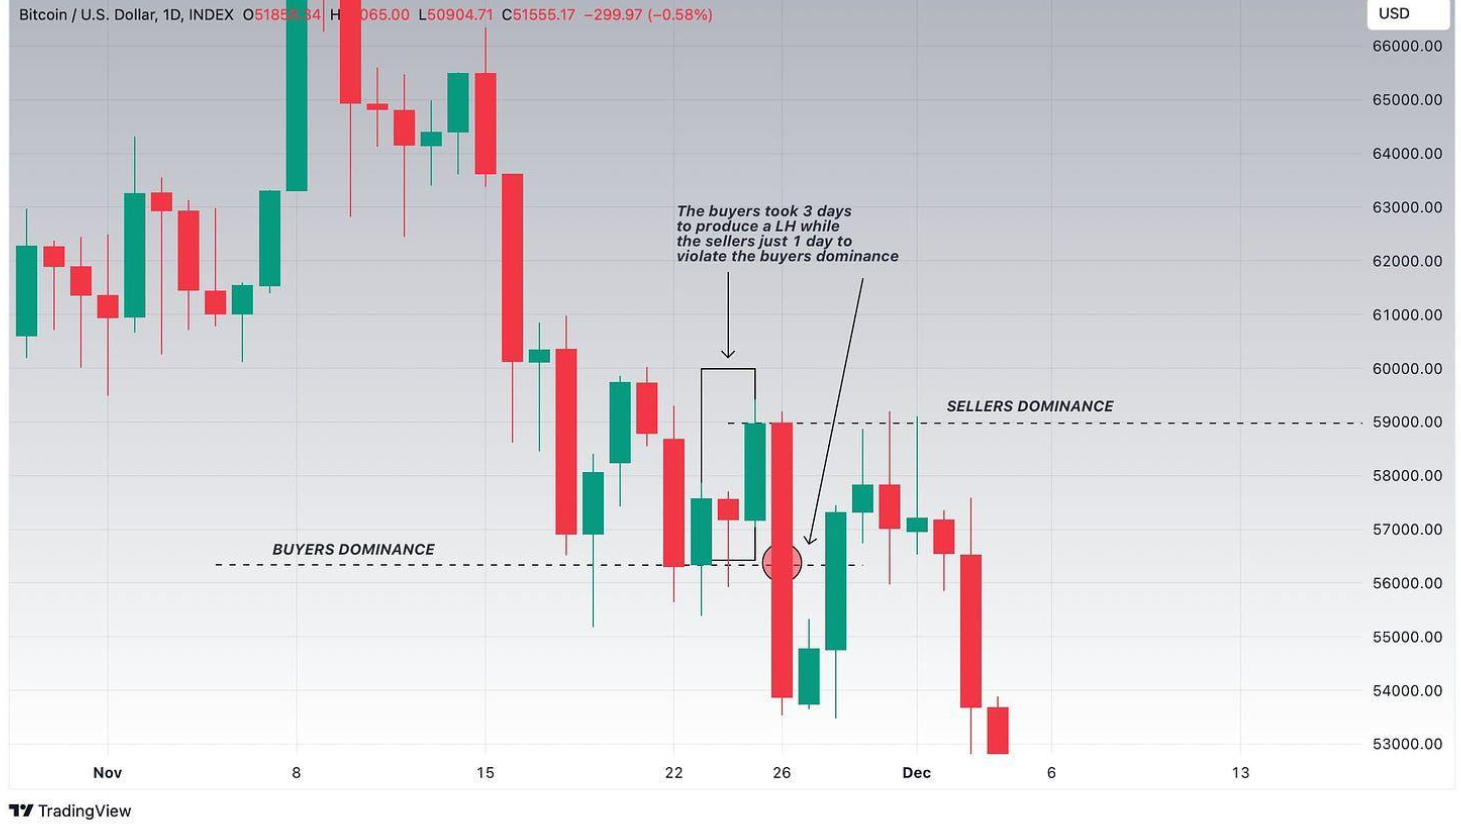
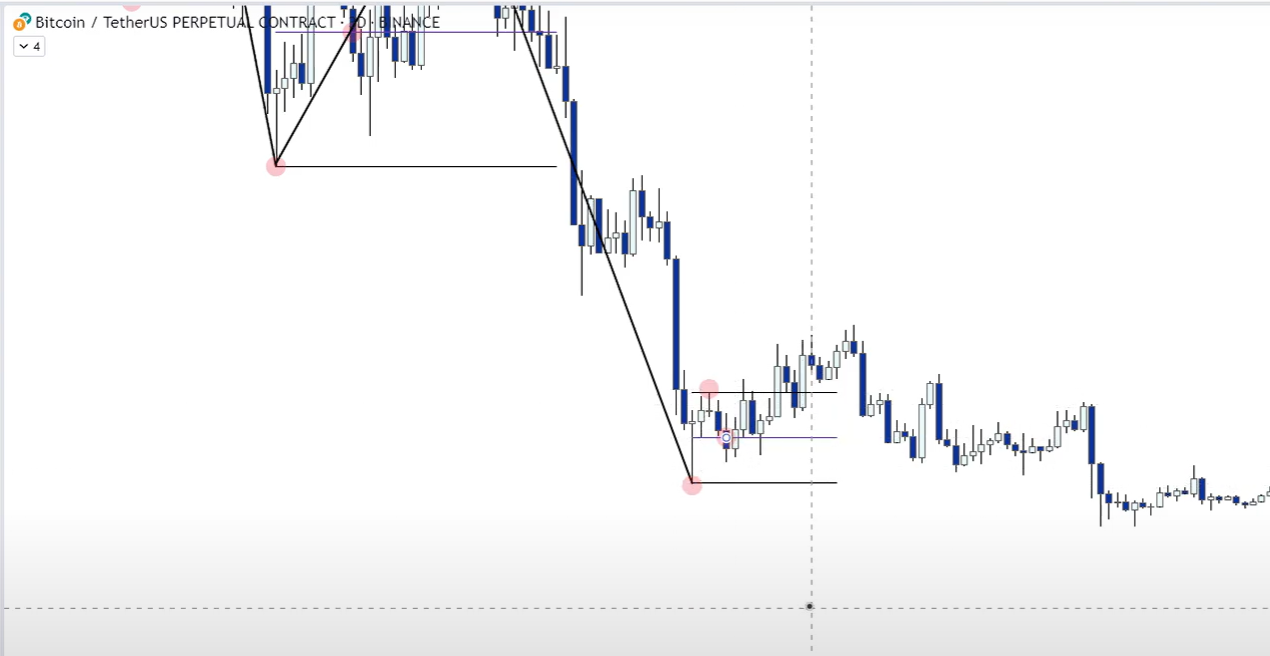
In this example, buyers took 3 days to push price higher (without violating sellers' dominance), while sellers took just 1 day to violate buyers' dominance. Sellers were in momentum and in complete control — a clear sign to stay away or consider a short.
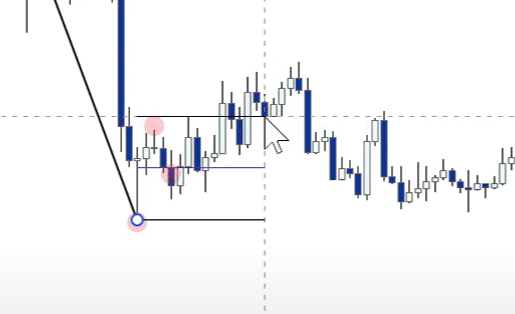
The opposite case:
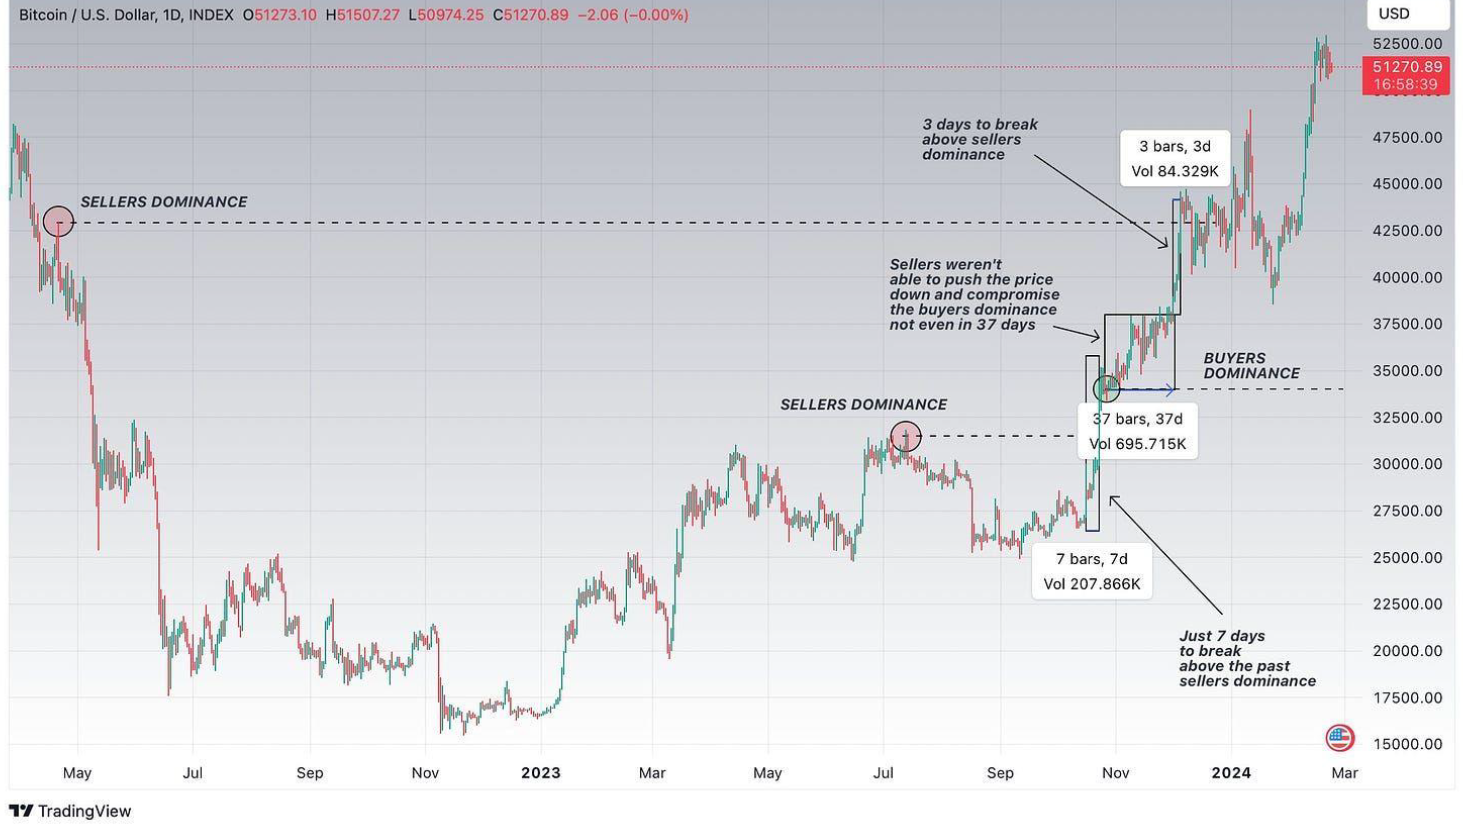
Buyers broke above past sellers' dominance areas quickly. Sellers couldn't push price below buyers' dominance even in 37 days — a clear sign of lost momentum and full control of buyers.
Dominance and momentum are simple to master, but together with a solid analysis they make a huge impact on operativity. Deciphering the main force in control of the market helps you protect capital or risk more depending on current conditions. The rule: the higher the timeframe, the stronger the signal. 👑Timeframe Rules. Always watch D/W/M for reliability.
Trend Continuation and Reversal
If there's no key levels to pull back/retrace to, the probability for Continuation with no Reversal is higher.
Semi-optimal means daily close above 21 ATH instead of weekly close?
The higher the TF, the more powerful it is. Ideally with an MTF or HTF key level left behind (not lower than 0.5 fib of latest swing) to find a Trend continuation entry on.
Confirmed change of trend from bullish to bearish happens when it breaks below previous swing lows. See Trading Examples📈/WLD for the case study.
FLOKI short example:
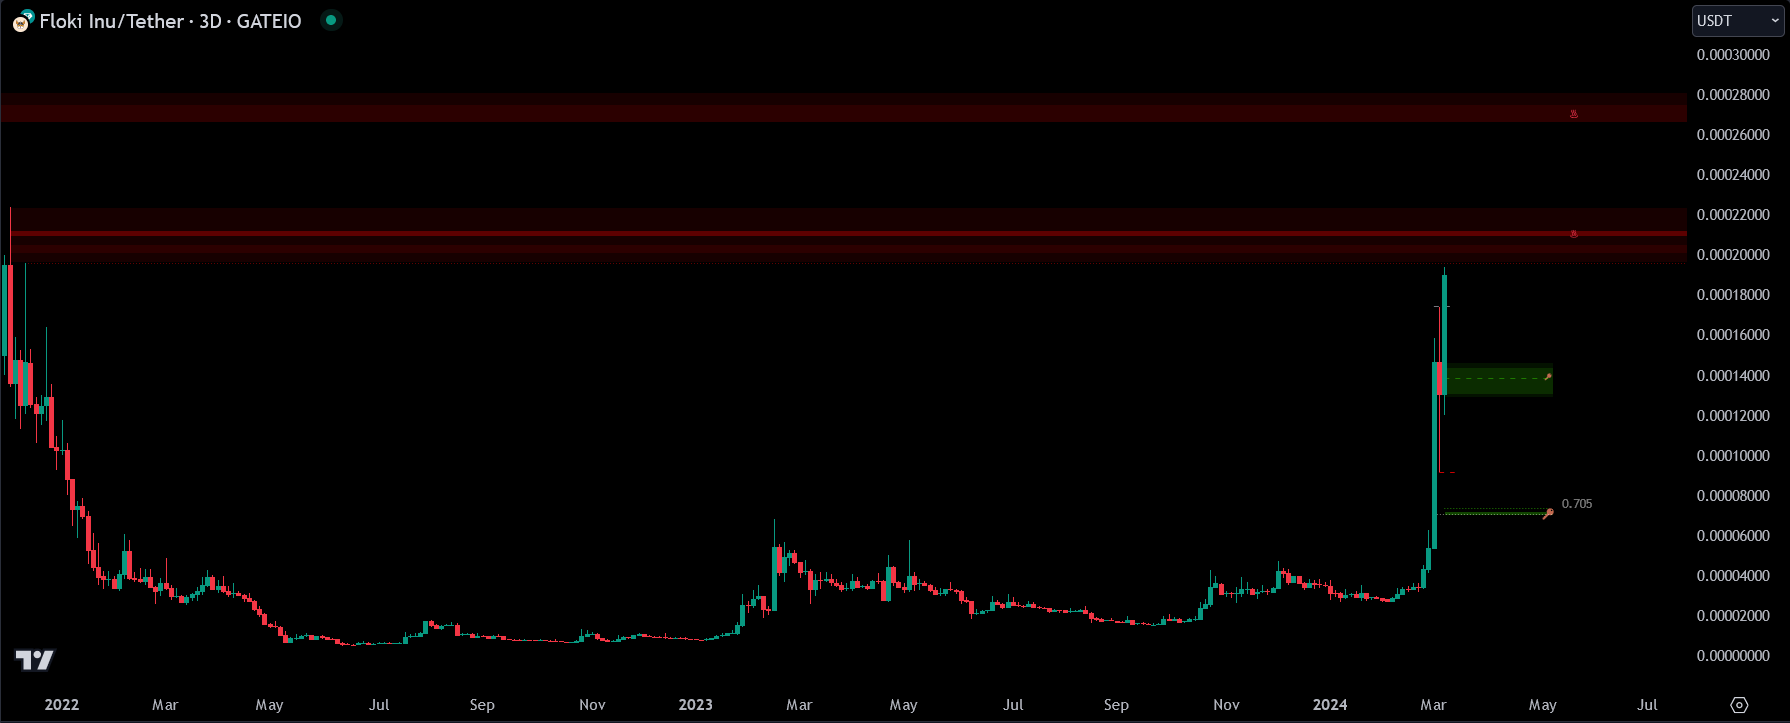
How did you manage this short? You knew it would fall but waited at first for a liquidation wick?
It began touching 🔑, but if you see my chart, it had another one a bit higher — so it was between keys, and none of them was heavy, so size is lower vs an HTF key level. Micro TF aggressive moves are often a signal of trend change on LTFs, that can then change on to MTFs (not yet on FLOKI), and then to HTFs — and you just trail along. Worst case, you're stopped on profit, but aggressive bullish moves like FLOKI's usually end on wicks.
Some coins you've bought recently hit your stop-loss entry already. Would you wait to re-enter?
Those key levels are ignored during sell program, thus always high-risk and plan for short-term profits. They hit into perfect reversals during buy program. When I see a change of trend, I find HTF ♨️Key Levels🗝️, buy, and trail along — Trail Your SL.
A real example: Orai hit its target perfectly. Rose didn't, and "2024" became an HTF bearish reversal level for a future run. The profitable play was the long from the lows, which paid handsomely. That's where your focus should be — trailing along with the trend until it shifts, rather than obsessing over exact targets. We don't decide; the market does. If targets aren't met before macro forecasts come in, exit regardless and take whatever profit the market has given. Staying in just for the sake of hitting an exact (often unrealistic) number is how people turn wins into regrets.
Momentum in Practice
A note to self that captures the discipline: treat longs as scalps/LTF in HTF sell program unless optimal. Meanwhile, give shorts room to run, and consider re-entering if stopped out, if the majors still look fine.
Remember momentum. Play against your feeling sometimes. If you feel it's run too much, it will probably keep running.
One of most retail investors' biggest mistakes — see 🚨The Worst Mistakes — is following each other on the consensus of "it's gone up a lot, I better wait for retrace." They forget momentum.
Going down a lot doesn't mean it can't go down further. Same when it's gone up a lot.
⚠️ Never Chase. If you find an entry but you can't find clear liquidity levels for profit-taking inside the MTF/HTF range, avoid it — or momentum-trade with a trailing stop loss.
⚔️Execution: Hidden order blocks on MTFs of high-trading-volume coins work well for short-term trading. But when a coin is on aggressive momentum, focus on HTFs rather than smaller OBs on lower timeframes. Your attention will be on weaker opportunities, and you'll miss out on powerful and very profitable reversals.
Bull Momentum
Different market dynamics require different strategies. Inexperienced traders are left eating dust.
Do you follow the same strategy of BB through FVG / HOBs for continuation plays in trending markets, just on LTF/MTF?
Momentum trading, fibs, 🎁Supply & Demand, ♨️Key Levels🗝️ on major charts, and MTF BBs are often enough during buy program. HTF BBs will eventually hit.
With HTF bull momentum on the whole market, any shorts should be treated as LTF or scalp plays — once you get the reaction, move your SL to BE.
I find that levels aren't being hit. Thought I had lost the skills, but realized that I simply have to adapt. It's too bullish. I've been going on the 1m, 3m, 5m TFs and the movements there are crazy — 1%, 5%, 8% in minutes.
Play the Game🎮. You lack the experience to know how to adapt when momentum shifts. Maybe you're trying to fade the bullish move where bearish key levels will more often than not turn into bullish key levels behind FVGs.
I'm also not playing this right, never traded such an environment.
Lost count of how many bullish signals I shared for that quarter. Spot bags pumping hard. Mistakes: taking profits too quickly, not trailing, not partial-TP, expecting a final drop after a news-driven pump then continuation.
Higher TF Bullish Continuation
If it closes 12H+ above the previous high + pullback into liquidity or imbalance, probability is pretty high for bullish continuation. The higher the TF where the setups happen, the higher the probability to succeed — much more liquidity in play.
Bitcoin HTF update example: trend is up until proven otherwise. It had been three years since the last time we'd seen 7 green weekly candles in a row. Any pullbacks closing HTF above $33,500 are long opportunities. Just wicks are false BOS. Bears will be loud on any -10% pullback on BTC. Ignore them and pay attention to the levels.
Shorting Against Bullish Momentum
Shorting against powerful bullish momentum without a clear understanding of what to do often comes from a lack of experience and data. If you haven't lived through these conditions, you're likely unsure whether to take shorts, when, why, or how to adjust your strategy — especially as setups get invalidated.
This happens when newbie traders, accustomed to a choppy market, try to apply the same approach in a trending one. In a bullish market, many BBs will act as bullish "fuel" for more upside rather than signaling bearish reversals. Not all, but most. Instead of adapting, they chase money, thinking they can make it big shorting potential tops — driven by greed and inexperience.
There's no way to get wrecked if you respect good R:R setups. The key isn't just about making money, but learning, adapting, and preserving capital while navigating different market conditions. It's a process, not a shortcut. See 🎓Learning Process.
The BBs above are resistance — could price blast through them and those BBs act as support in bullish market conditions?
Yes, but not always. It happens more frequently during periods of higher volatility in a trending market. Certain weekly key levels can still be actionable if carefully refined, and if Bitcoin is ranging.
Examples of Weak Momentum
Several coins attempted to react bullishly at key liquidity levels but struggled to maintain momentum due to Bitcoin's ongoing decline. When this is happening, treat all long opportunities on altcoins at key levels (starting from the daily and refining down to LTFs) as scalps. Don't force trades — there won't be significant upside unless Bitcoin takes a significant key level.
Some coins reacted between 3.5% and 8% at their key levels, but momentum was weak short-term. This is where elite traders thrive — they recognize that the opportunity is limited, so they scalp the levels. See Elite Level Trading👑. The average trader is likely to lose money — they struggle to shift their bias quickly or accept that a setup should be invalidated, and they hold onto unrealistic profit expectations.
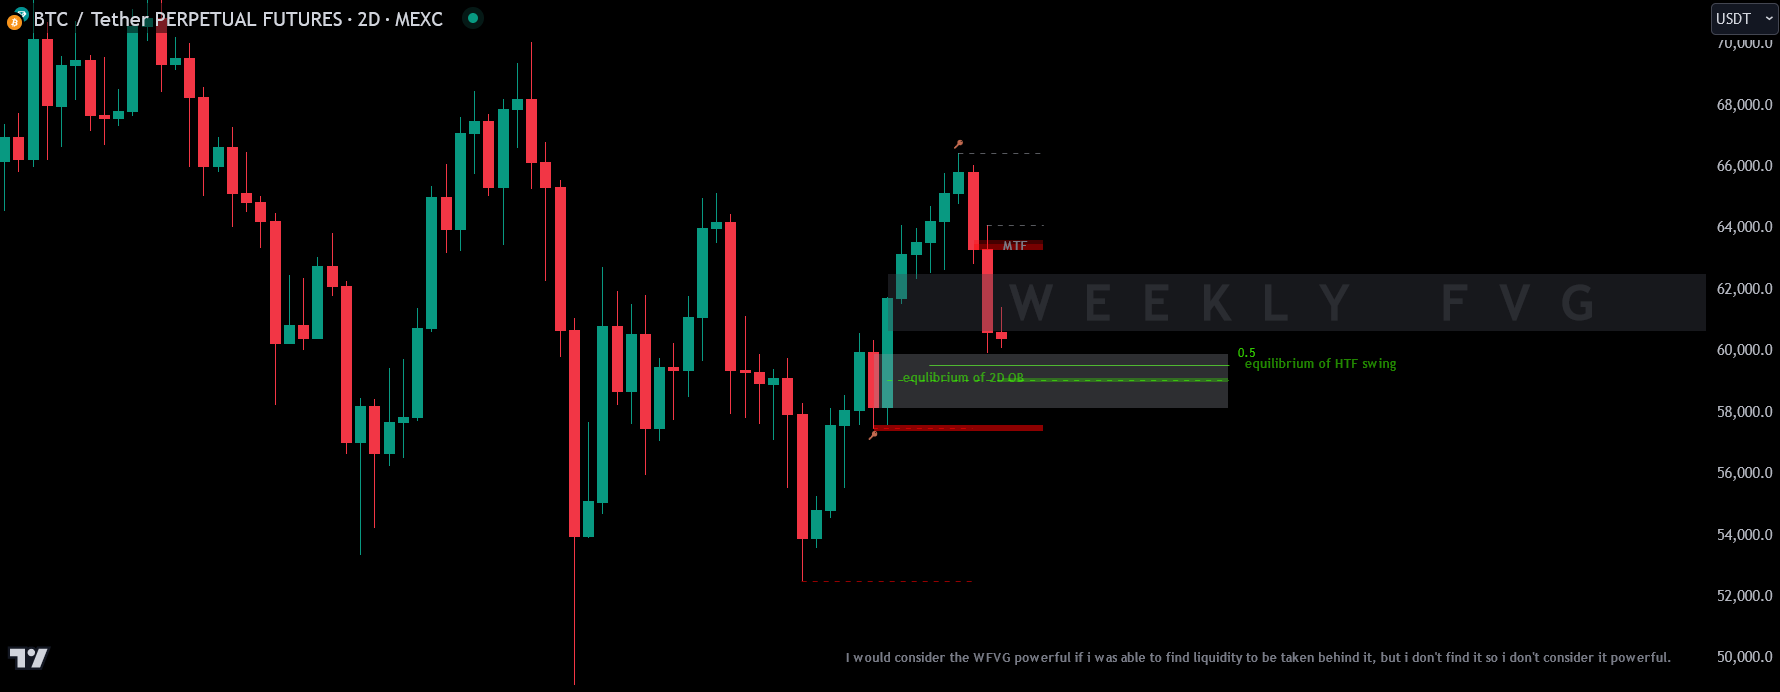
Bitcoin approaching a 2D order block — the last liquidity level before a potential double-bottom, still above equilibrium of HTF swing. If I were to enter a long, it would be at the 0.5 of the 2D OB with a stop just below. But this isn't as strong as finding optimal or semi-optimal levels, and I don't chase trades like that. The most optimal setups had already played out. The next most optimal opportunity was around $44K, but otherwise I watch for an HTF close above the key swing high at $66,450 or below the key swing low at $57,490. Once either occurs, I look for a pullback or retracement into a key level — if there's a good entry point, like hidden liquidity I can refine and find confluence with fibs, that's where I make my move.
There isn't always an opportunity on every chart. Focus on finding the most optimal setups on coins with high trading volume, create a plan, and patiently wait for those key levels to be reached. You don't really have to wait too long, unless you're only trading one or two coins.
You'll understand what counts as a powerful key level if you study the earlier plays — especially BTC. Look at the key levels mentioned and their timeframes, like the $49K reversal level. Compare it to current price action. Do you see any level as optimal as that near current market price? You don't. So don't try to play the hero — wait for the most optimal opportunities, alongside a clear HTF break and close above or below key swing highs or lows.
In the meantime, many altcoins with significant trading volume have yet to reach their HTF key levels. We could be witnessing a "reset" — a liquidity grab before the next reversal. A reset doesn't necessarily mean everything will crash, but it often signals a liquidity grab before a reversal.
This is why understanding the market at an elite level is a must — analyzing high-trading-volume coins properly provides clues to "is it going lower?" In this market, everything is intertwined.
If you were to take a long at the equilibrium of the 2D OB, would you set TP levels between the entry point and the equilibrium for the HTF swing? Or would you use Fib confluence?
Another important lesson: when you enter a position, you need clearly defined TP levels — not random levels at fibs or in "no-man's-land." If you find a solid key level to enter but can't identify any significant levels where price might reverse afterward, why would price reverse at your key level and not at a lower one to then pump into your ideal key level that failed and became an untouched BB behind an FVG? You can't just long and "I hope it goes up a lot."
Adapting Mid-Move
At the time, BTC printed a double top at all-time-highs right when altcoin entries are fresh off HTF key level breaks. You had the whole swing planned. The setup was clean. Timing felt perfect.
Now you might wonder if Bitcoin is signaling potential macro rejection. A talked-about date on CX, whales' public meeting soon. What do you do?
- Hold alt positions and trust the structure?
- Trim and reduce exposure?
- Assume ETH is about to outperform, dragging alts up without a pullback?
- Flip bias completely and reposition?
- Consider that maybe this is exactly what the market wants — to shake you out before continuation?
- Think about how you'd feel watching it run without you if you exit now? Or how you'd feel watching it nuke while you stayed in out of pride?
This is where most traders fail — not at entry, but at adaptation. Anyone can nail the entry if you learn powerful strategies. But only a few can navigate a shift in momentum when Bitcoin sneezes and the entire market questions its next breath.
Recall the framing: alts don't lead, they follow. If it makes sense, fuel. TP1 at RL, BCS at HTF BB. Treat all long opportunities on altcoins at key levels as scalps. So take some profits, de-risk, and use caution. If the market wants to keep running, good. If BTC sneezes and alts melt their levels into the levels we're watching, also good. See If BTC is in Decline.
Closing Through-Line
Ranges define where you act. Range highs and lows are the decision points. Nested ranges tell you which timeframe is in charge of the move you're trading. And once price leaves a range, Trend strength — read through impulses vs retracements, dominance, and momentum — tells you whether to lean in, scalp, or stay out.
Master the range and you've mastered most of what you need to read any chart. Everything else — schematics, 🎁Supply & Demand, Buy & Sell Programs, Overbought & Oversold, 📈Price Action Rules — sits on top of this foundation.