Market Structure Fundamentals: Trends, Swings, and Pivots
Market structure is the foundation everything else in this curriculum is built on. Liquidity, imbalances, supply and demand, premium and discount — none of it makes sense without first understanding the structure underneath. If you can read structure, price action stops feeling random. You start to see what the market is doing, and that's the first step toward knowing what to do about it.
This lesson lays the foundation. We'll cover candle anatomy, the three structural states (bullish, bearish, ranging), how to label swings precisely, the four macro phases of every market, how to confirm a break of structure properly, and how higher timeframes dominate the lower ones. The detailed mechanics of breaks of structure, ranges, supply and demand, and so on each get their own lessons — this is the map.
MS Candle Structure Break Of Structure & Change Of Character Trend Strength Patterns
Candles First: How to Read One
Before market structure, you need candles. A candle is a summarization of one trading session — a battle between two factions:
- Buyers → green candles
- Sellers → red candles
Everyone is fighting for the win. When the forces are in balance, neither side prevails — that's a stalemate. When one force dominates, you see direction, supported by volatility and volume. You can also have fake movements that give the illusion of predominance and end up as fakeouts.
That's why closures matter. A closure is a summary of the trading session — a victory, bullish or bearish, depending on the timeframe (1H, 4H, 1D, 1W, 1M).
Higher timeframe = less noise = better outlook. That's why I personally pay attention to 1D, 1W, 1M for trend riding. I'm not interested in the volatility that precedes the closure — it just helps me analyze the trend more clearly.
OHLC Anatomy
Every candle has the same structure: Open, High, Low, Close — OHLC. This is crucial to master.
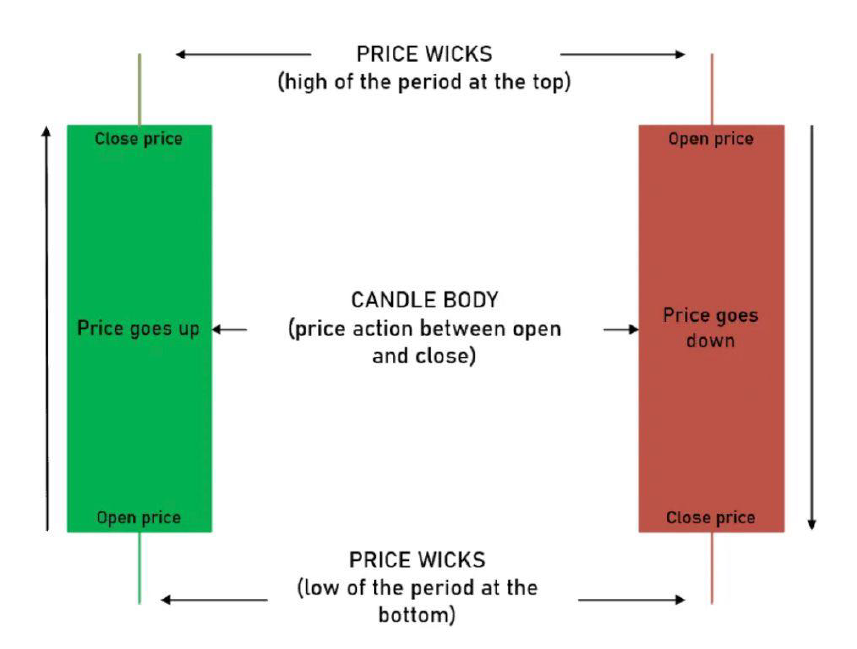
- The body combines the opening price with the closing price and is represented by the widest part of the candle.
- The wicks connect the maximum and minimum to the body with a line. Wicks are where price spiked (up or down) before closing back.
You'll have upper wicks (price spiked up, came back) and lower wicks (price spiked down, came back).
- Longer wicks flash uncertainty in the market.
- Short wicks flash stability.
- A clear trend usually has candles with very short wicks — one side dominates the other.
Candle Strength
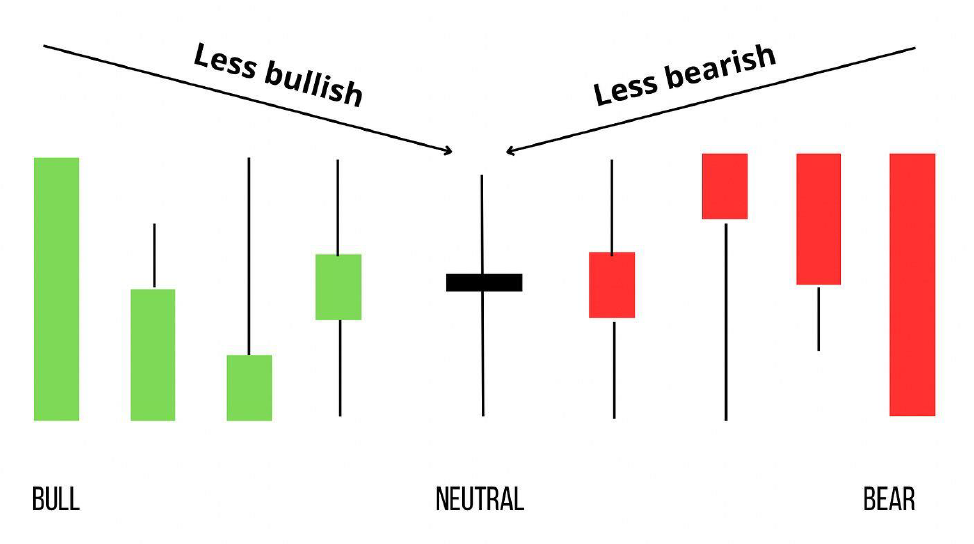
A larger candle without wicks represents strong pressure. As wicks grow, that pressure decreases. The principle behind it is simple:
If there are more buyers than sellers, the buyers do not have anyone to buy from. The price increases until it becomes high enough that sellers find it attractive to get involved again. At the same time, the price eventually becomes too high for buyers to keep buying. The same logic applies in reverse for sellers. That's how a market thrives — you buy, I sell, and vice-versa.
The Closure Law
Here's the law: if you're confused about a short timeframe, extend it. If the 1H confuses you, look at the 4H. If the 4H still confuses you, switch to 1D. And so on.
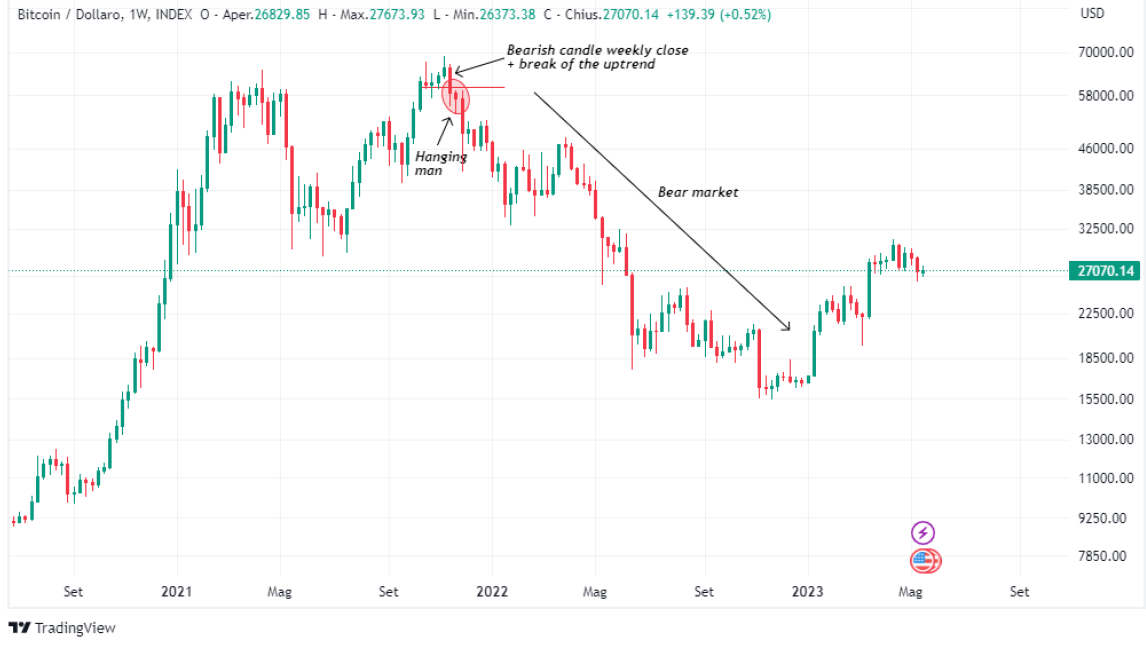
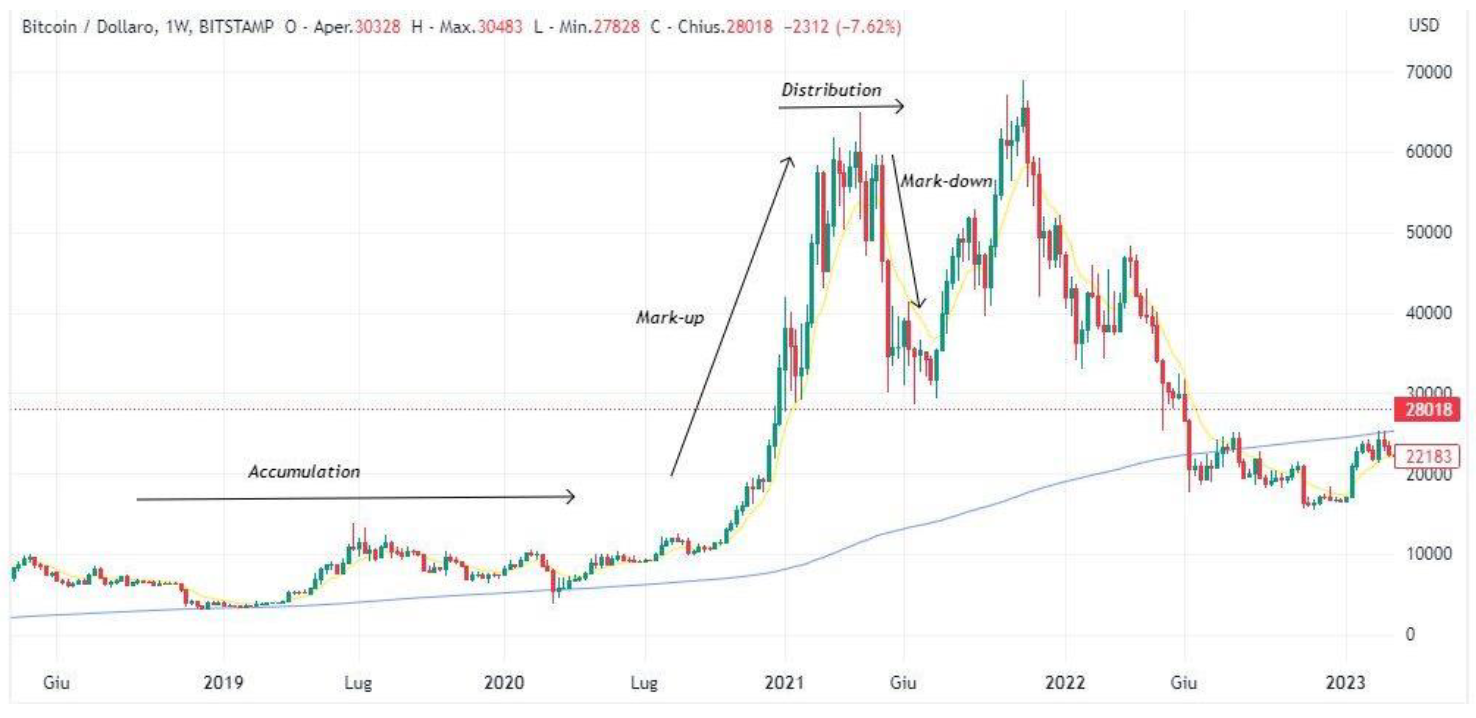
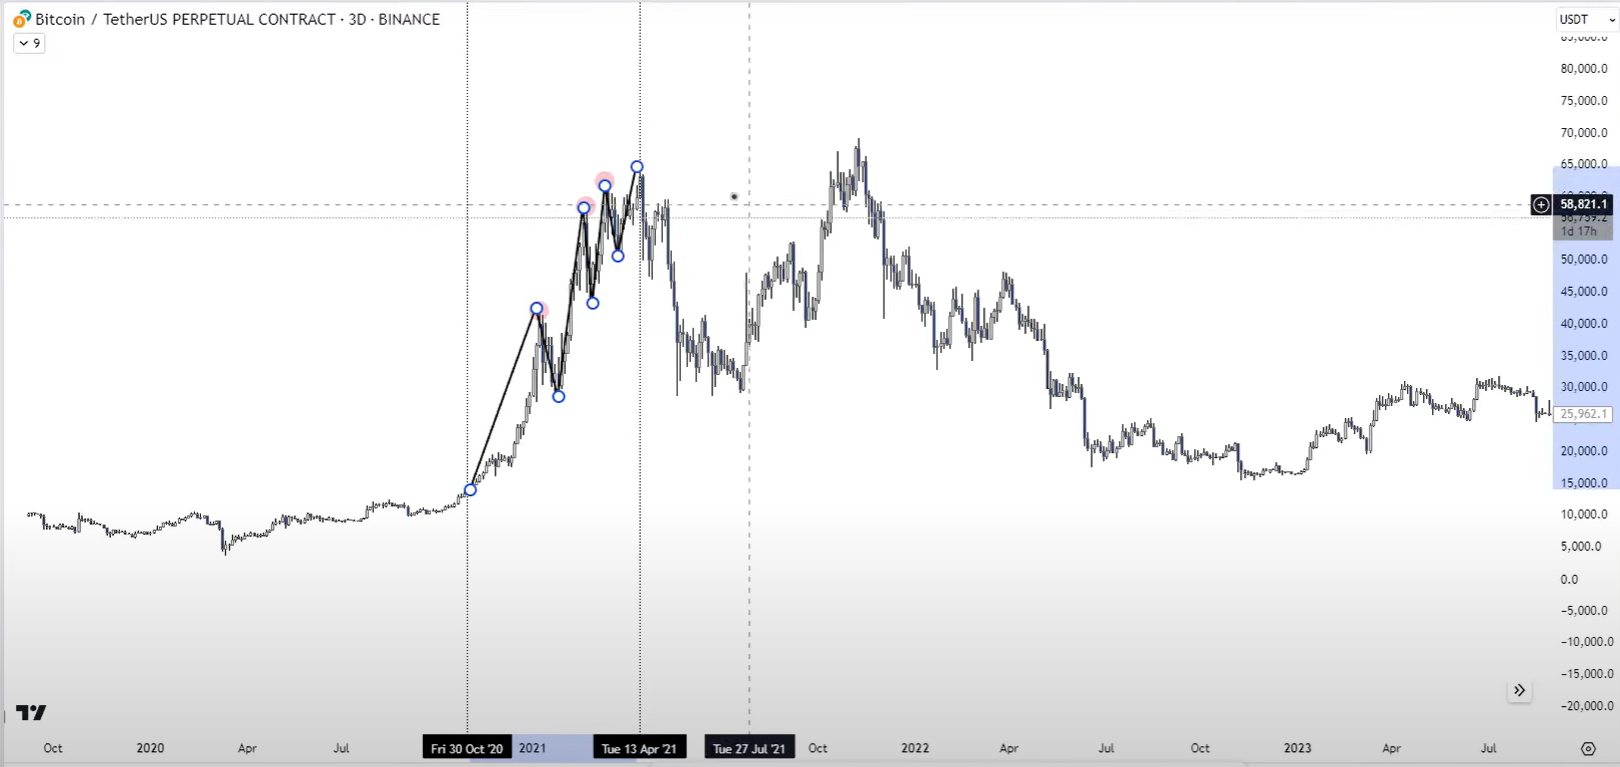
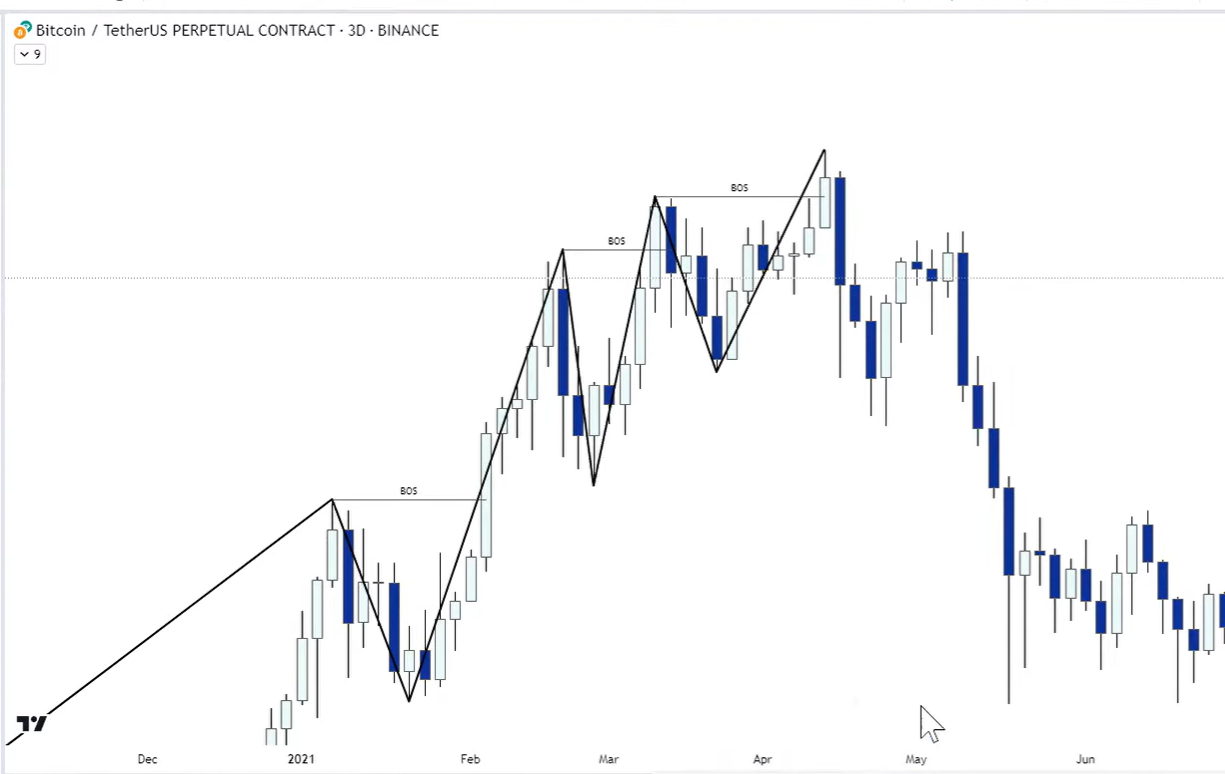
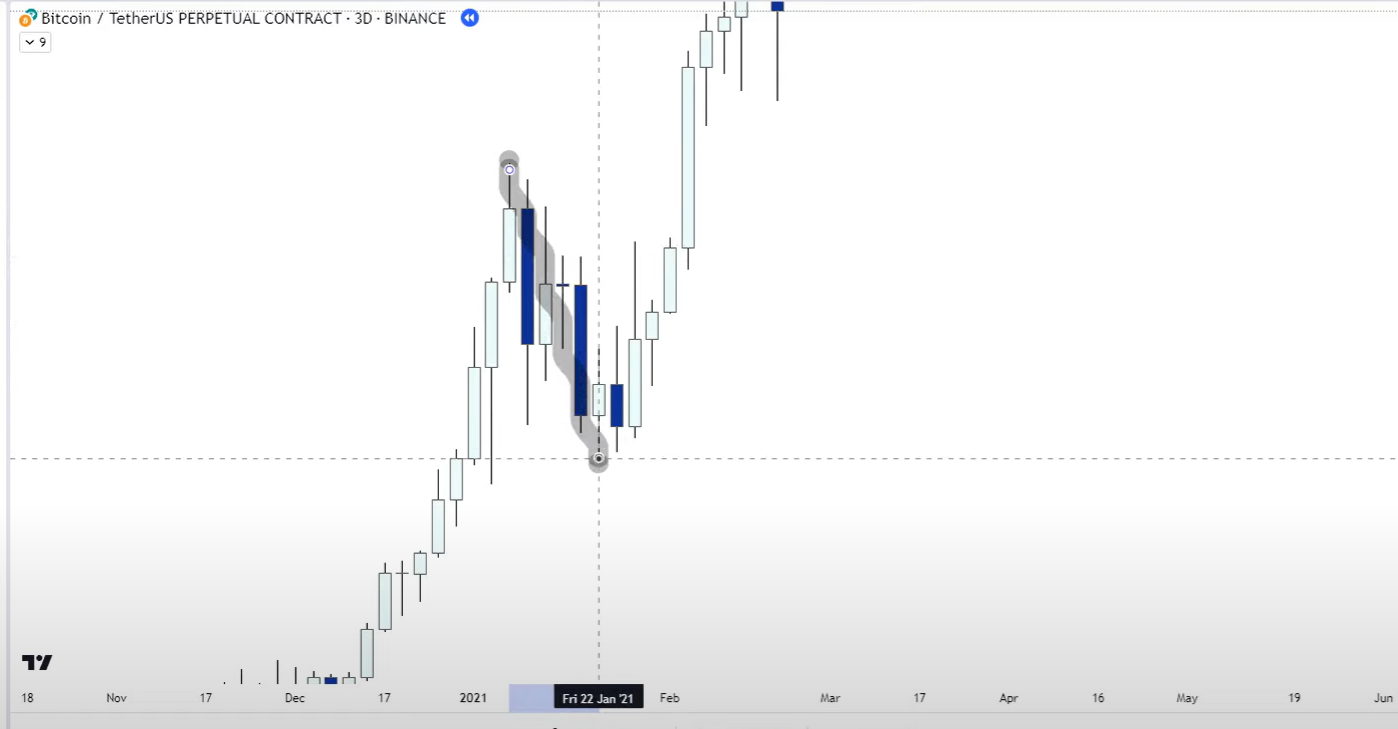
This is a weekly chart of the Bitcoin 2021 top. Each candle is one full week. At the top, there were no more buyers, and sellers started to take control by printing a red candle that broke the uptrend. After that break, a hanging man printed — useful to determine the shift in trend and the consequent bear market. (You can ignore the weird candle names.) That's why this is crucial. It can save your capital.
Newcomers don't look at closures, and that's why they get trapped at the top of every bull market.
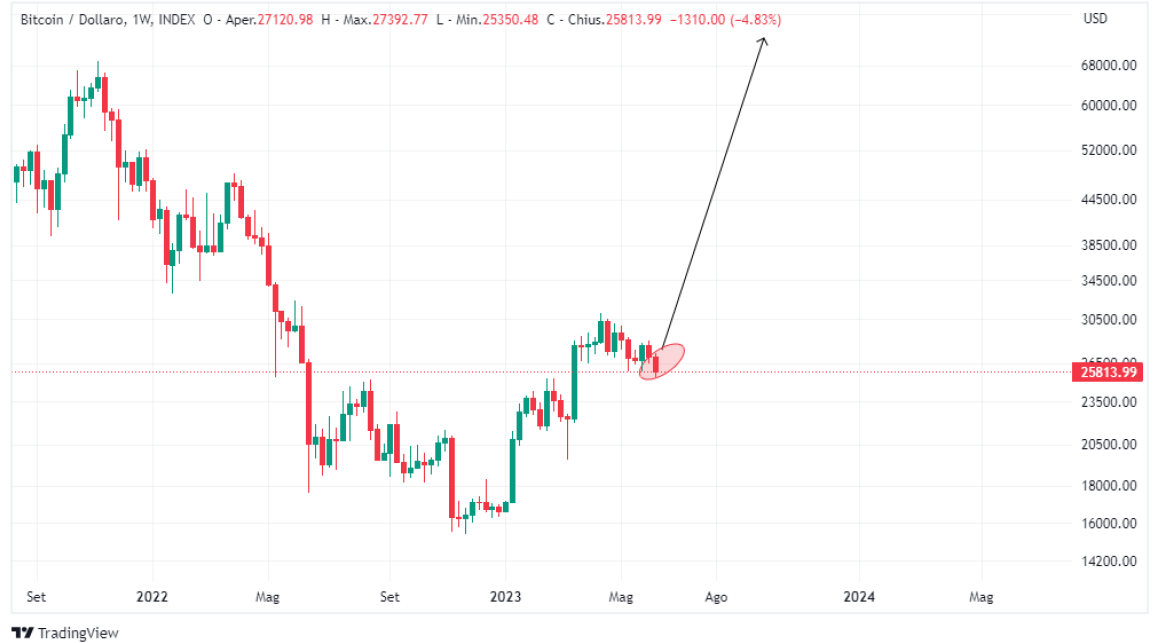
"How can I see how a candle closed, mate?"
It's simple. Click on the candle, and on the top right of the chart you'll see the closing price. In the example below, the closure was at 25813.
Closures Recap
- The weekly closure confirms the true direction of the week, giving traders a huge advantage.
- Price often changes throughout the course of the week — maintaining oversight of the weekly will ensure clarity.
- Knowing the trend can shift by the end of the week ensures you don't get caught in false moves earlier.
Big hedge funds don't look at 4H. They don't have time. They look at weekly and monthly predominantly.
Structure: The Foundation
Knowing market structure is like having a powerful light that shows you the correct path. It rules above everything — fundamentals, technical indicators, news. And it's not hard to understand.
Market structure has three forms:
- Bullish
- Bearish
- Neutral / ranging
Being able to identify the structure of the market gives you many advantages: knowing when to stay in or out, understanding when to buy the dip (or not), and catching trend reversals to improve profitability.
Market structure is the foundation on which all key concepts in this trading style are built. Liquidity, imbalances, and supply and demand are all rooted in structure. Price action is the process that builds it. PA follows liquidity, and that constant search for liquidity shapes structures.
Imbalances between buyers and sellers create directional moves (FVGs); balance creates fair value zones (Ranges).
Balance → Imbalance → Balance → Imbalance
"If there's no significant imbalances, there will be OBs and Supply/Demand fresh levels. If there's no OBs and Supply/Demand fresh levels, there will be significant imbalances. If there's none at all it will ⚡️ into a 'fresh' level and build a new trading range. Few…"
The higher the timeframe, the more robust the structure and the more reliable the signal. HTF > LTF.
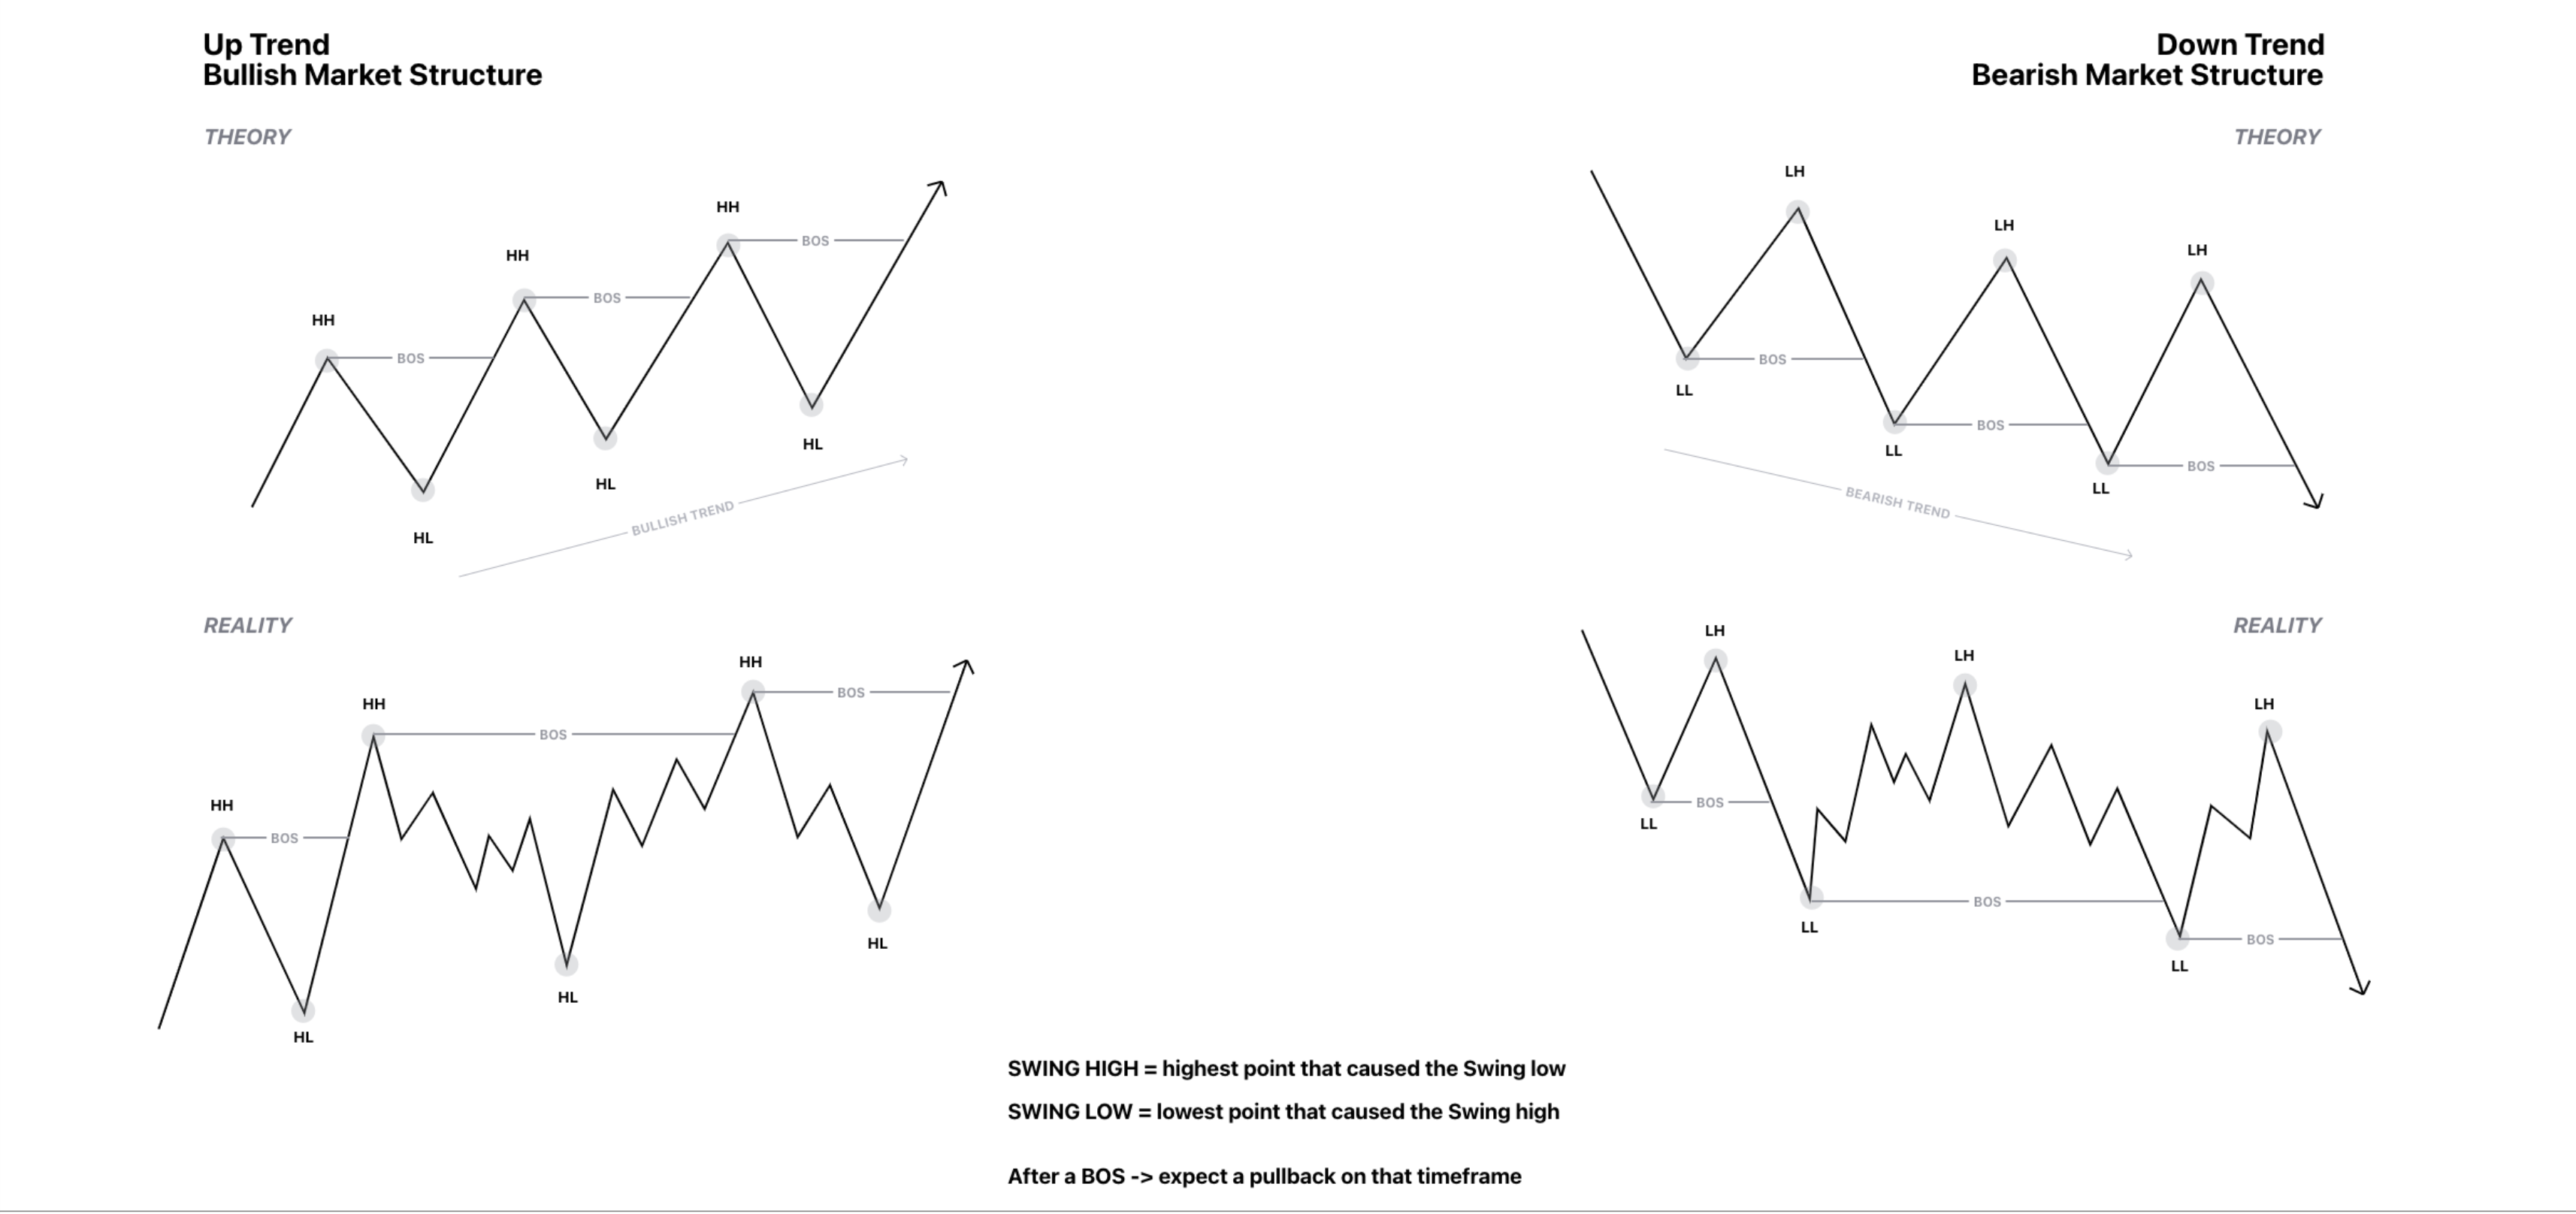
Bullish Market Structure (Up Trend) -> higher highs (HH) and higher lows (HL)
Bearish Market Structure (Down Trend) -> lower highs (LH) and lower lows (LL)
Higher lows and lower highs are not confirmed until a Break of Structure (BOS)
Swing High -> highest point that caused the swing low
Swing Low -> lowest point that caused the swing high
BOS -> break of Swing structure
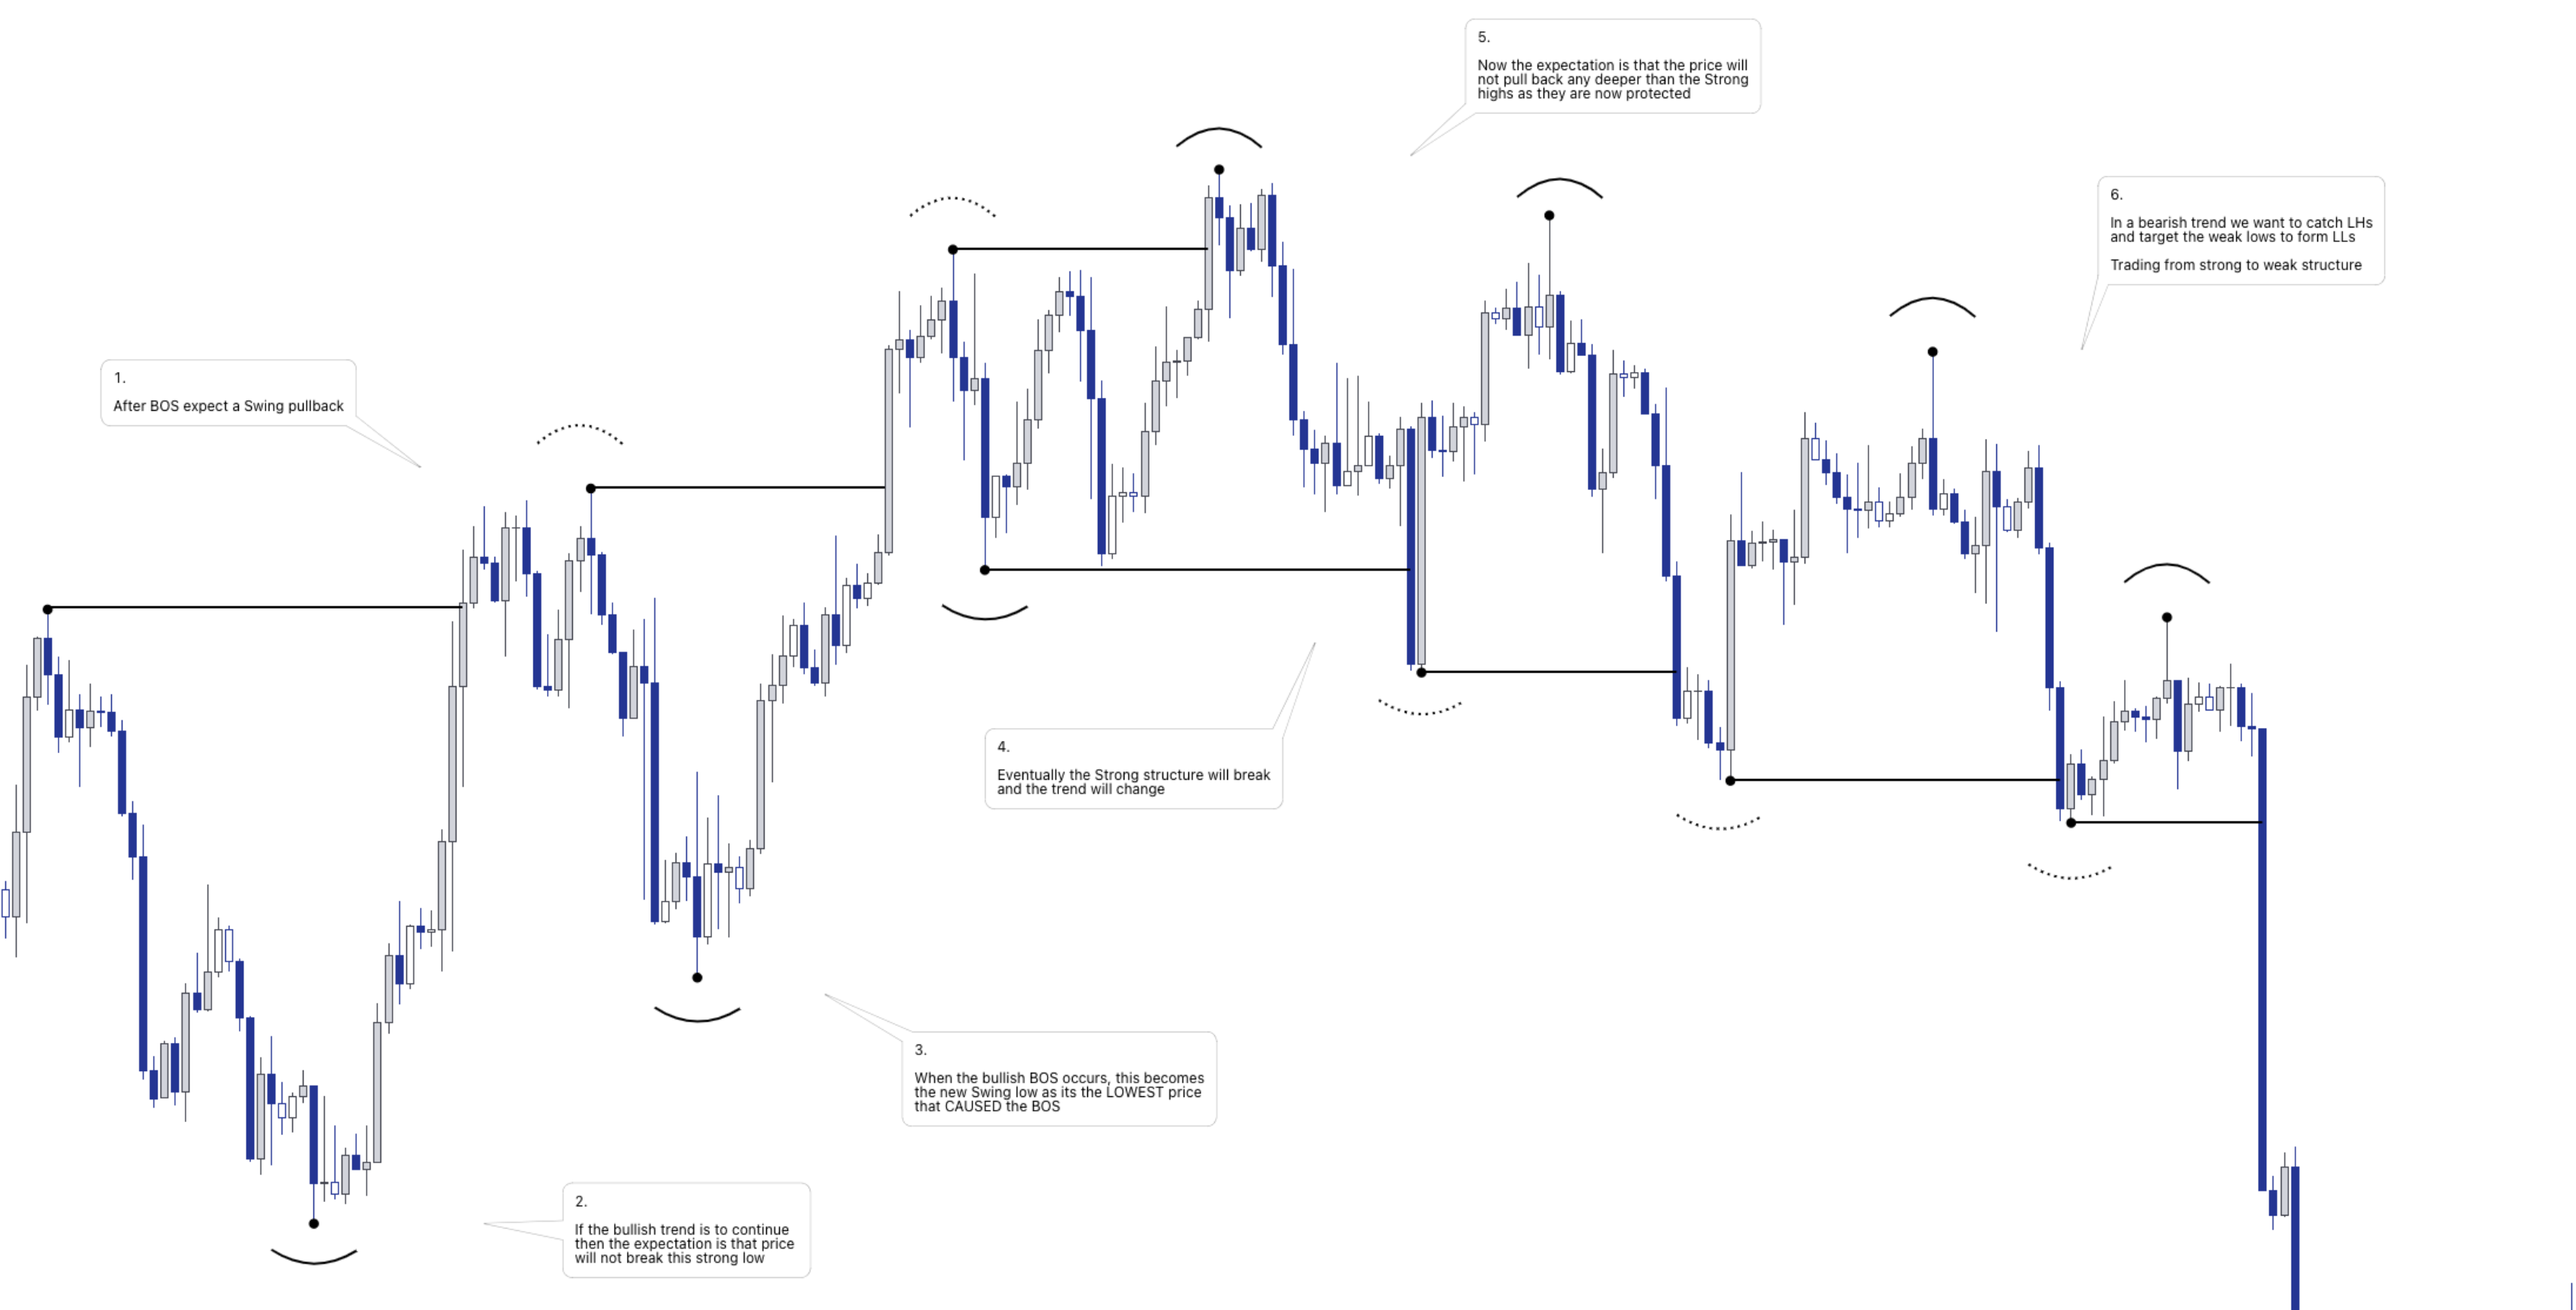
After a BOS, expect a pullback on that timeframe
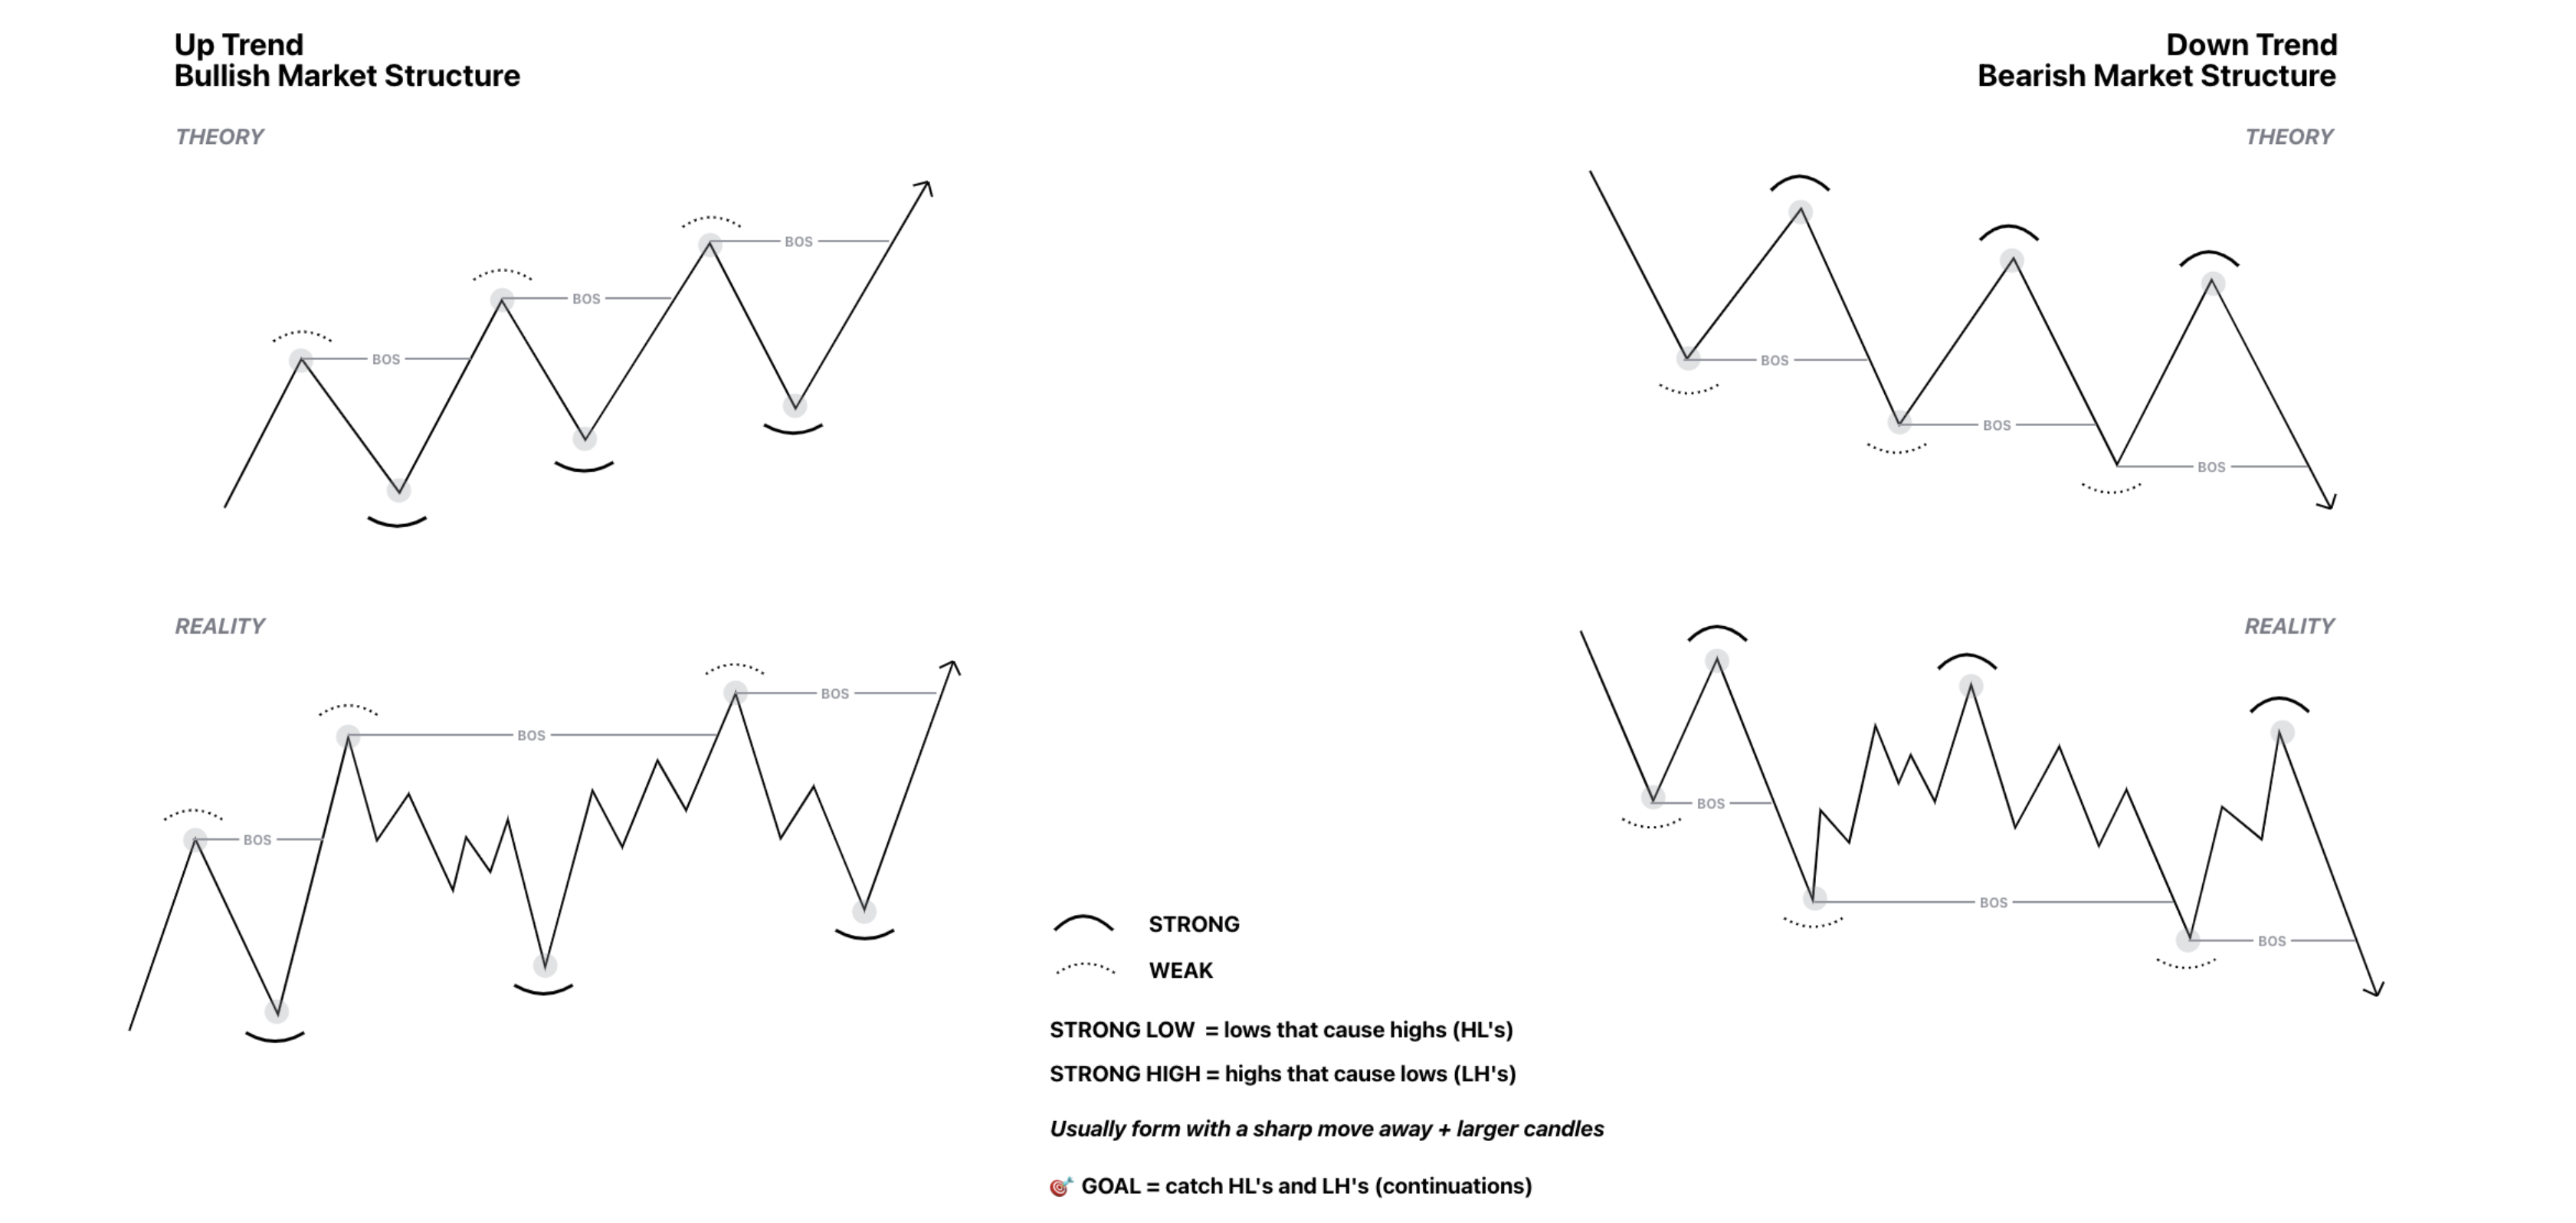
Strong and weak highs and lows
Strong high/lows break structure
Weak high/lows fail to break structure
Strong Lows -> lows that cause highs (HLs)
Strong Highs -> highs that cause lows (LHs)
Usually form with a sharp move away + larger candles
Big money has an interest in protecting those strong swing points
🎯 Goal = catch HLs and LH's (continuations) and target HH's and LL's (weak structure) = follow the trend!
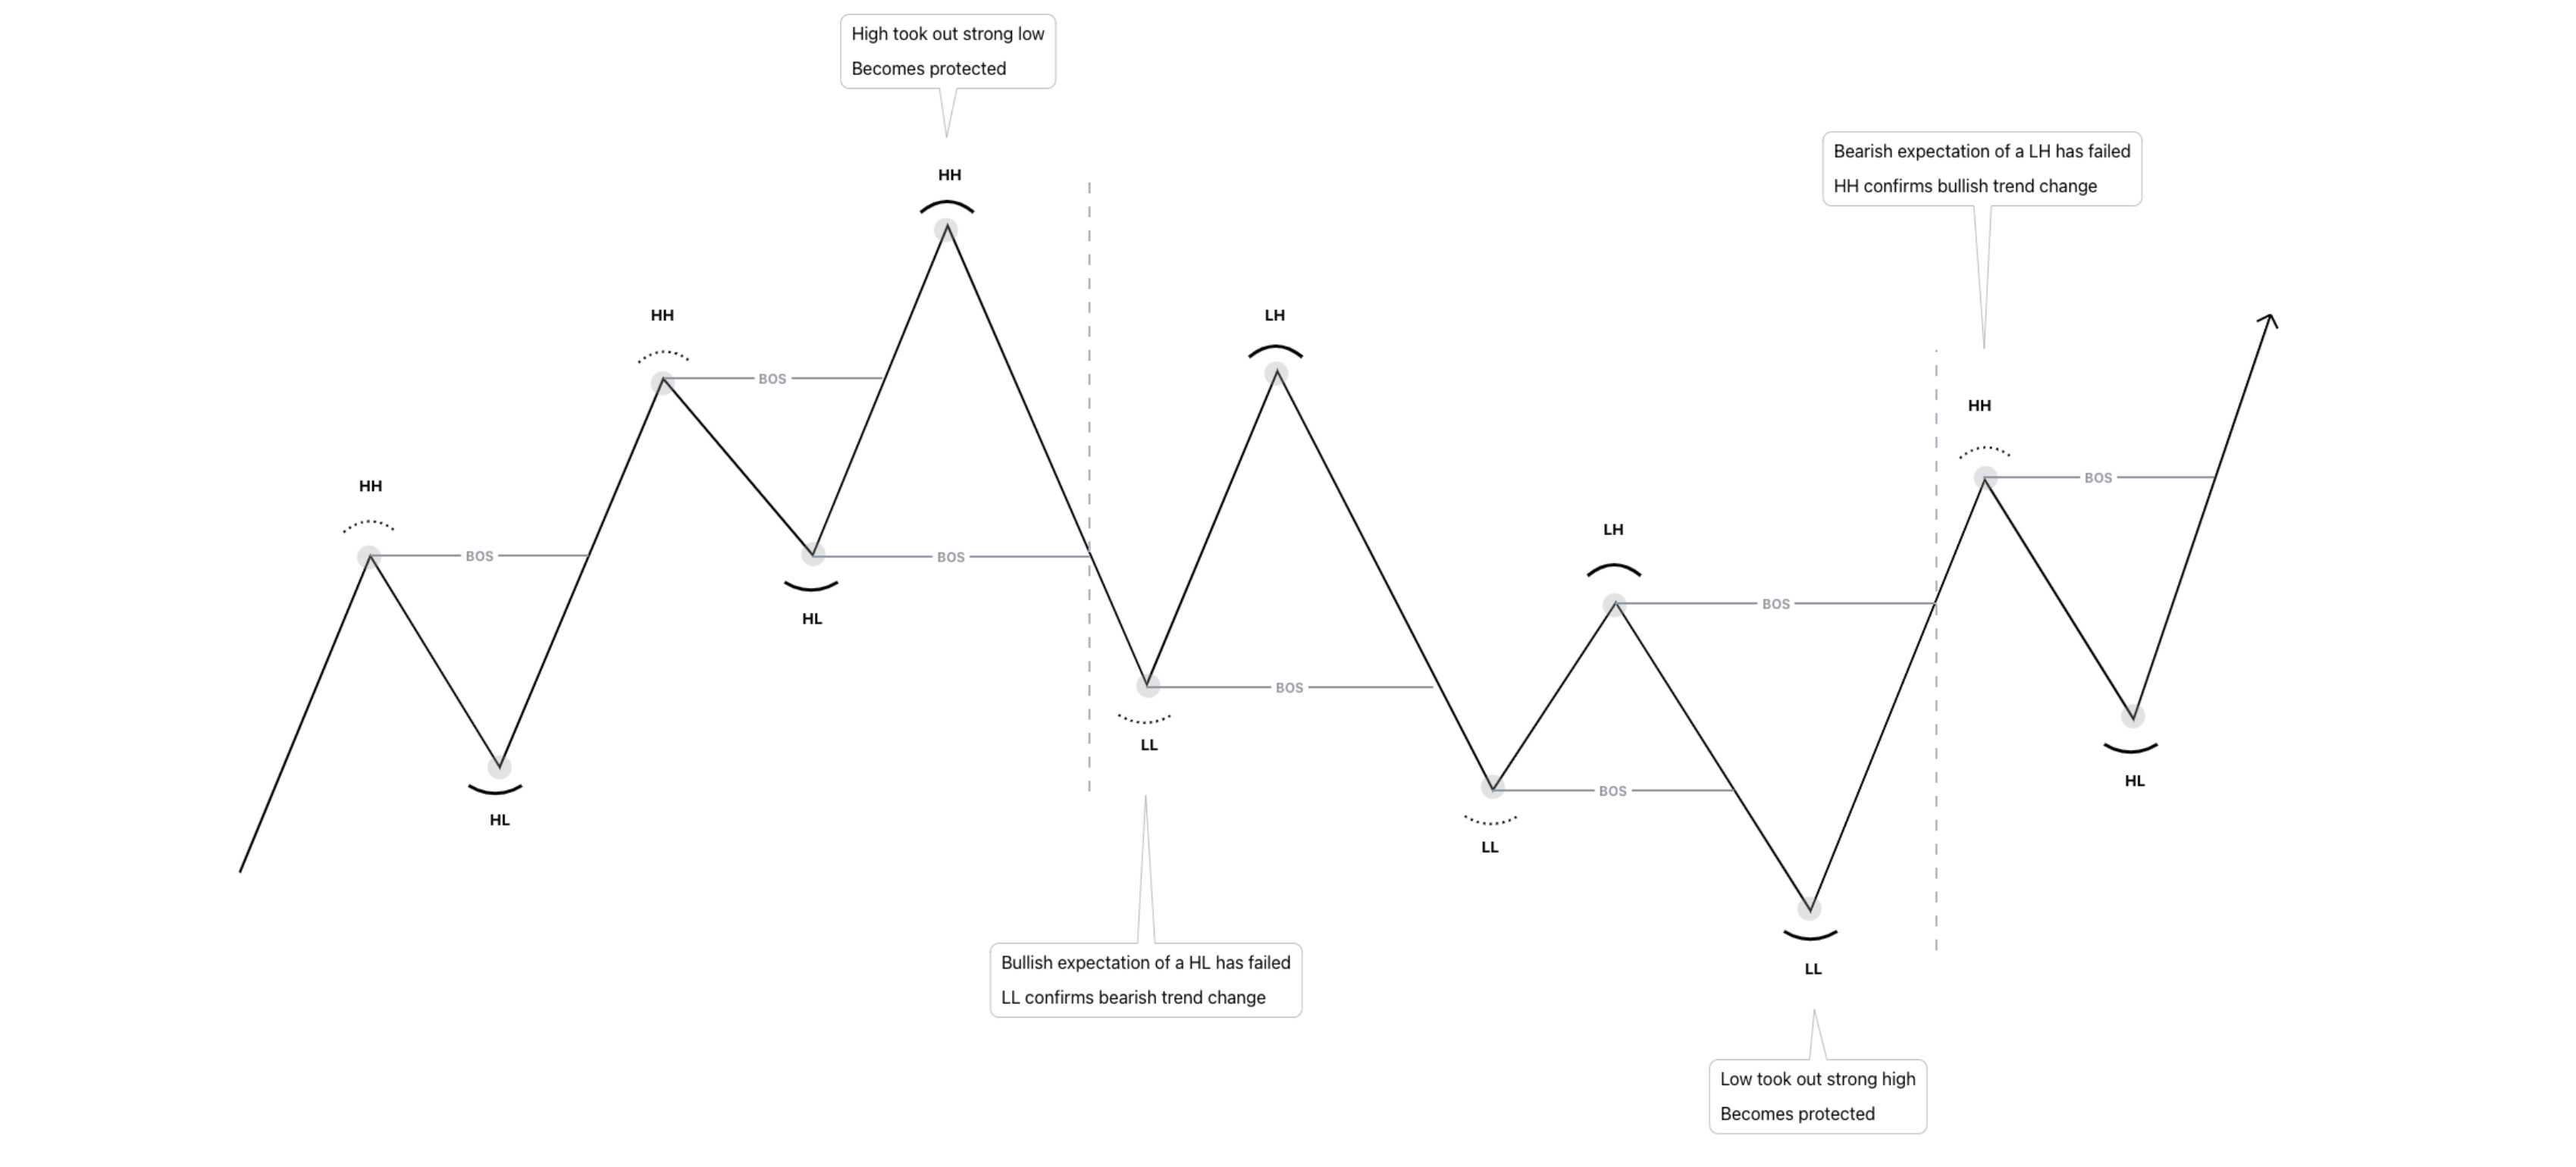
Trend change
A trend change is when the expectational order flow (EOF) fails.
In a bullish trend, the expectation is that price will continue to make higher highs and higher lows.
In a bearish trend, the expectation is that price will continue to make lower highs and lower lows.
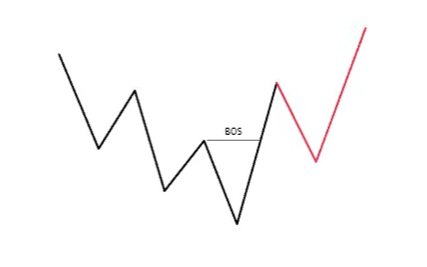
Bullish trend change -> is confirmed once price breaks a swing lower high to form a swing higher high (bullish BOS).
Bearish trend change -> is confirmed once price breaks a swing higher low to form a swing lower low (bearish BOS).
Quick example and 3 types of structure
3 TYPES OF STRUCTURE
There are 3 types of structure:
Swing -> BOS -> candle body close
Internal -> i-BOS -> candle body close
Fractal -> CHoCH (fractal structure trend change) -> wick break
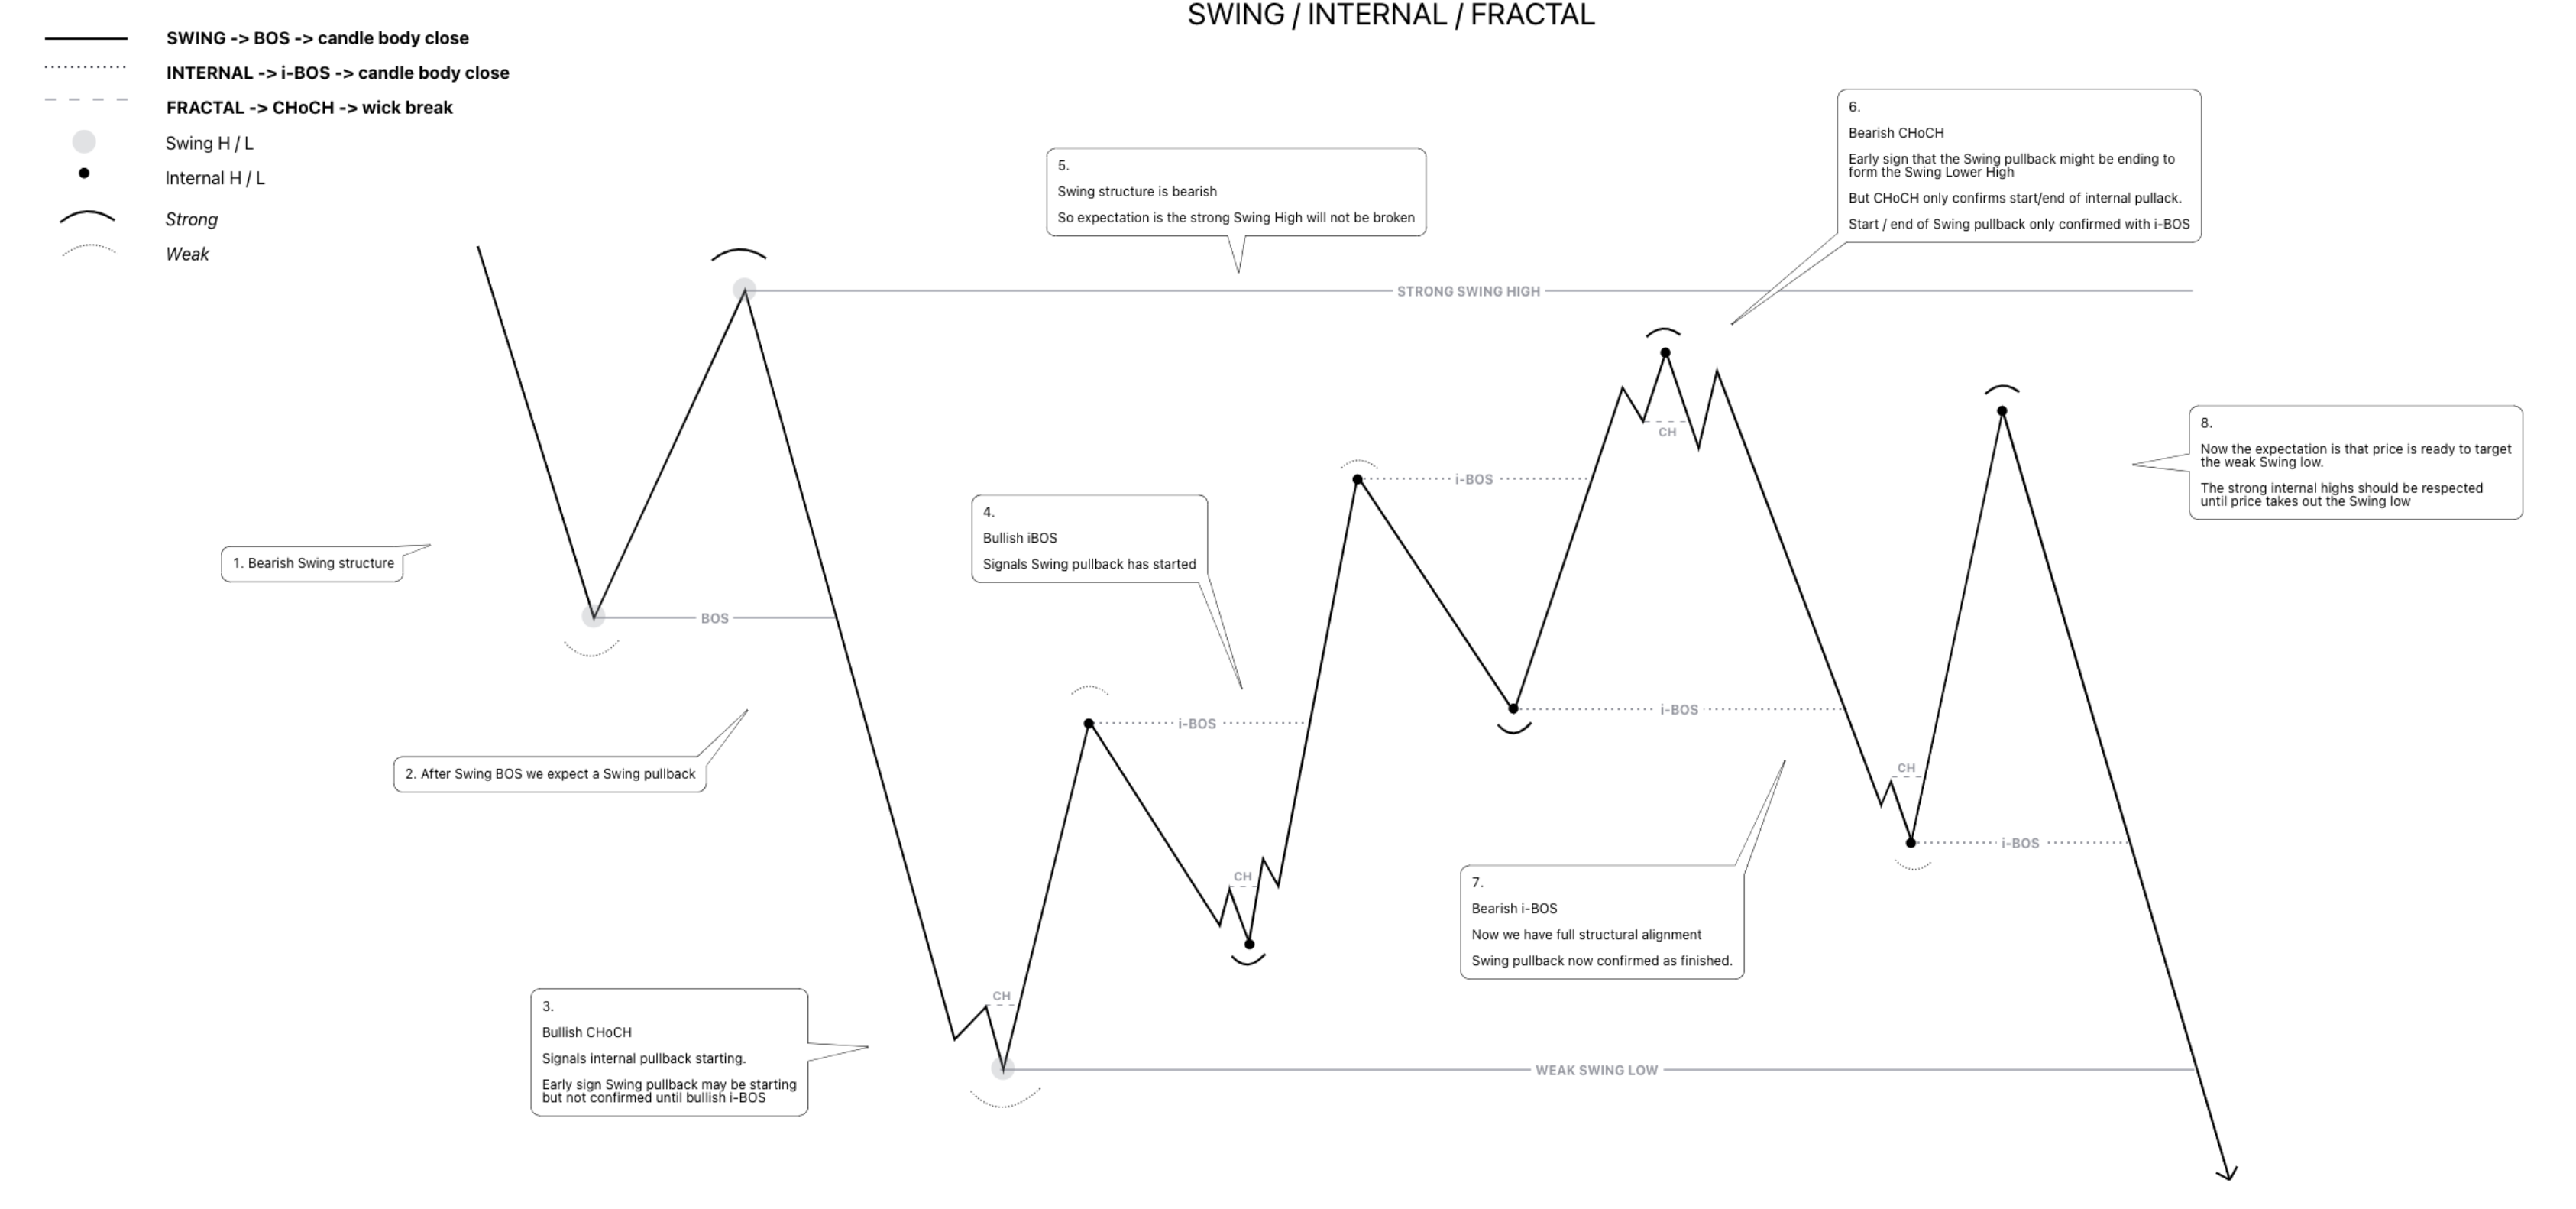
Internal Structure Expectation:
When the Internal structure is aligned bullish (bearish) with the bullish (bearish) Swing structure, the expectation is that the bullish (bearish) Internal trend will continue until it breaks the weak Swing high (low).
If the bullish (bearish) Internal structure fails to do this and switches bearish (bullish), then the expectation is that the new Internal trend will stay bearish (bullish) until it breaks the larger internal weak low (high).
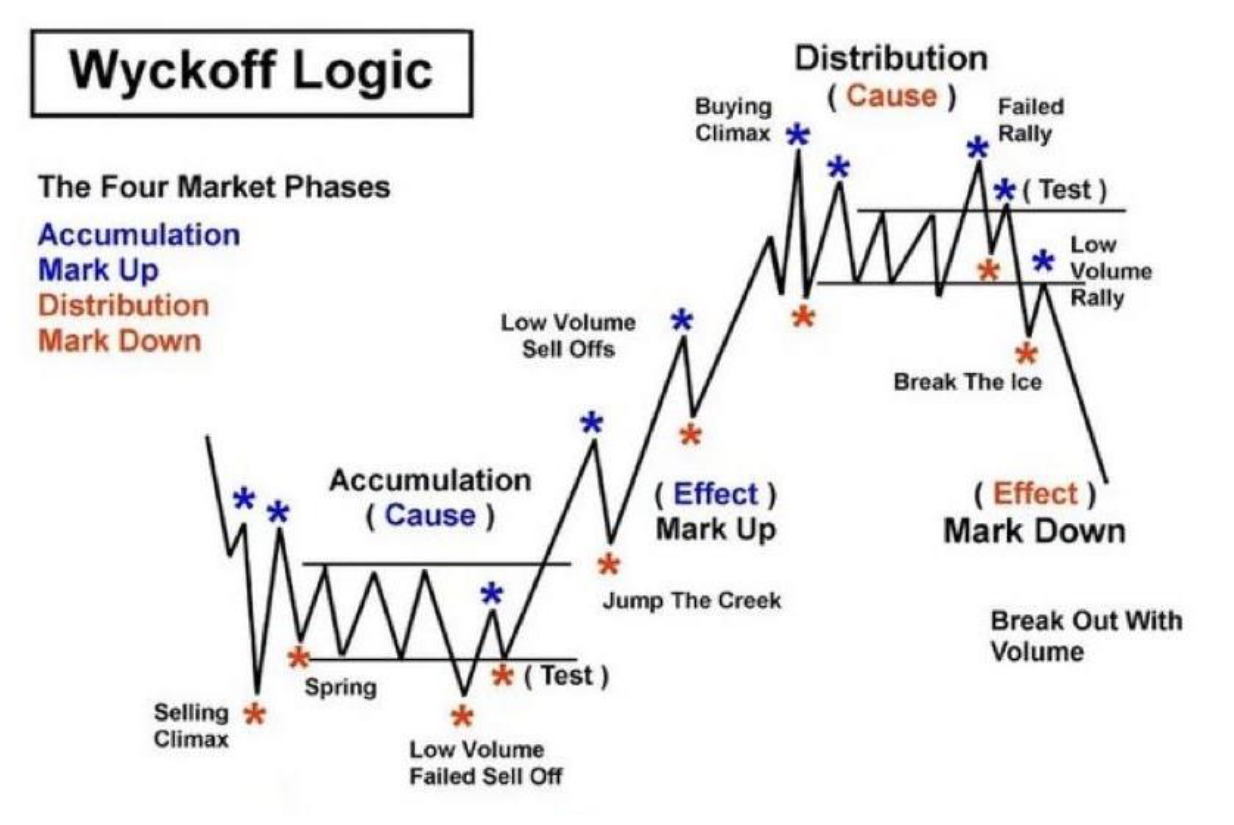
The Four Macro Phases
Before getting into trends, we need the bigger picture. Each financial market has an overall structure made of four phases. This is the Wyckoff Method view of how markets cycle.
Accumulation Accumulation is sideways activity that follows an extended downtrend and can last months or years. Sentiment is highly negative. Retail has already left the market because it's boring; they doubt it will rise again. This is the phase where smart money quietly accumulates positions without moving price too much.
Mark Up The price breaks out of accumulation and rips higher, fed by retail piling in. Frenzy, hype, and FOMO dominate.
Distribution Distribution is the opposite of accumulation — sideways activity after an extended uptrend. People are still in hype, waiting for "the next leg up." This is where smart money sells off positions without moving price too much.
Mark Down Price breaks down from distribution and enters a prolonged downtrend. Smart money liquidates everything, injecting massive sell pressure and trapping late buyers who continue to hold.
The Wyckoff Retest Pattern
Within these macro phases, two parts of the Wyckoff Method tend to play out with high probability:
- Jump the creek — a retest after the upside breakout of accumulation. Designed to trap early sellers. A bear trap.
- Break the ice — a retest after the downside breakout of distribution. Designed to trap late buyers. A bull trap.
The Psychology of Each Phase
Understand that the system runs on predictable human behavior. Stay hyper-aware of your own emotions and learn to flip them into signals.
Accumulation — Skepticism, disbelief, apathy. Retail avoids the market; volume is low; sentiment is bearish or indifferent. The most bearish news marks the bottom. "Markets are dead."
Bull Market (Markup) — Optimism, excitement, euphoria. Confidence builds as prices rise. Retail starts buying; FOMO kicks in. Volume increases; media turns positive; public participation grows. 🔺Intensifies with trend.
Distribution — Greed, overconfidence, denial. Retail believes the trend will continue; smart money is offloading. Volatility increases; price chops; bullish sentiment remains high. News stays bullish; influencers push FOMO narratives.
Bear Market (Markdown) — Anxiety, fear, panic, capitulation, despair. Retail sells in panic. Smart money prepares to accumulate again. Heavy selling; negative news cycle; retail sells at loss. 🔺Intensifies with trend.
"When you feel you will make a lot of money by holding, it is close to the top. When you feel you will lose all your money by holding, it is close to the bottom. Your own fear and greed emotions are two of the most powerful indicators you will ever find."
Bullish, Bearish, and Ranging Trends
Trends are always relative to the timeframe. Higher timeframe trends dominate lower ones.
Bullish Trend
A bullish trend is a combination of Higher Highs + Higher Lows (HH + HL).
- Higher High: Find the recent high, look left. If it's higher than the previous one → HH of the structure.
- Higher Low: Find the recent low, look left. If it's higher than the previous one → HL of the structure.
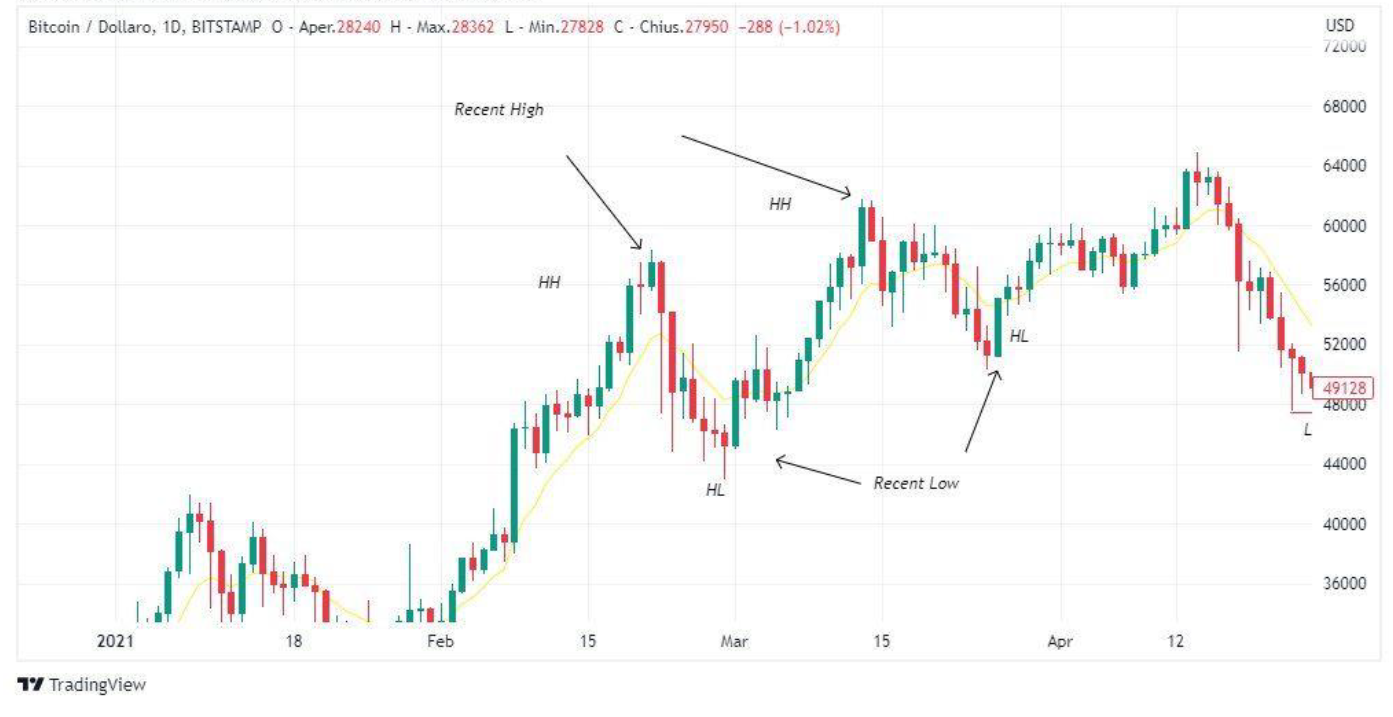
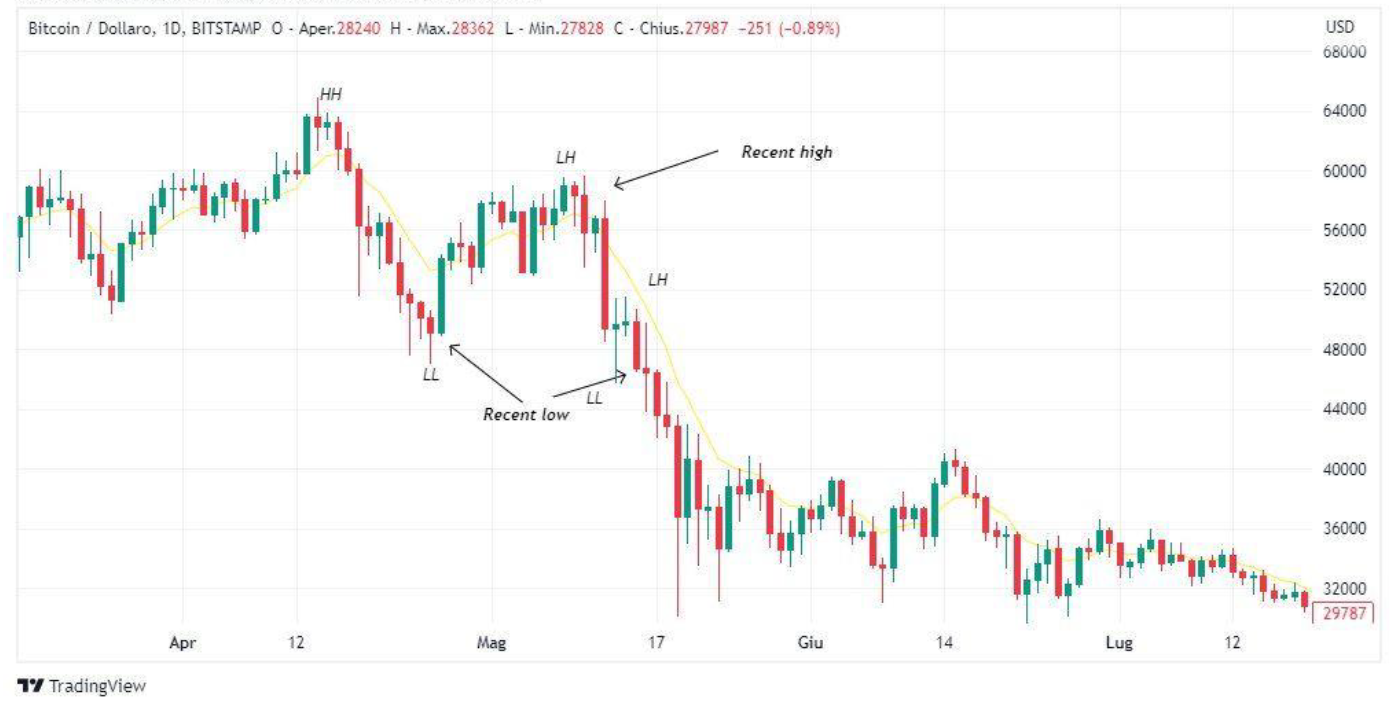
Bearish Trend
A bearish trend is Lower Highs + Lower Lows (LH + LL).
- Lower High: Find the recent high, look left. If it's lower than the previous one → LH.
- Lower Low: Find the recent low, look left. If it's lower than the previous one → LL.
Ranging (Sideways)
A sideways trend is made up of smaller trends confined to a range. Inside the range, you'll see small bullish and bearish swings, but neither side breaks out cleanly. Ranges get their own dedicated treatment later in this lesson.
Catching the Trend Switch
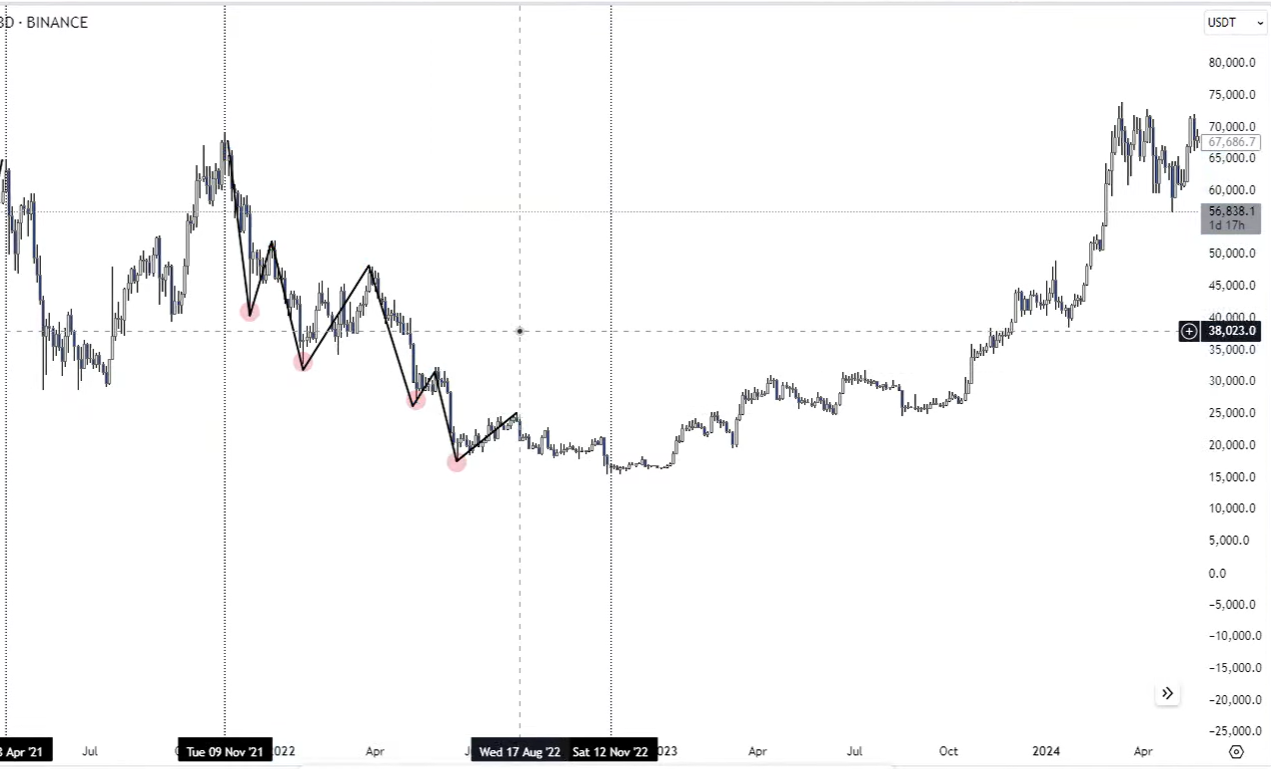
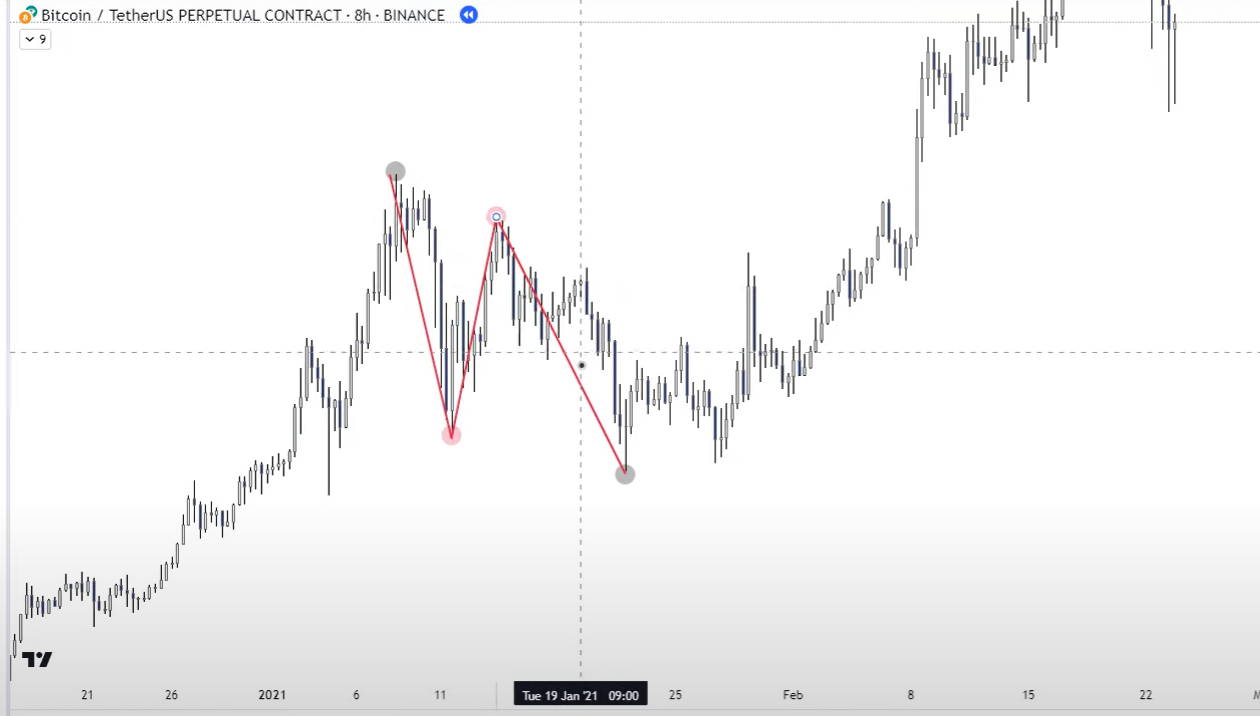
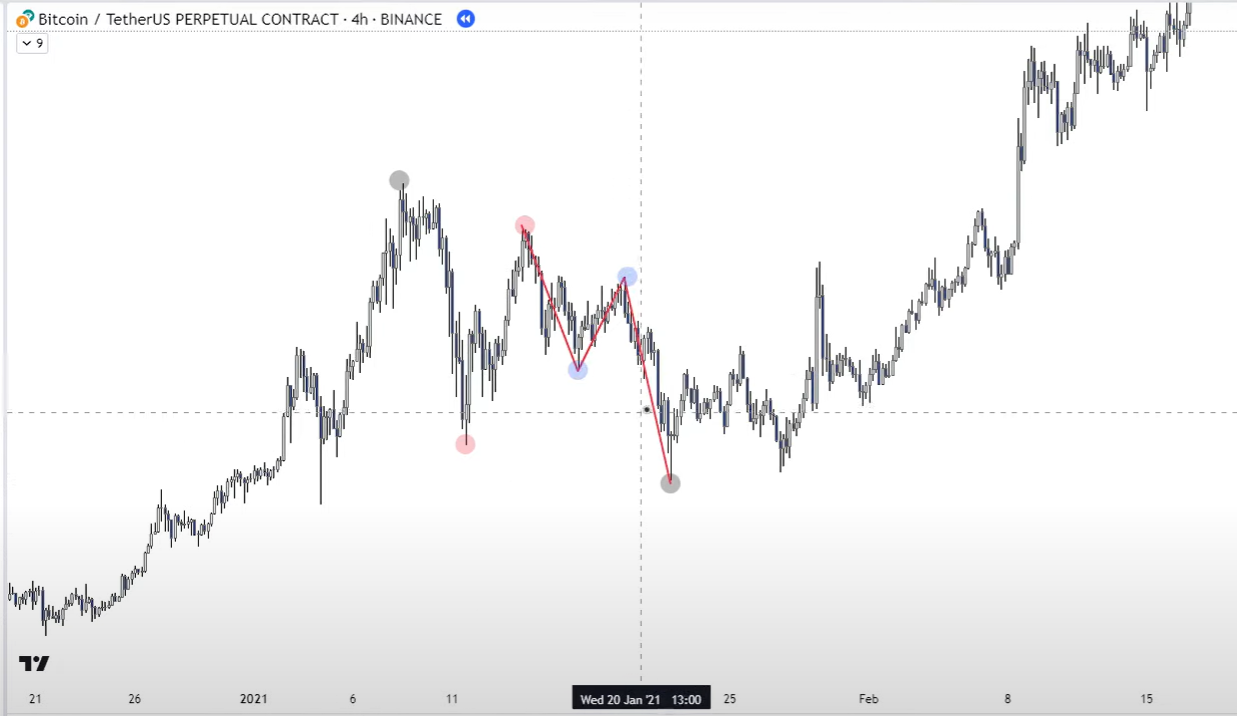
This basic skill is powerful because it lets you gauge a trend reversal and protect capital. Here's the 2021 bull run as an example:
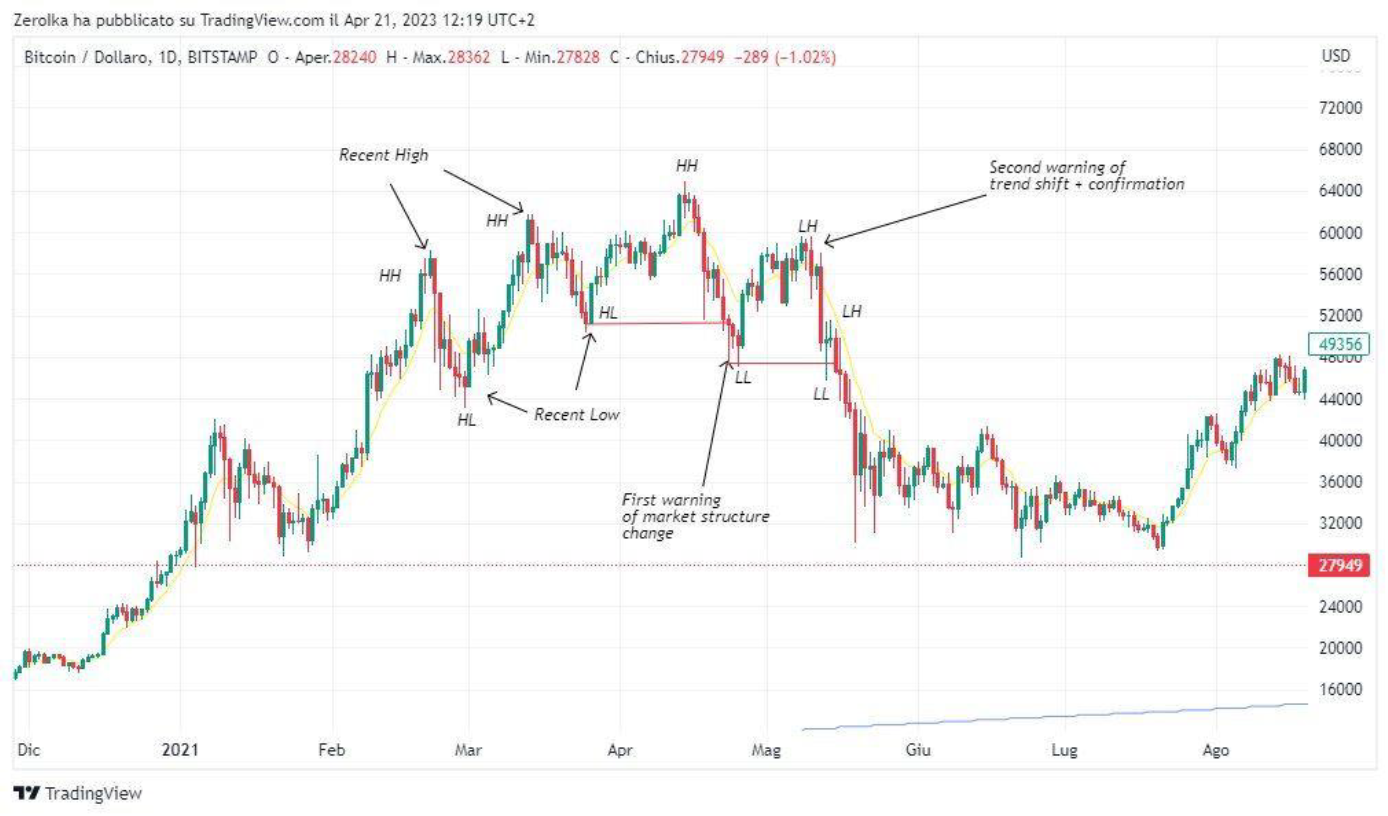
The HH+HL combo was perfect to identify trend continuation — until the first LL printed as the first warning sign, and the second warning came with a LH. The downtrend was confirmed after those two warnings, not before.
"But mate, which timeframe should I use to look at these structural changes?"
As covered in Candle Structure, candle closures are key — and 1W + 1M timeframes work as watersheds. Forget hourly and daily for the macro picture. Bigger timeframes give you the advantage of focusing on the predominant longer-term trend while ignoring the noise of day-to-day fluctuations. This makes it easier to hold an asset for a longer period without panicking.
Code Law
Whether you're a trend rider or an investor, this is KEY. I've proven on my skin the pain of holding assets with a broken market structure. It's brutal, no matter the asset. When you see confirmations of a break in market structure, sell. No asset is immune. It's code law.
Once you understand this, you're no longer lost. Price action makes sense. You stop fearing it.
"Mate, the price is tanking" — looking at the 4H or less. If the overall structure is bullish, you have nothing to fear. The trend is your friend until the end.
Quick Roadmap
- Open TradingView.
- Switch to weekly to get the outlook.
- Look at price action: HH + HL = bullish, LH + LL = bearish.
- If bearish, wait for a significant reversal (HH + HL on the weekly) before going long.
- If bullish, ride it until reversal (LH + LL on the weekly).
No asset is immune to this law.
Swing Highs and Swing Lows
Now that we've got the basics, let's get precise about swings — the high and low points of a move that spans multiple candles. They're the building blocks of structure and the reference points for almost every strategy you'll learn.
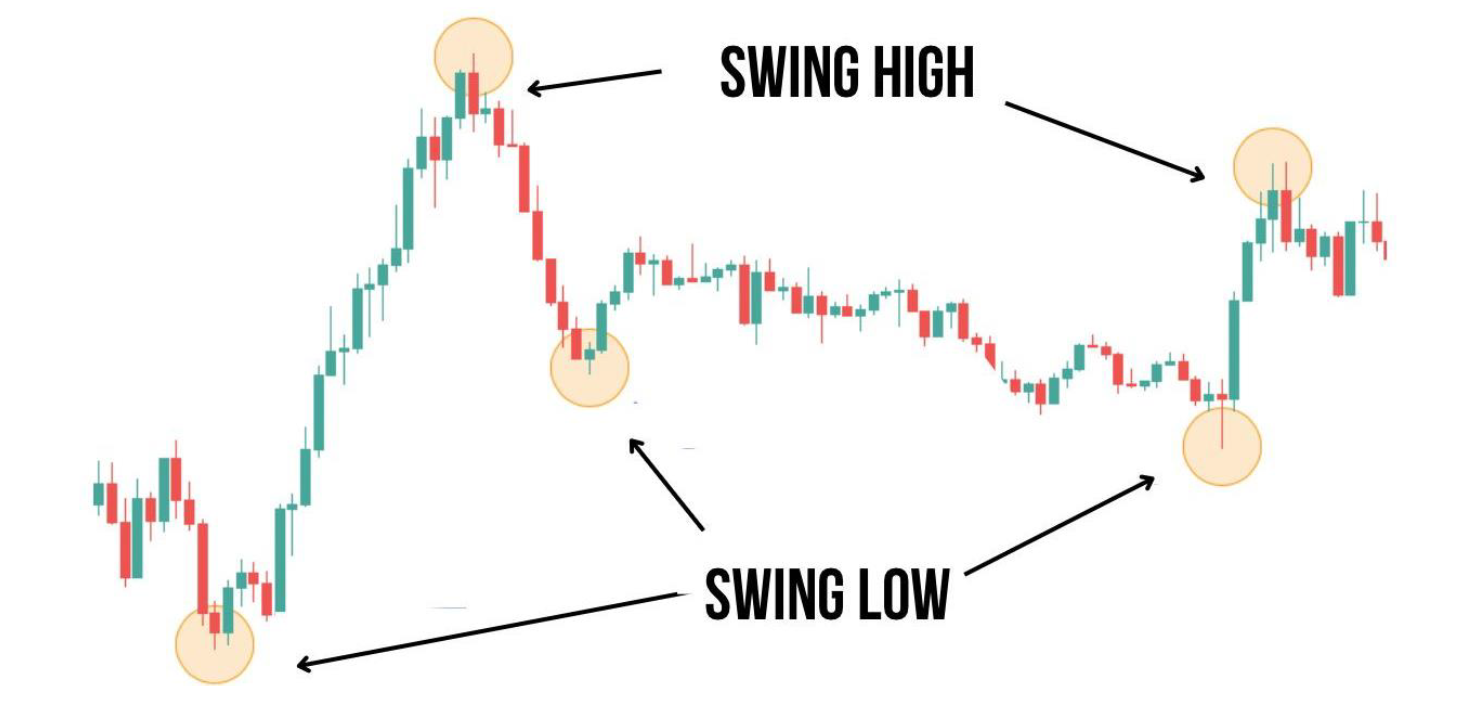
How to identify them:
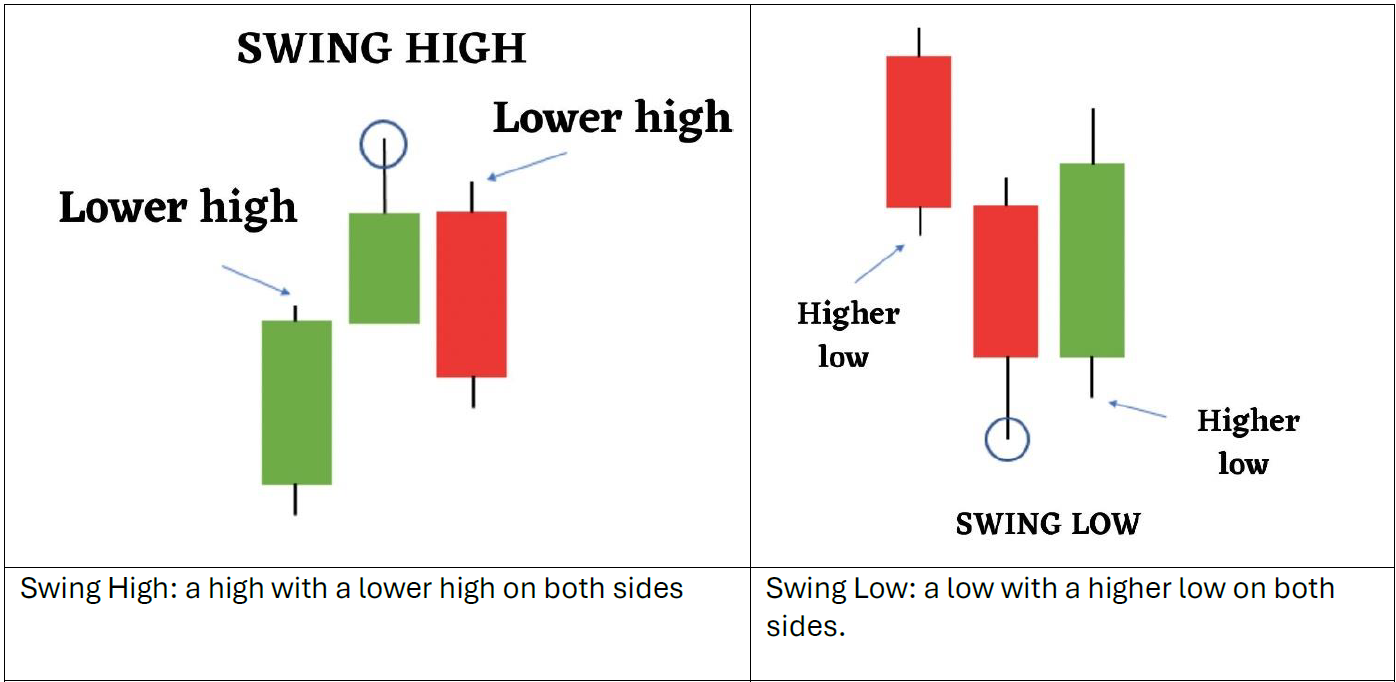
Take note: wicks identify the highs and lows, not the body of the candle.
This matters because a swing's level is set by the wick, but a break of that swing is decided by the body. We'll get to that in a moment.
External vs. Internal Structure
This is one of the most useful framings to have in your head:
External Structure — the overall trend visible on a higher timeframe (relative to a lower timeframe). A weekly chart is made up of seven daily candles; compared to the daily, the weekly is external structure.
Internal Structure — the smaller movements within the higher timeframe, seen on lower timeframes. Shows smaller trends inside the larger move.
Internal structure can shift short-term without changing the external trend. Always let the external (HTF) structure guide your bias; internal structure offers early clues.
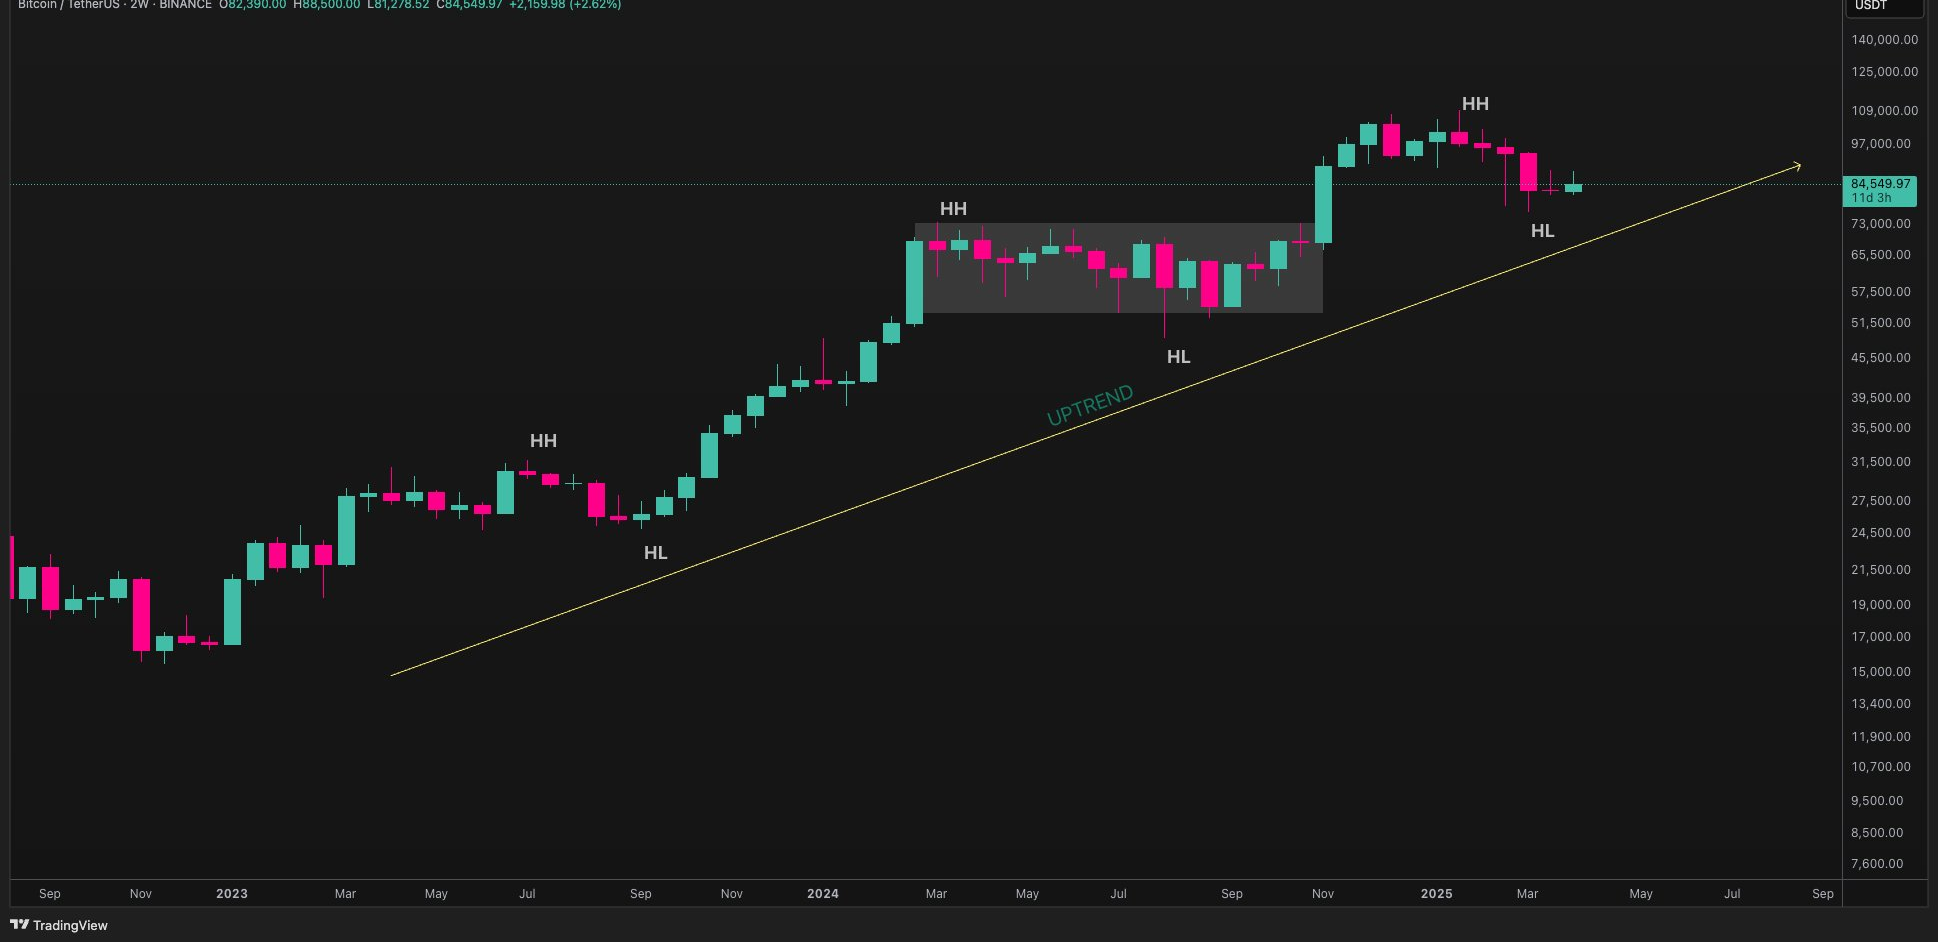
Example
This 2W chart is external structure and clearly in an uptrend.
On the daily chart of the grey box, we're in a downtrend. That's internal structure.
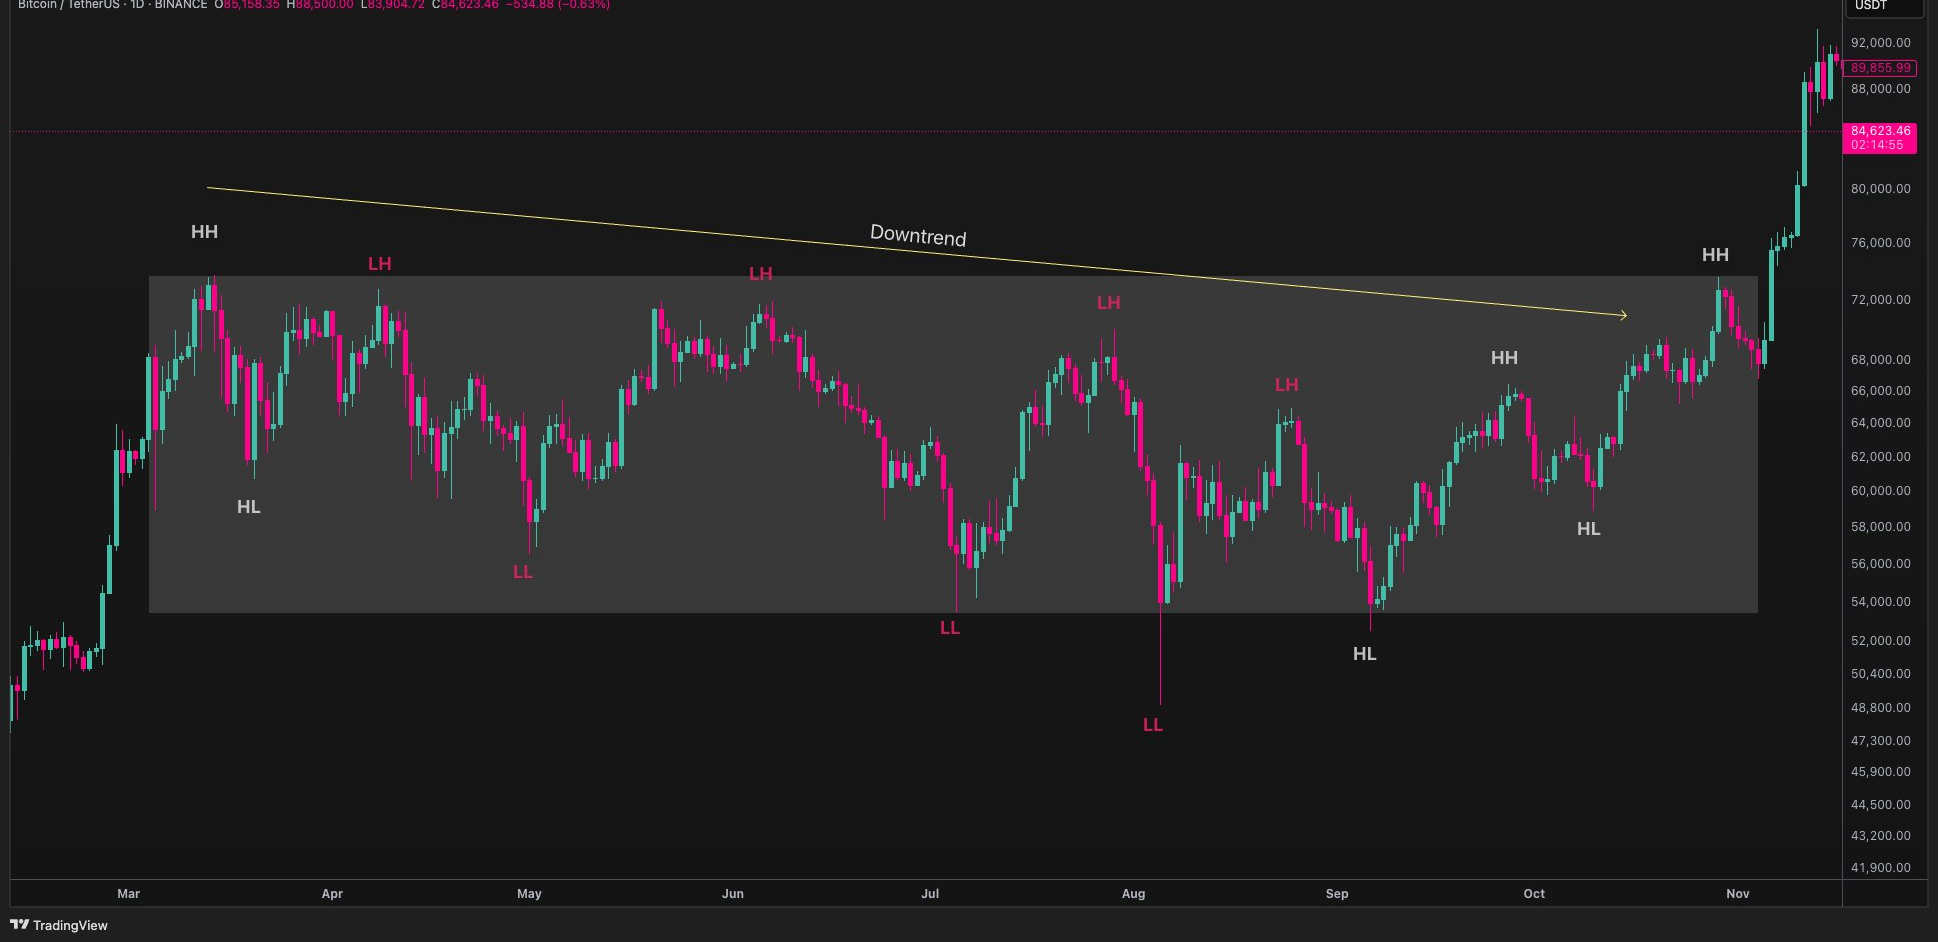
The takeaway: always see structures in relation to each other.
M > W > D > H > m > s
Internal structure shifts can be the early clue that external structure may change. Let the higher timeframes define the macro structure, and watch the lower timeframes for early signs.
Drawing Valid Structure: The 222 Rule
This is a separate framework from the main approach, but it's useful for ranges and a simplified Wyckoff Method view. The primary strategies have priority, but you can layer this in where it adds clarity.
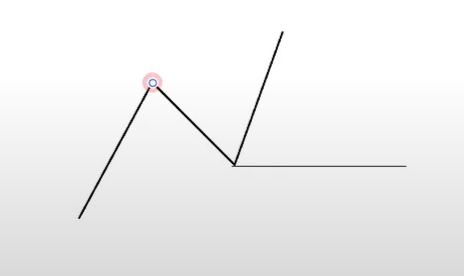
Markets never move in straight lines. Even in uptrends, there are sell-offs (retracements). In downtrends, there are rallies. These fluctuations form pivot points and zigzag patterns — that back-and-forth is what defines structure.
The 222 Rule
To define valid market structure, you need 2 + 2 + 2 consecutive candles in the right pattern.
- Uptrend: 2 consecutive bullish closes (each higher than the last) → 2 consecutive bearish closes (each lower) → 2 bullish closes again (each higher).
- Downtrend: 2 consecutive bearish closes (each lower) → 2 bullish closes (retracement) → 2 bearish closes again (each lower).
Inside Bars Don't Count
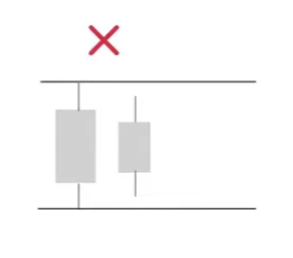
An inside bar is a candle whose high and low are inside the previous candle's range. These invalidate a pair for the 222 rule, regardless of color. Two bullish candles back to back, but one is an inside bar? Doesn't count. It also doesn't matter whether the inside bar is the second or first candle of the pair.
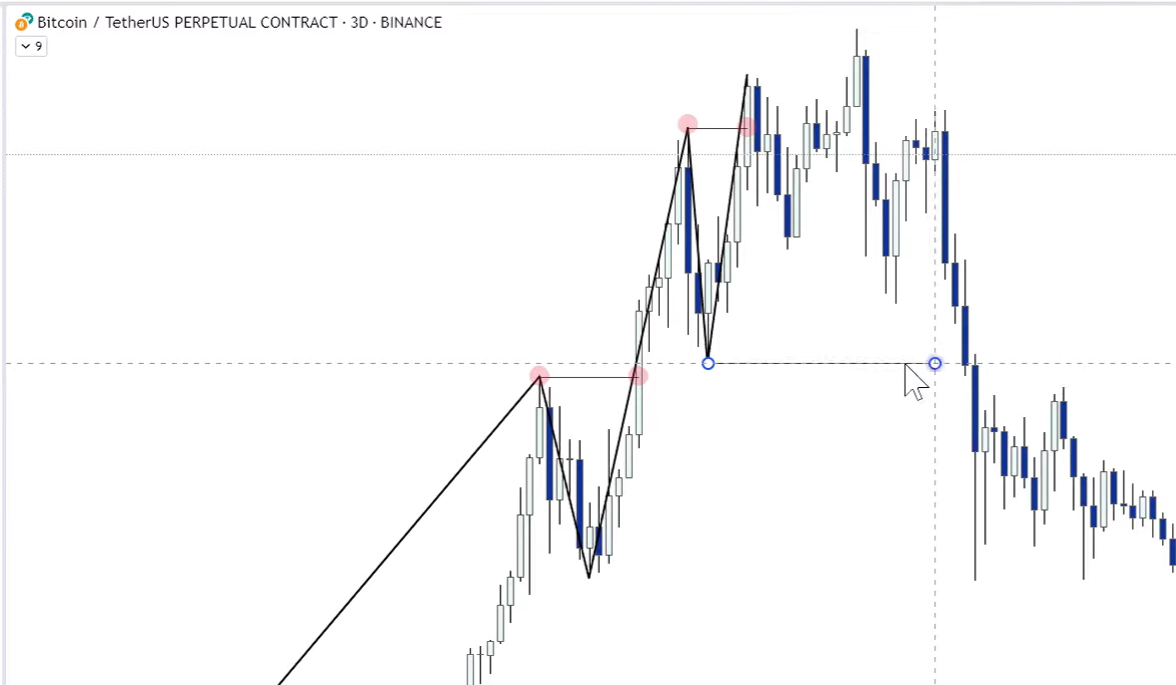
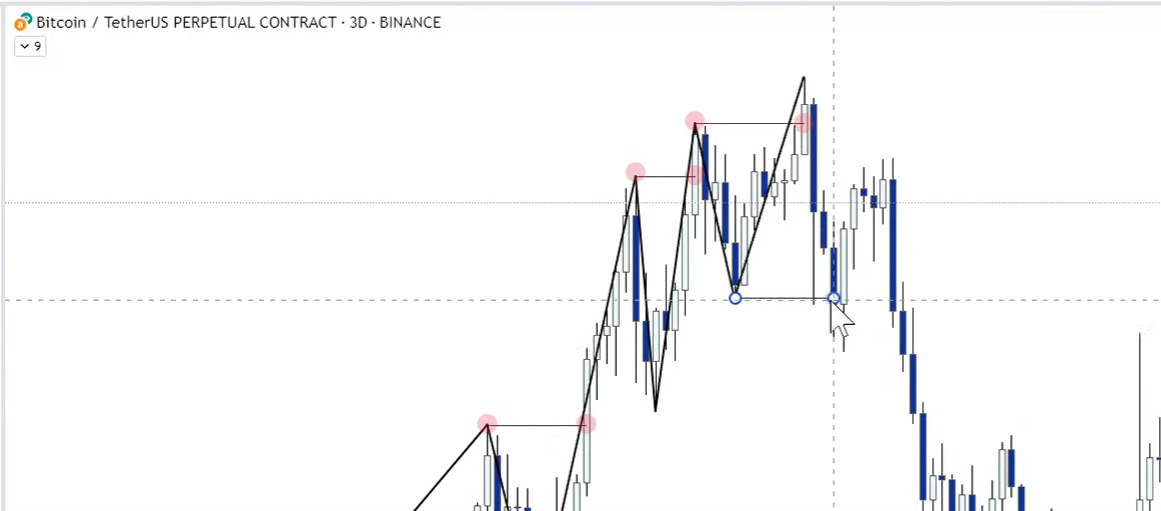
Confirming MSH and MSL
In an uptrend:
A Market Structure Low (MSL) is confirmed only after price touches the Market Structure High (MSH). To identify the MSL: find the lowest point between the creation of the MSH and the later touch of it. Until the new high is retested, the low is not valid (you don't need a close, just a touch).
In a downtrend:
A Market Structure High (MSH) is confirmed only after price touches the Market Structure Low. To identify the MSH: find the highest point between the creation of the MSL and the later touch of it. Until the new low is retested, the high is not valid.
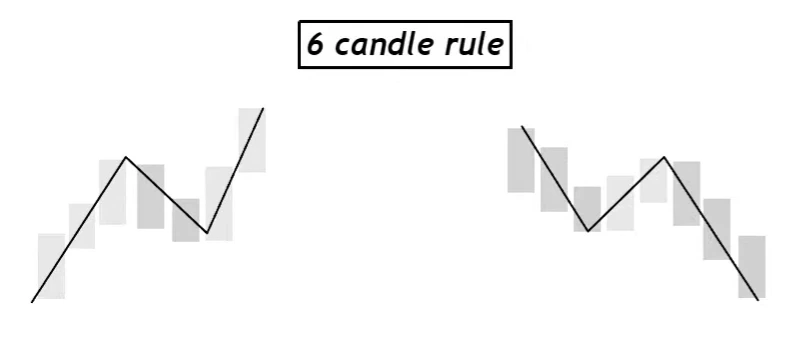
These confirmations also follow the six-candle rule.
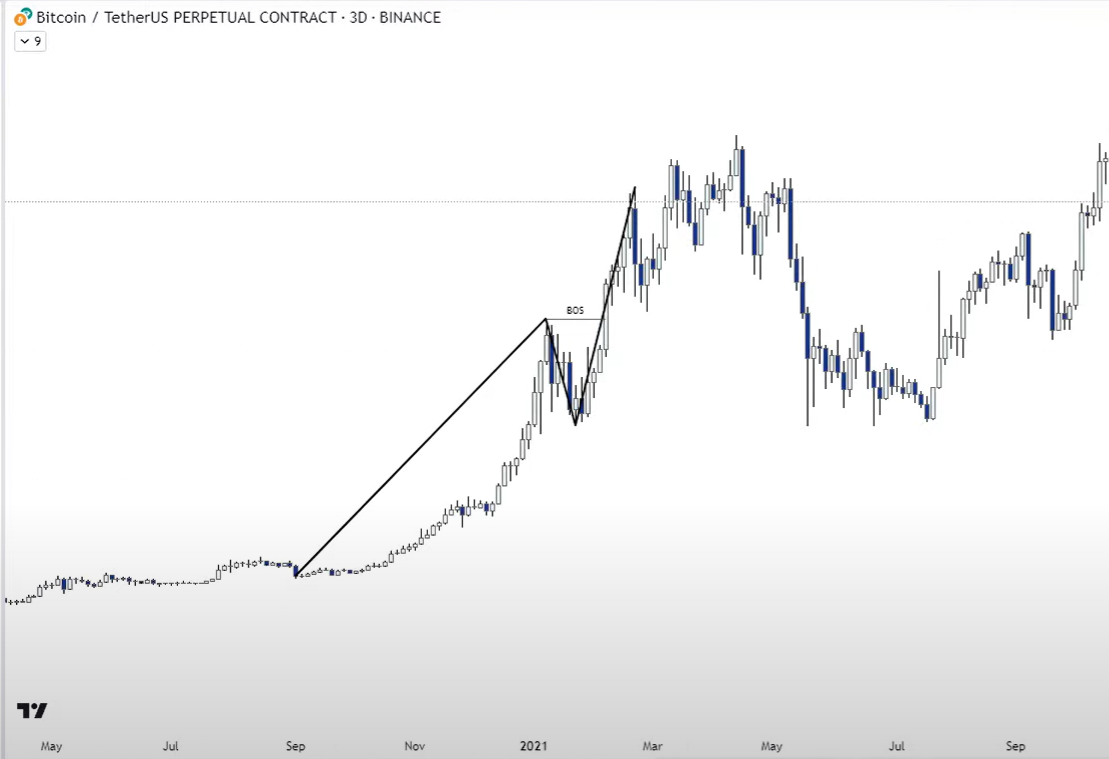
Working a Real Chart
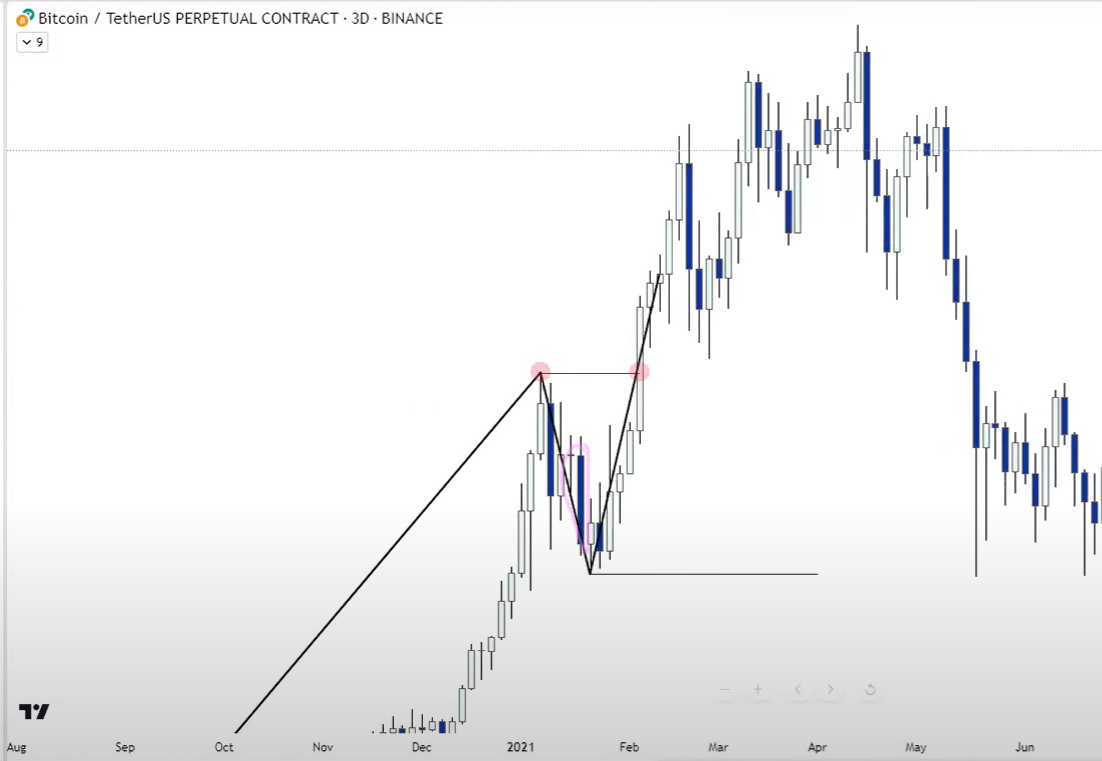
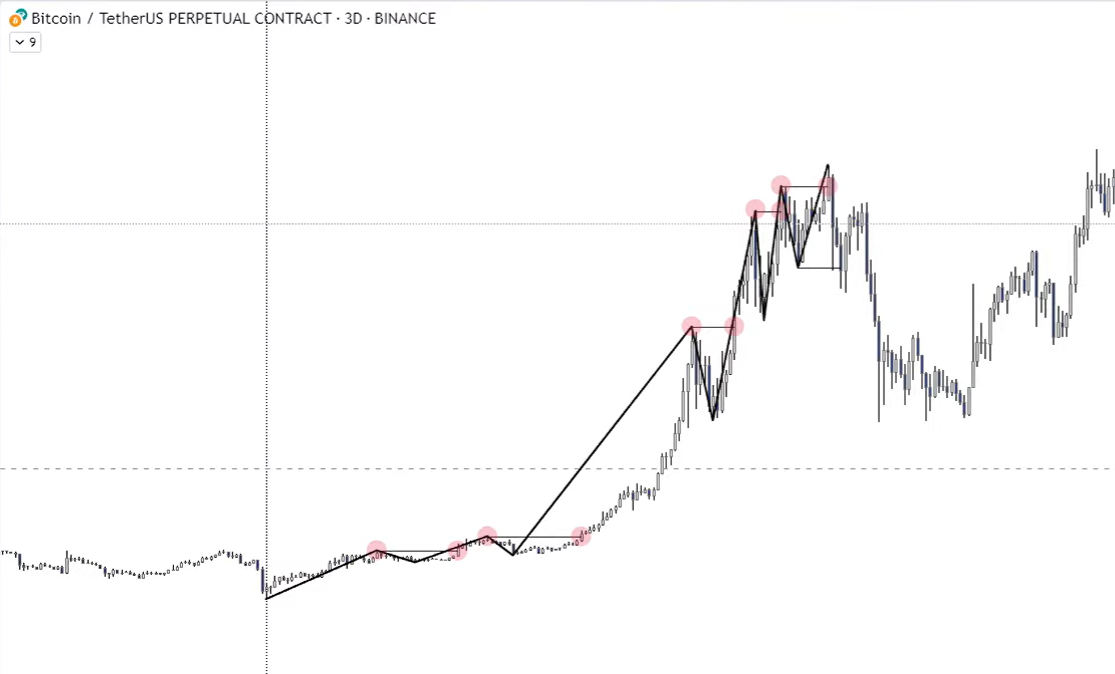
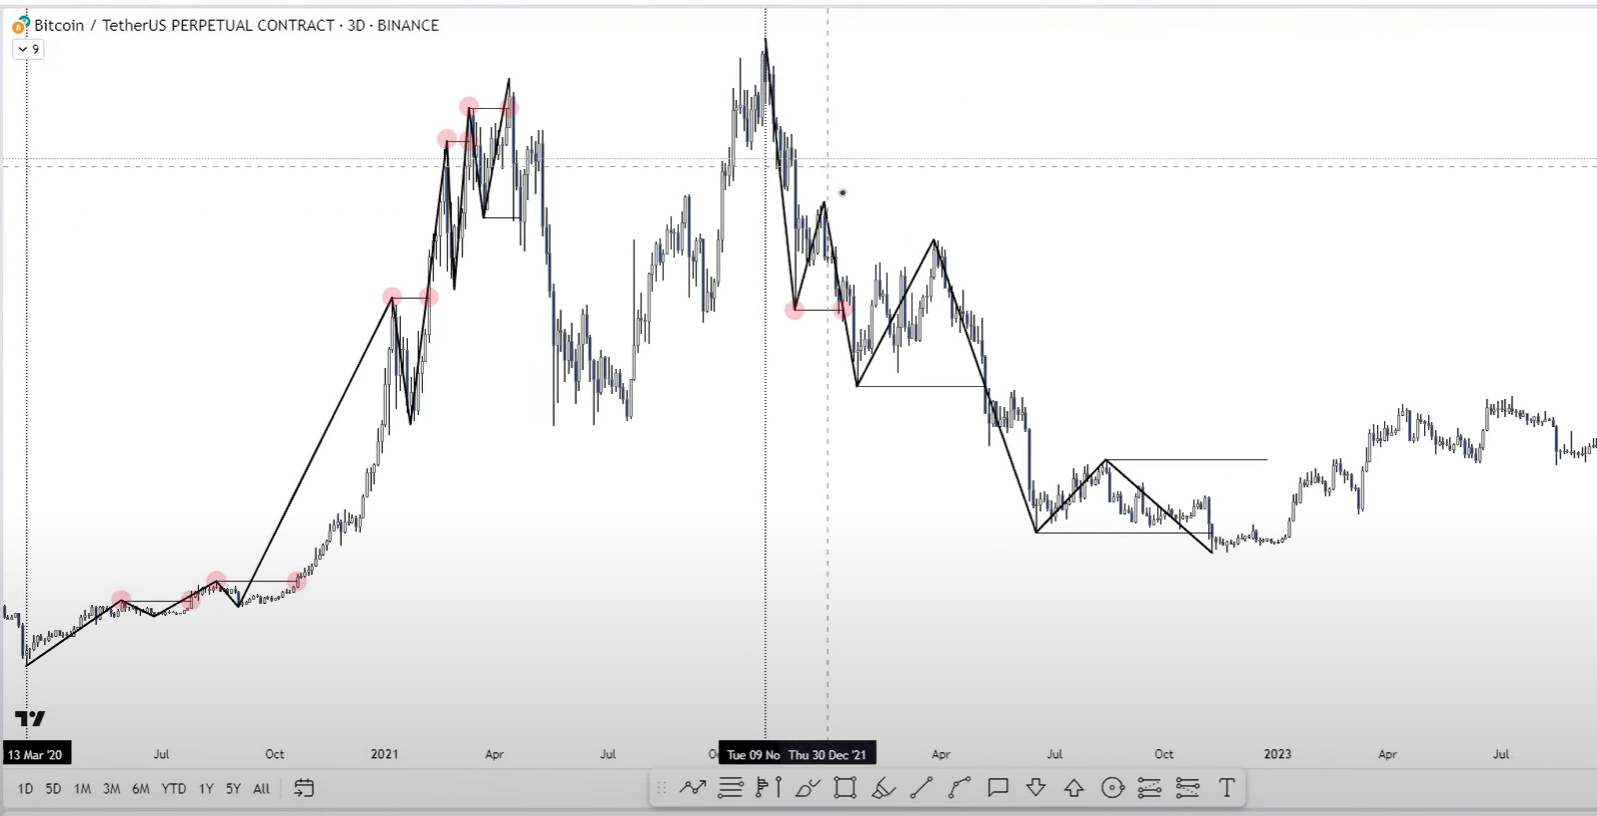
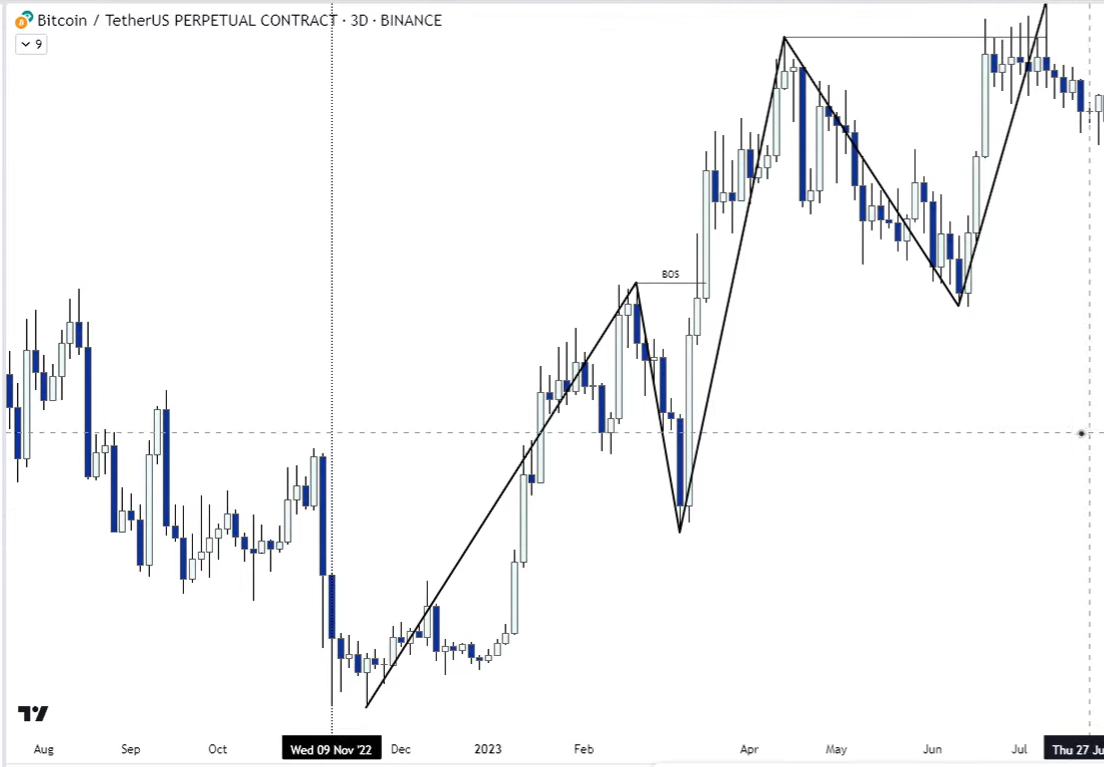
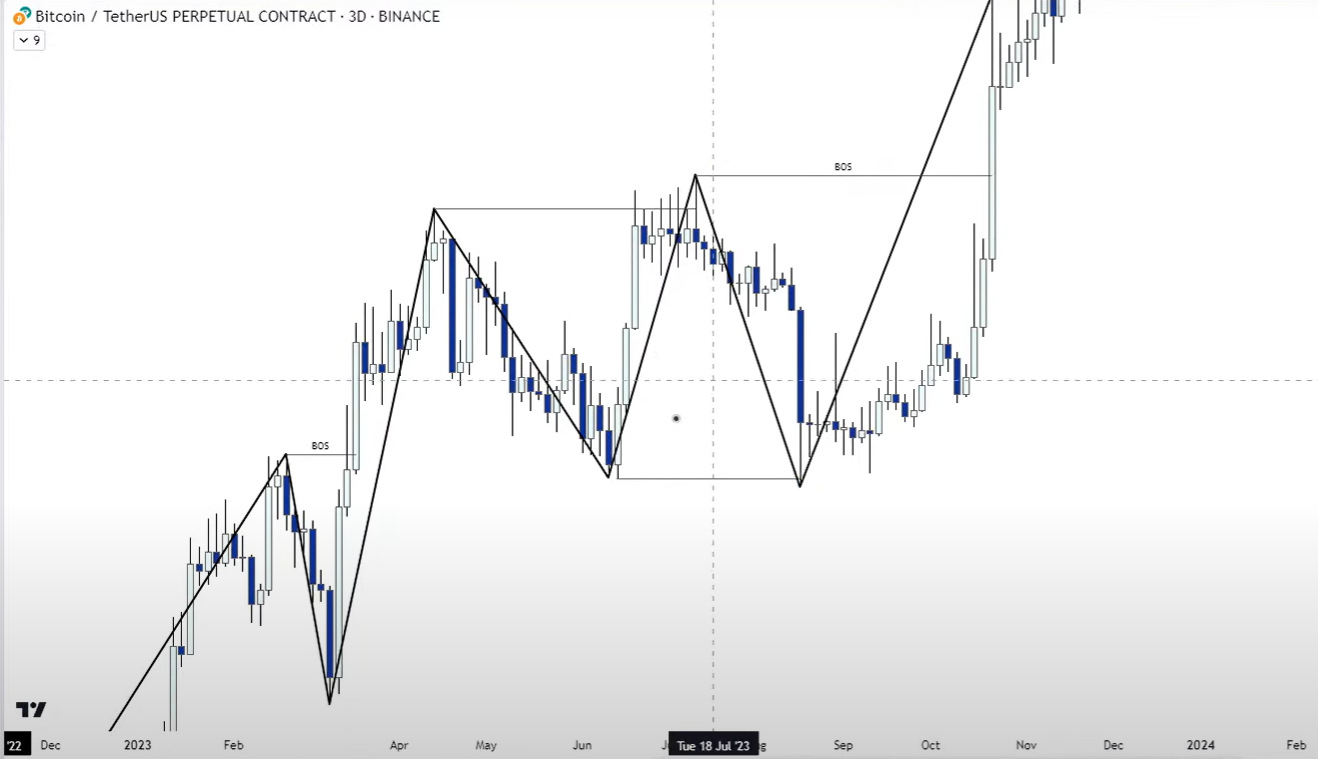
Bitcoin from the COVID low to the $65k top:
You identify every valid uptrend structure by finding valid 222 patterns, remembering inside bars don't count, and waiting for price to touch the structure high to confirm the low. Then you continuously update MSH/MSL using retracements and expansions.
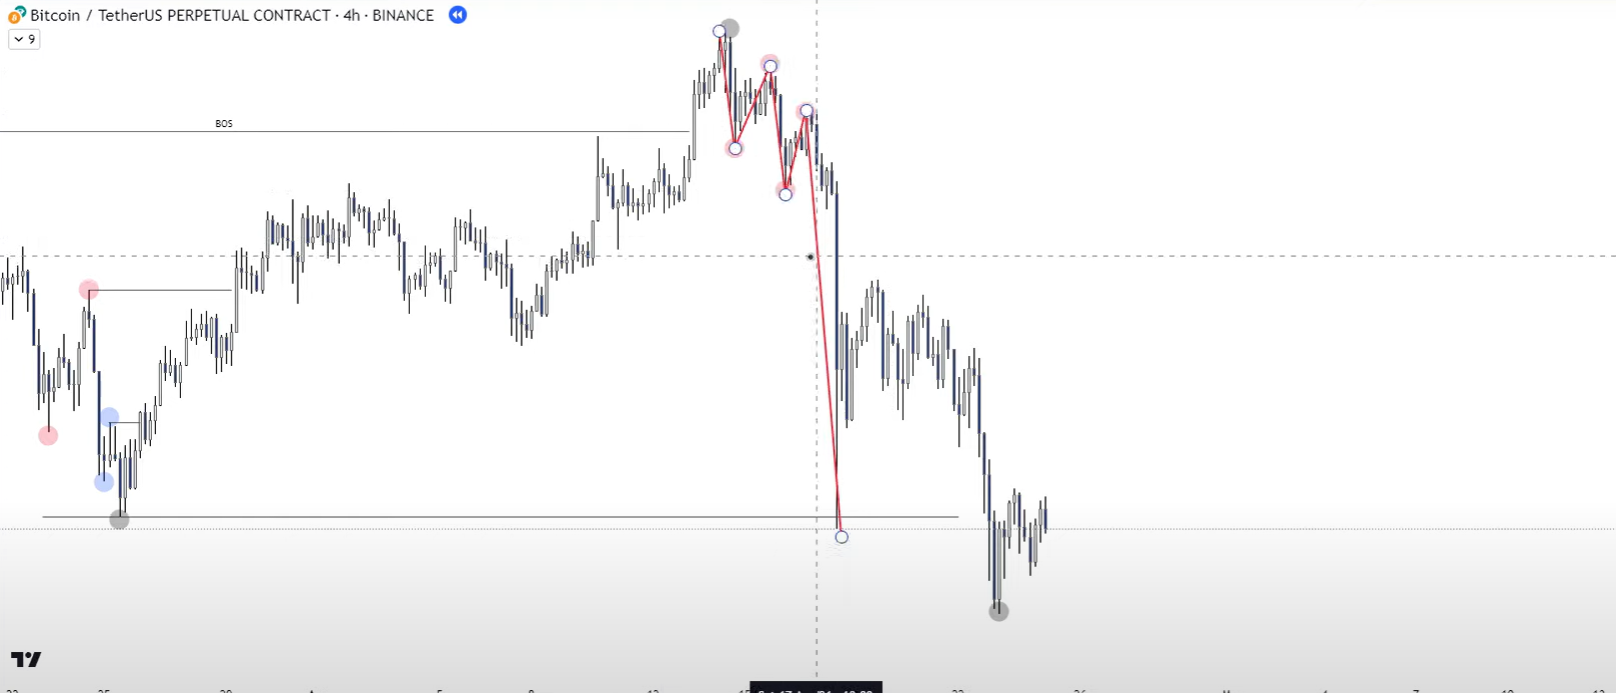
The same logic, in reverse, applies to the bear market from the $65k top:
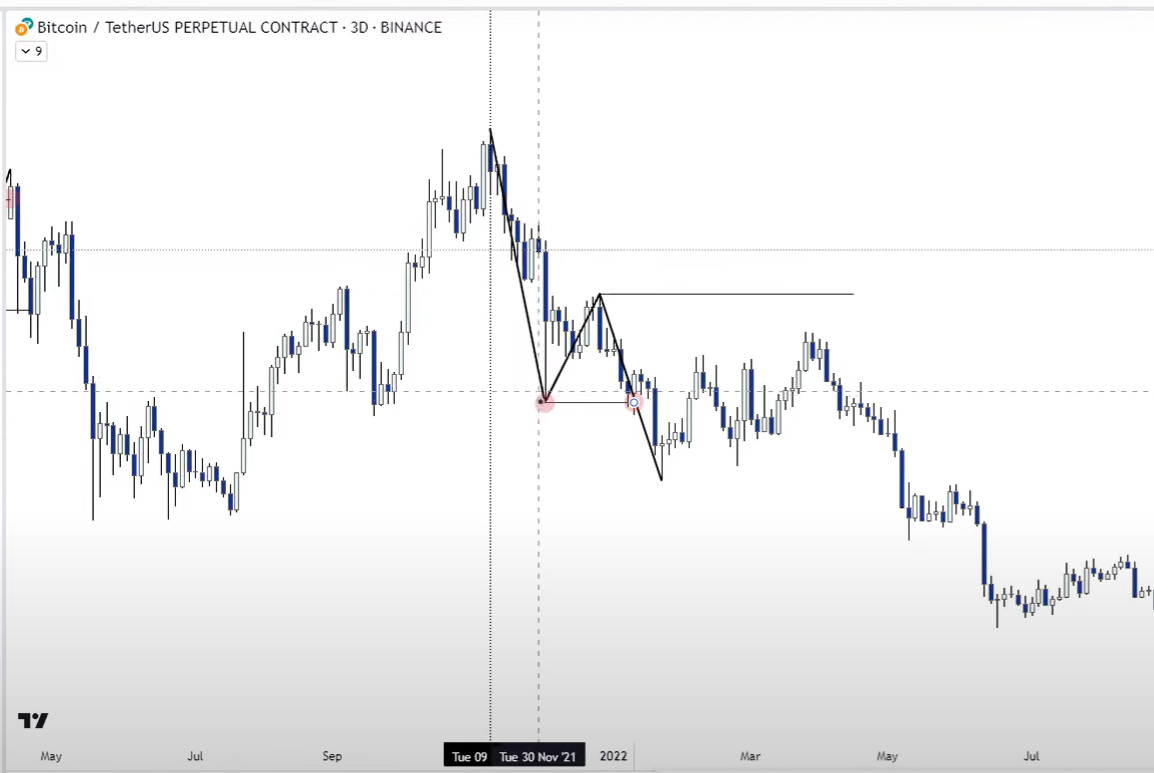
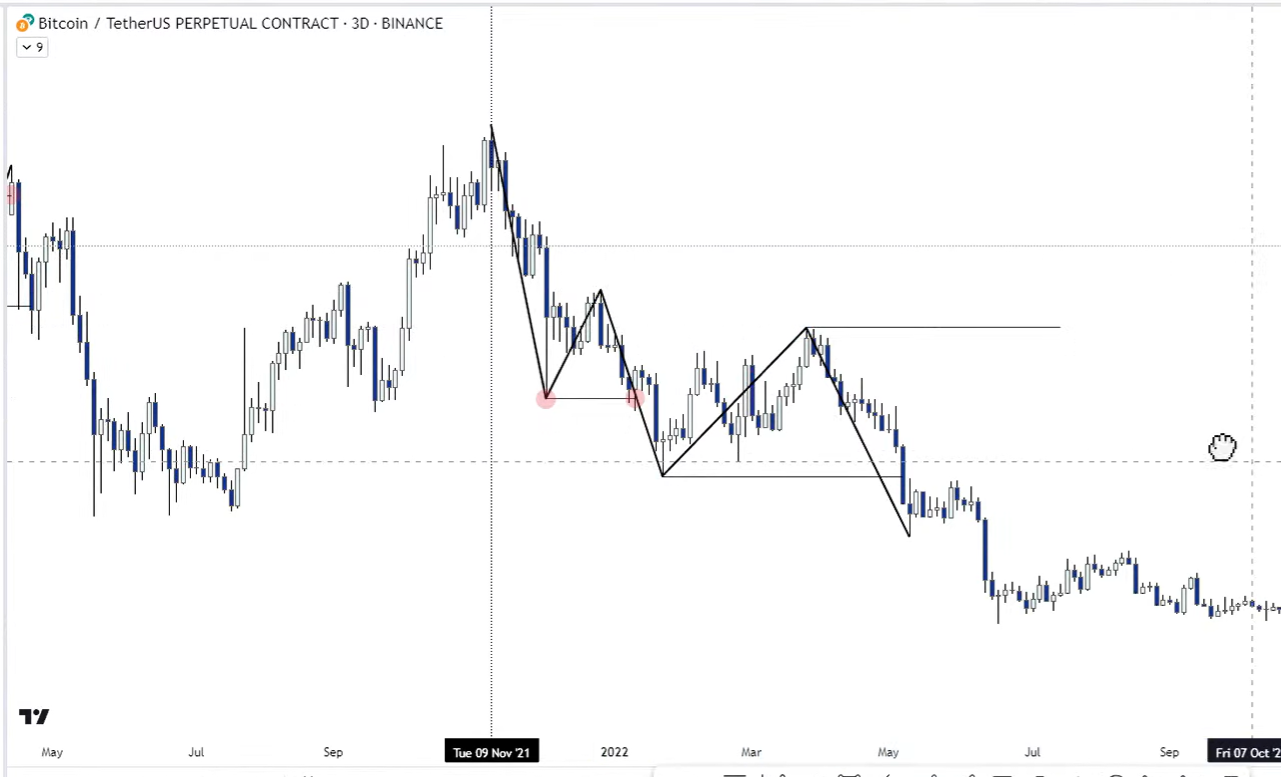
Here's a retracement that isn't valid:
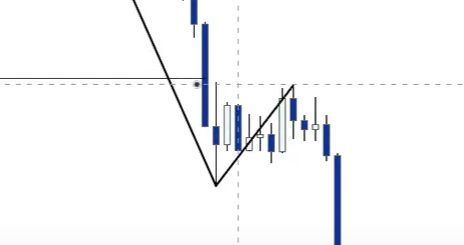
They may be consecutive bull candles, but one is an inside candle.
It's crucial that you draw your structure properly and know exactly when something becomes your MSH or MSL — otherwise you're going to get trapped into any fake break of structure.
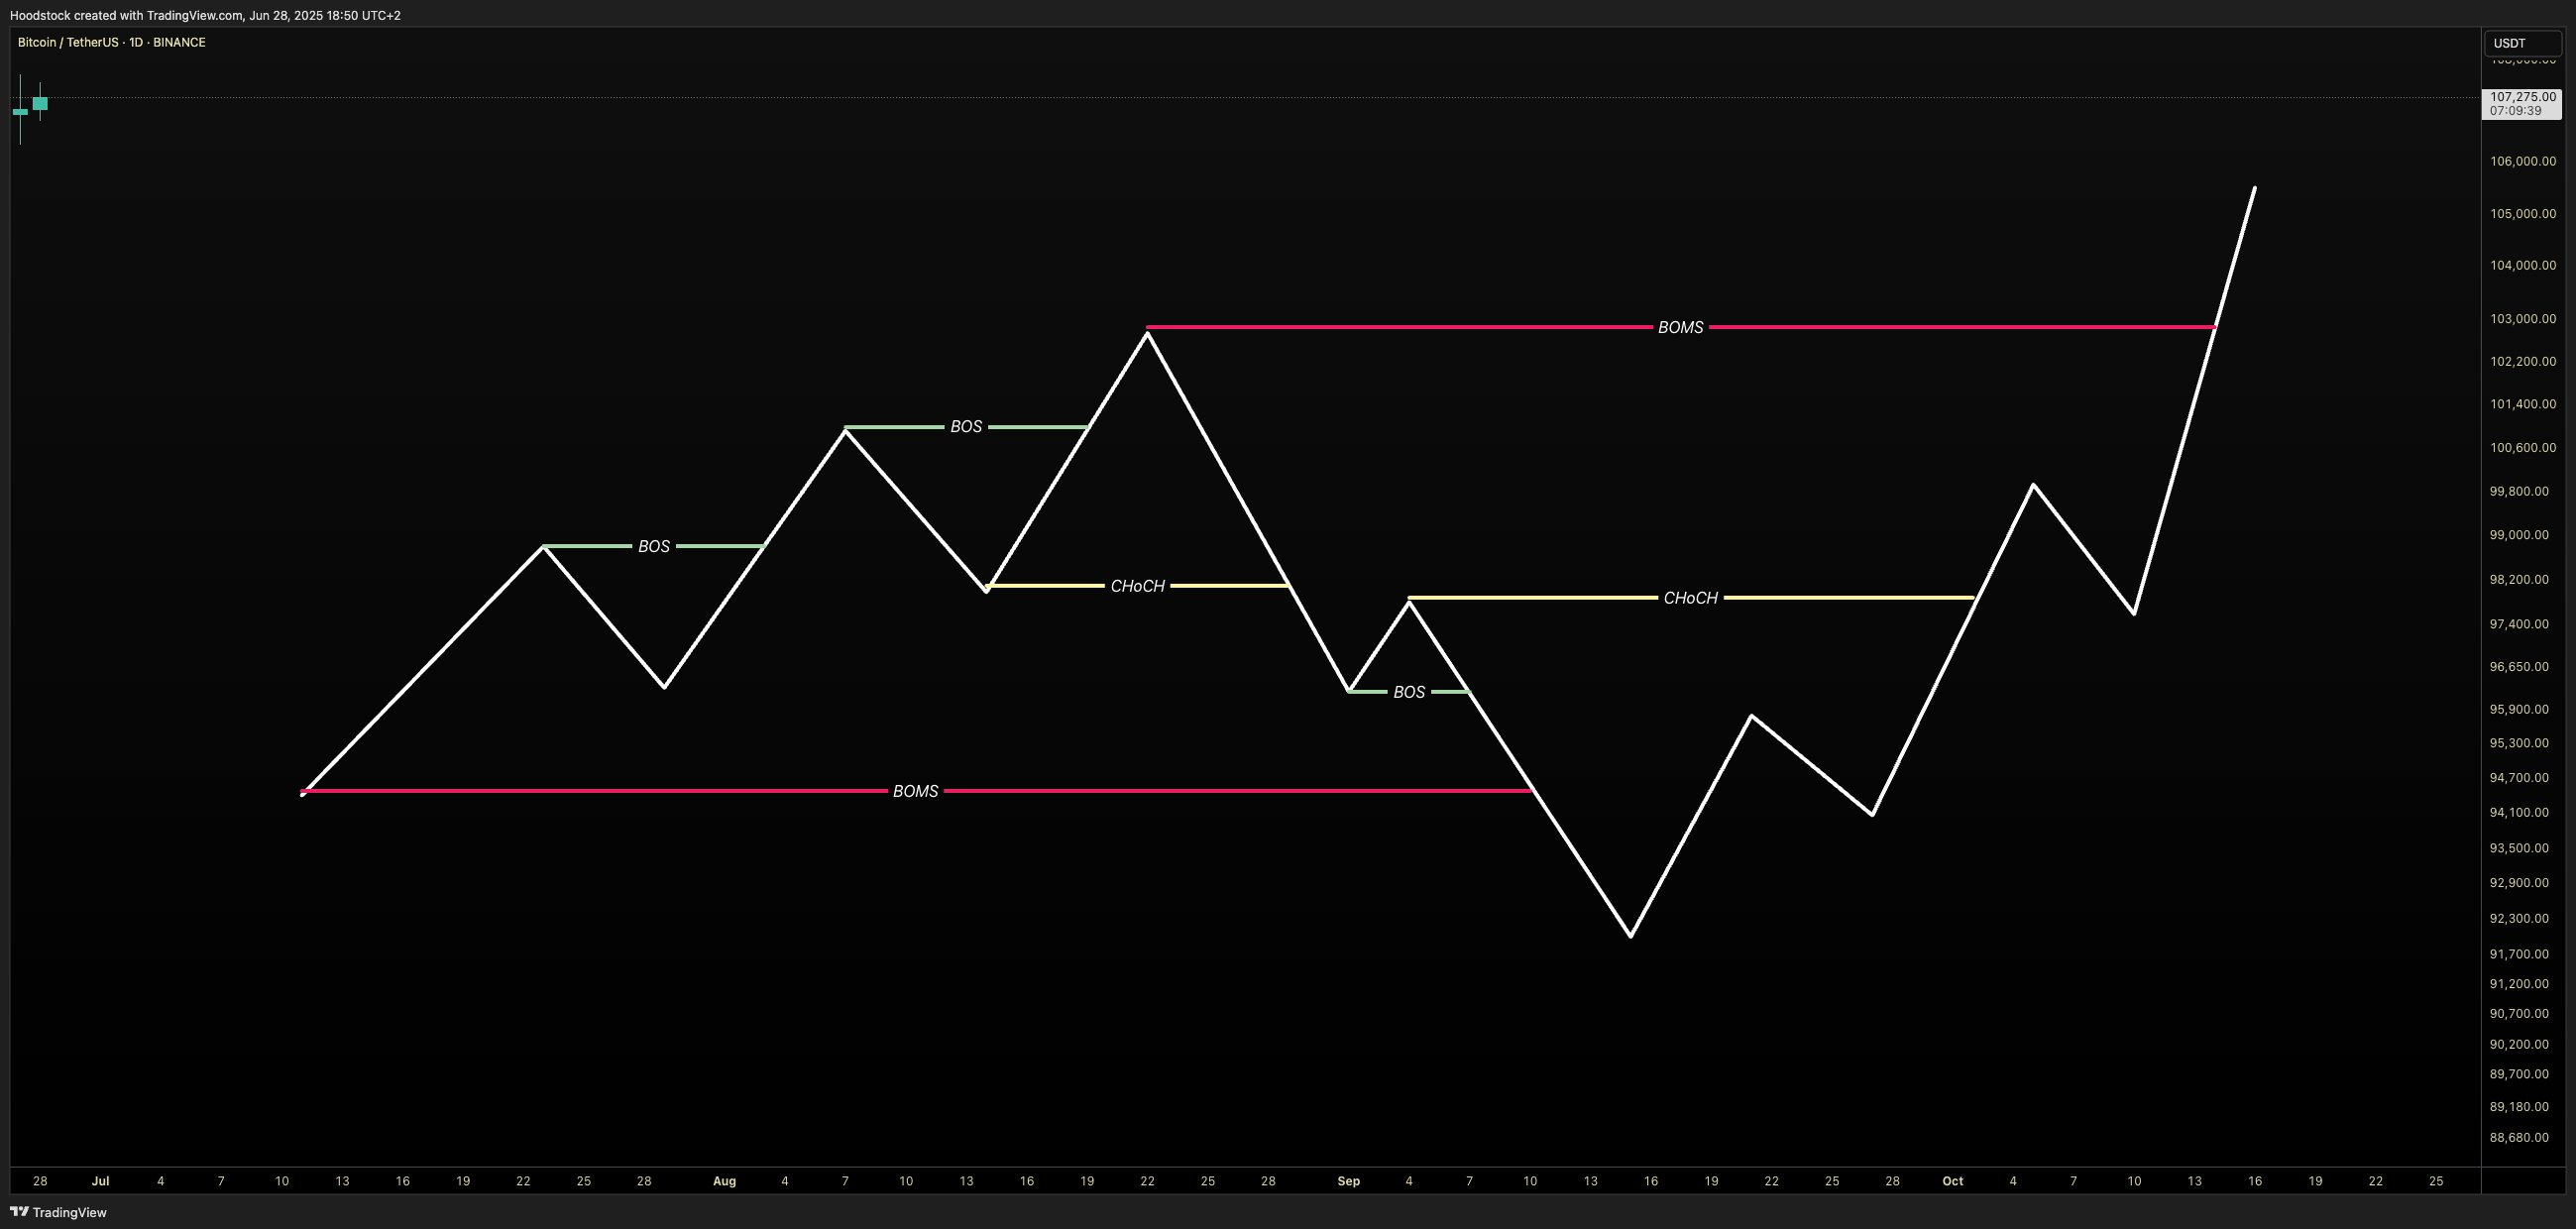
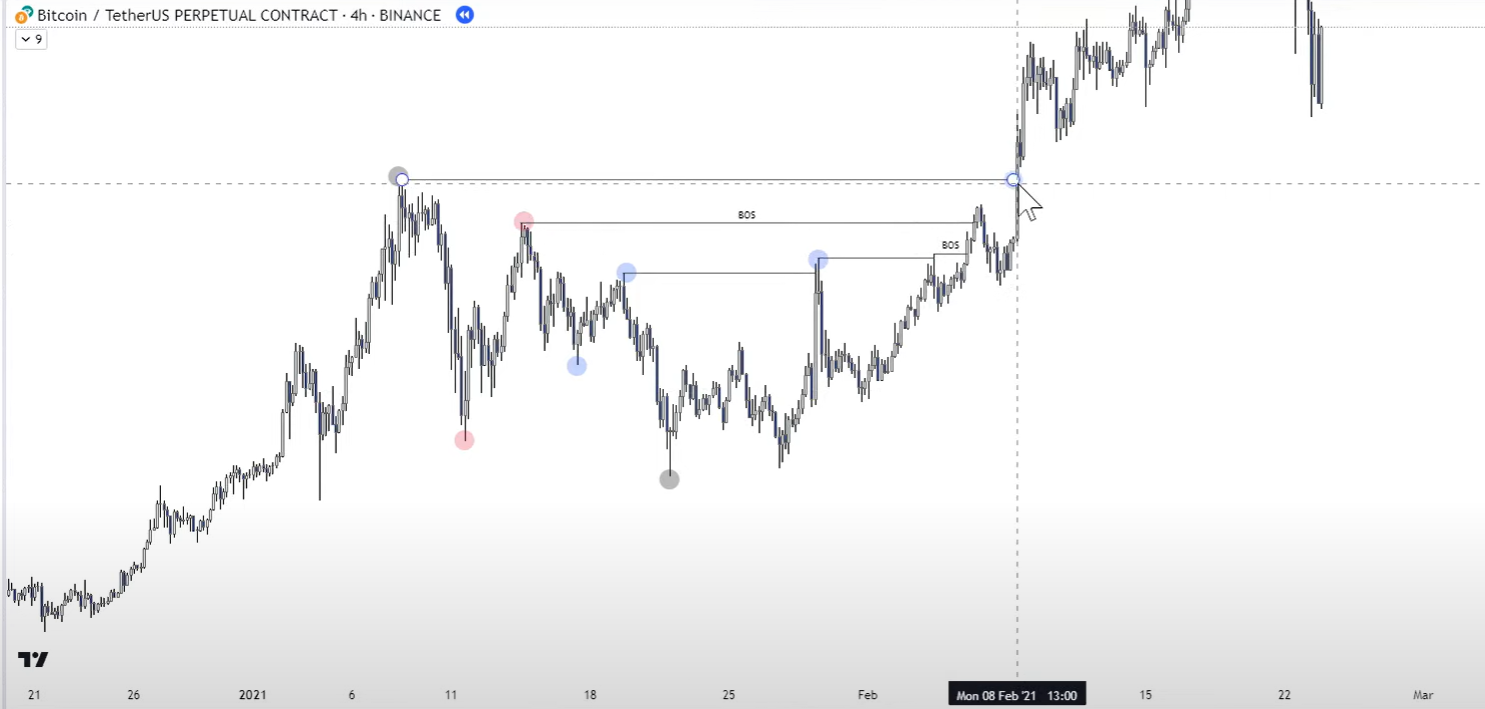
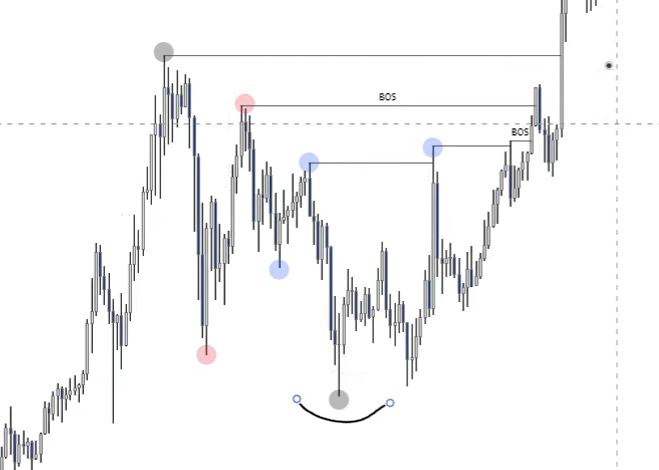
Break of Structure (BOS)
A Break of Structure occurs when price closes relevant candle bodies past a Market Structure High or Low. It confirms a change in structure.
The full mechanics — BOS, CHoCH, BOMS — are covered in Break Of Structure & Change Of Character and 🔷Break of Structure. Here's the foundational view:
BOS — Break of Structure. Price closes past a significant high or low. CHoCH — Change of Character. Price breaks structure in the opposite direction of the current trend. First signal of a possible reversal. BOMS — Break of Market Structure. A clear break, usually on higher timeframes and significant levels. Often shows higher volume and leaves FVGs behind.
Four Types of BOS
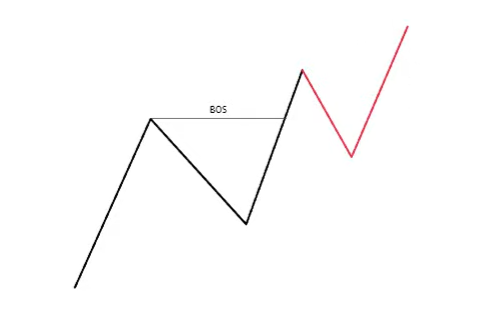
-
Bullish BoS in uptrend — close above MSH → expect higher low for a higher high.
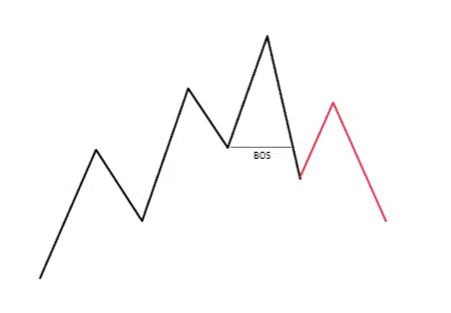
-
Bearish BoS in uptrend — close below MSL → expect lower high for a lower low (trend shift).
-
Bearish BoS in downtrend — close below MSL → trend continuation.
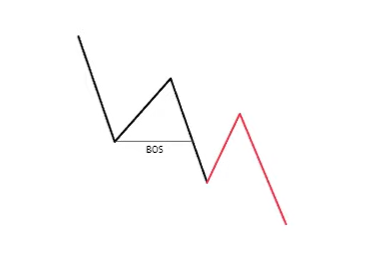
-
Bullish BoS in downtrend — close above MSH → expect higher low for a higher high (trend reversal).
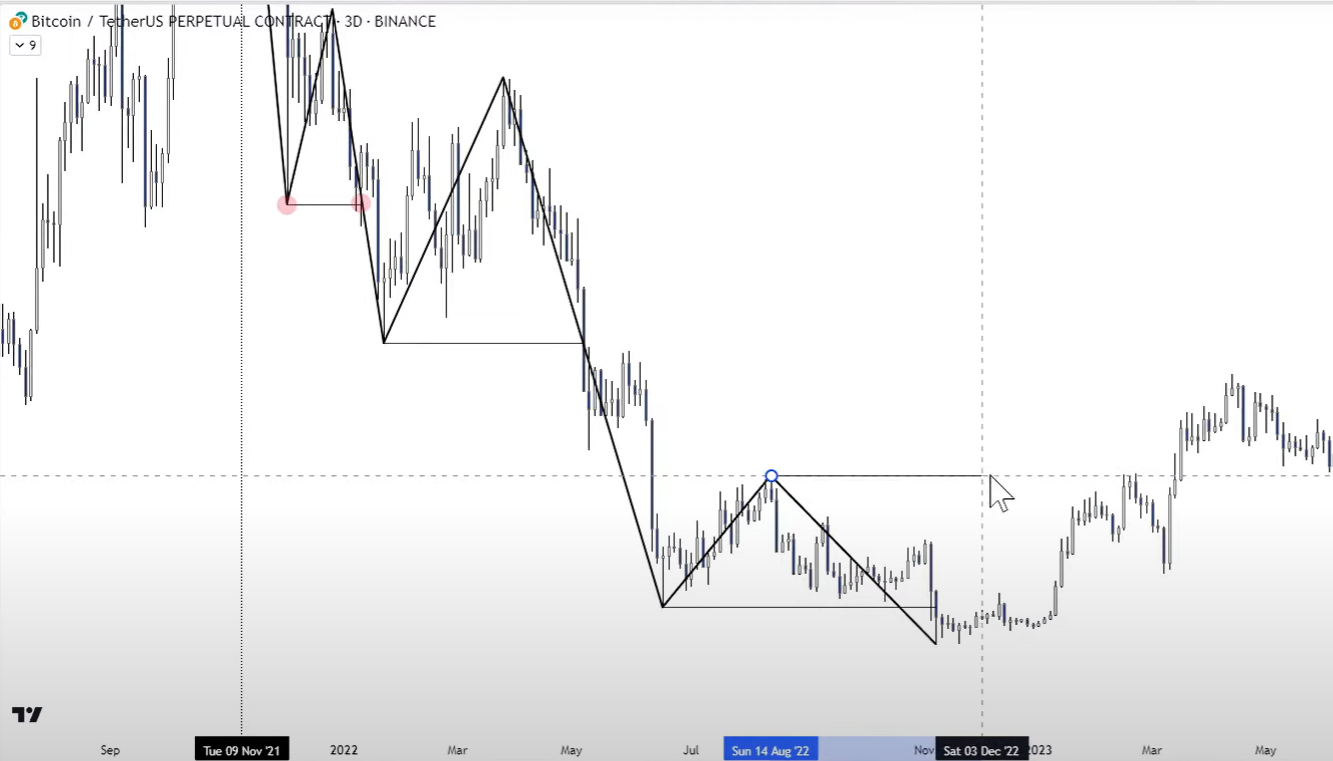
Examples:
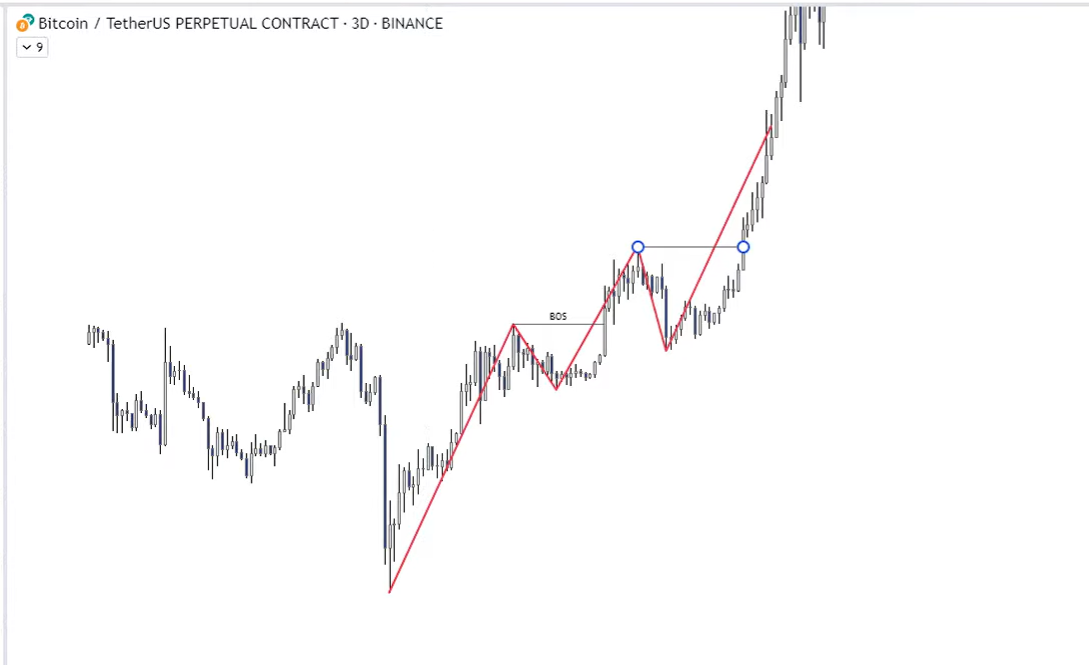
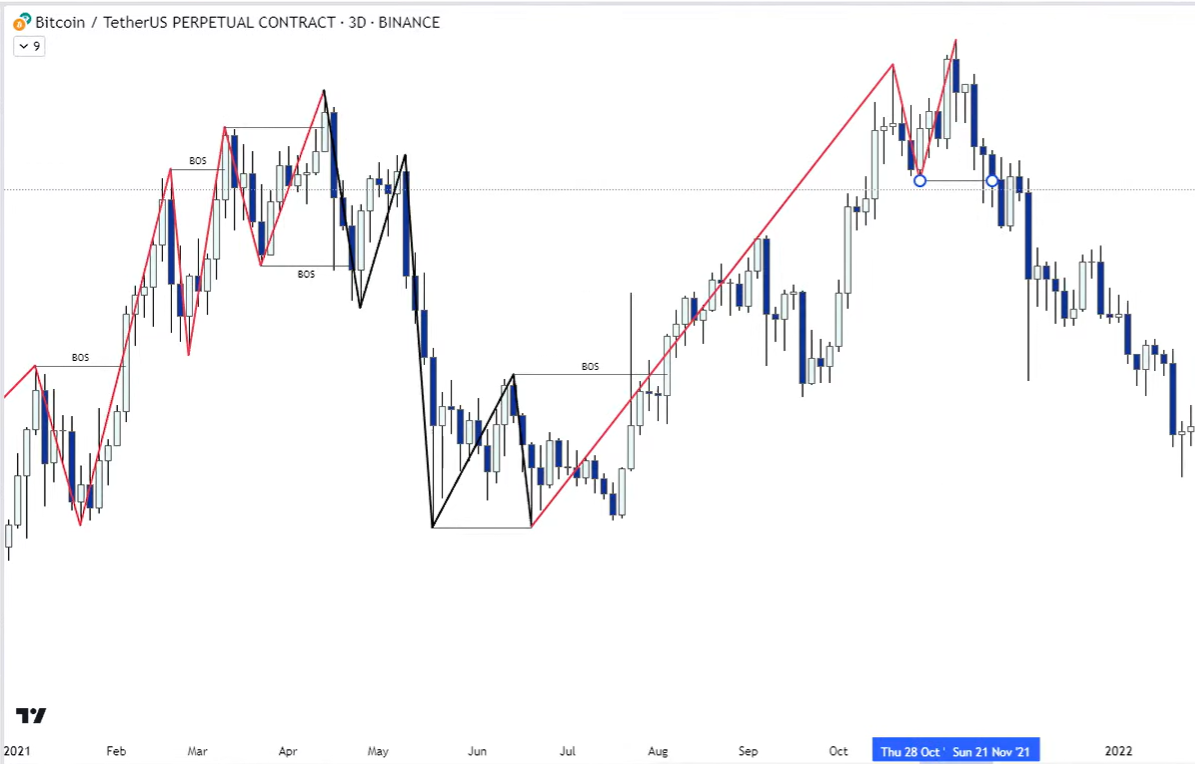
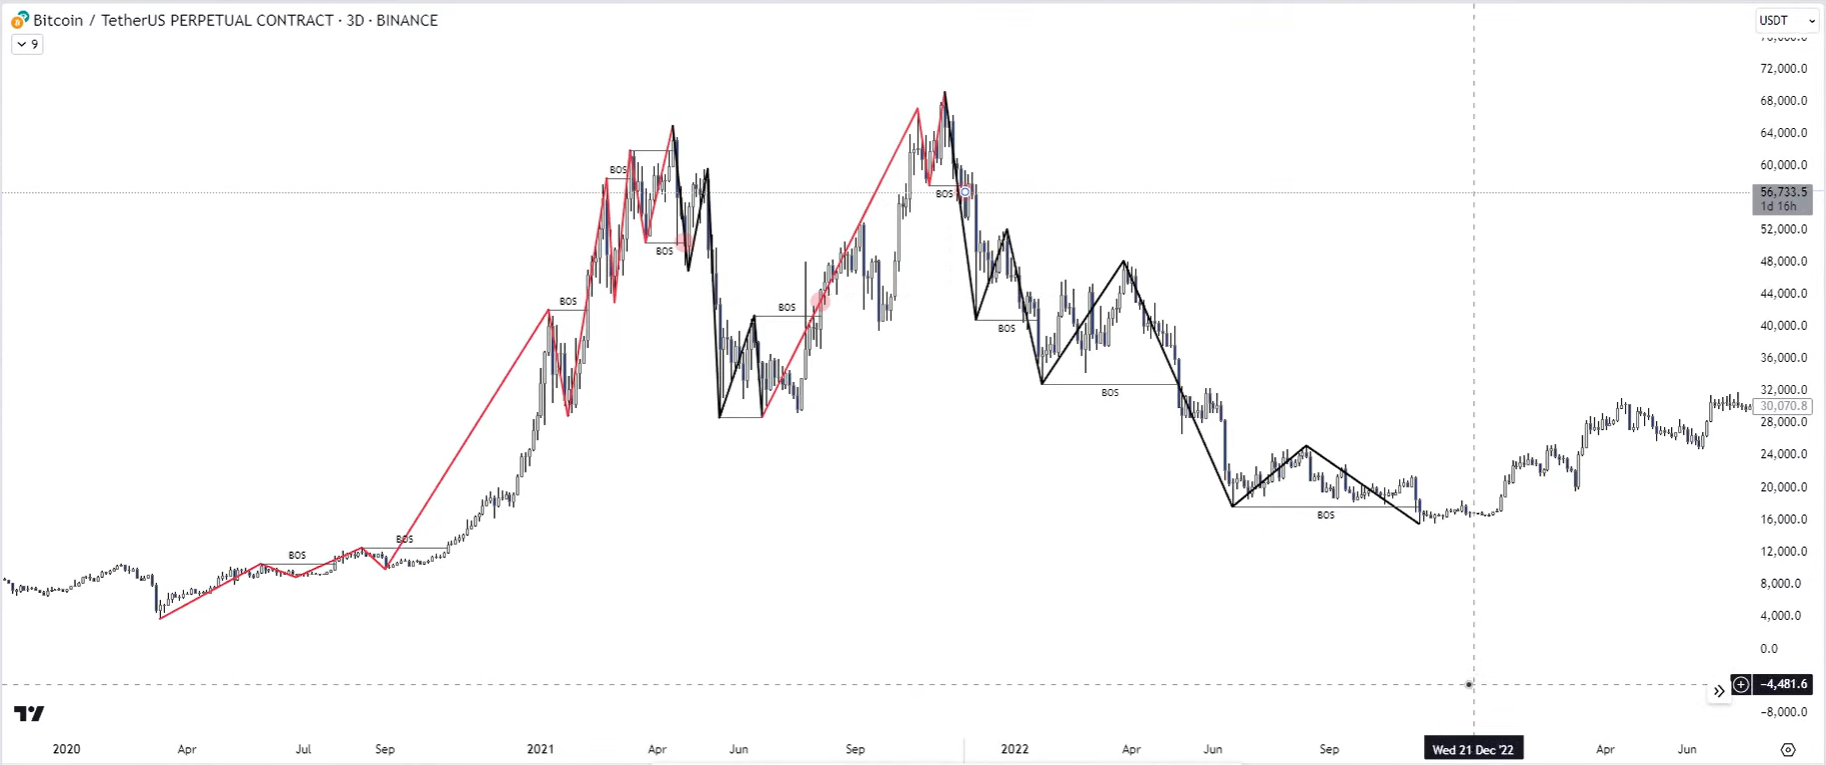
You could have literally traded the entire previous cycle by understanding market structure. If you understood the uptrend and saw it change in April 2021, you could have sold. When it broke back to bullish, you could have bought. The moment it broke back to bearish, you sold again. Apply this on the higher timeframe and you can absolutely nail an entire cycle.
This applies on all timeframes.
If the structure leading to the BoS is invalid (inside bars, missing candles), the BoS is also invalid.
Good vs. Bad Breaks
Good Break:
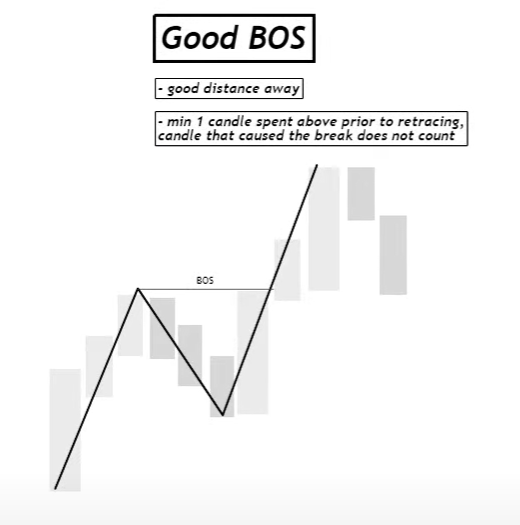
- Strong distance from the structure high/low
- Minimum 1 full candle close beyond the level
- Clear continuation before retracement
Bad Break:
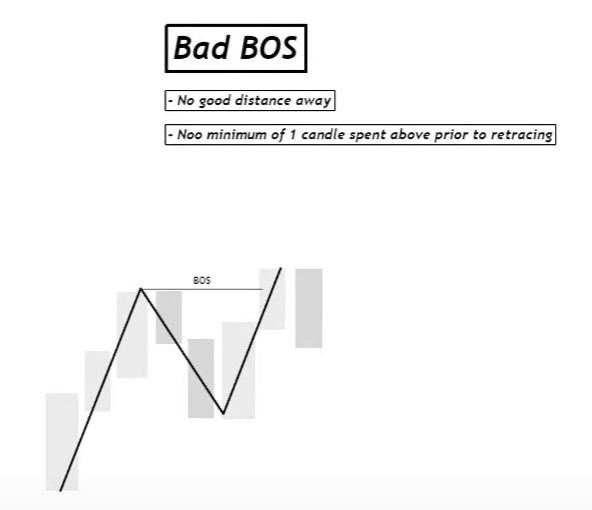
- Weak distance beyond structure
- Candle immediately closes back below
- High risk of fakeout
- Be cautious calling a higher low or lower high after a bad break
Good breaks lead to strong trends; bad breaks often reverse.
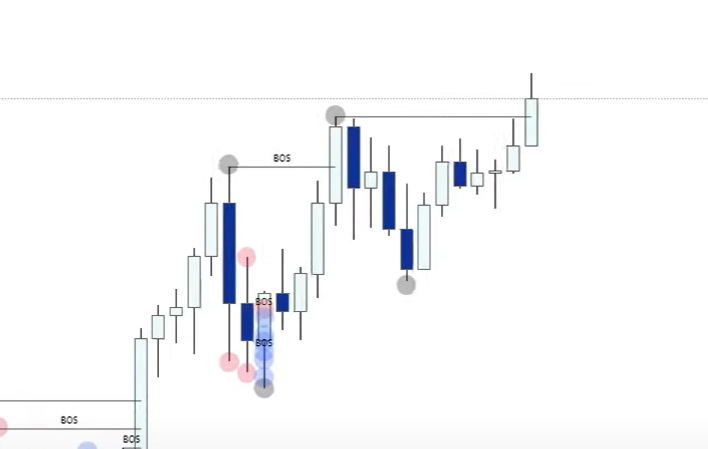
Good BOS:
Bad BOS back to back:
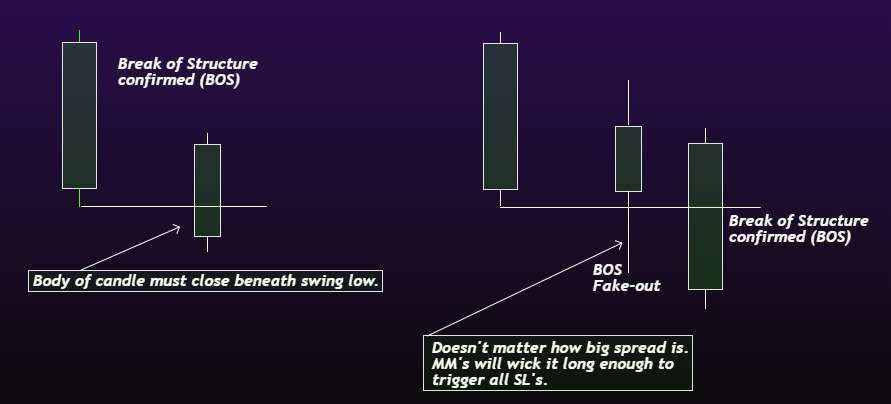
Body, Not Wick
"A wick doesn't confirm it broke. It's a false break. A body does. Bodies hold institutional trading volume. Wicks can hold no liquidity on them"
Candle closes show you whether your support/resistance level or key liquidity area is broken. If broken, wait for a pullback into a key area — Breakout, Retest, Resumption. Enter on retest. If your key liquidity is broken, move on and find another opportunity. See CONFIRMATION Tips and Confirmation.
Don't chase price action. Let it come to you. ⚠️ Never Chase.
Always watch for body closes above or below the swing high or swing low.

Without a confirmed BOS, you risk falling for fake moves. A confirmed BOS marks clearer intent. Wait for the signal, place orders where the fuel sits, ride the continuation.
🔺Lately, more HTF closes have resulted in reversals. Market makers know retail watches daily closes.
"Don't fall for false moves. Learn to identify confirmed BOS on HTF and you will level up instantly."
There's no single timeframe that automatically invalidates every setup. The last five minutes of a HTF candle can close below a level without any real prior PA in that area. Zoom in on lower timeframes and check what's happening. Look for signs of strength or weakness. Stay flexible.
Things to weigh:
- How optimal is the level?
- Where is it located?
- Is the asset high volume?
- What are majors doing?
- How does price behave around the level?
- Are newly formed LTF structures being respected?
- Is there spoofing?
- What is order flow showing?
There are setups that call for 12H+ closes; others rely on 2H. This is closer to an art than a rule — an edge that only comes through screen time and real experience.
"You can go through timeframes up until 2H and you will notice there's no candle bodies closing below the level where the 2D BB is at. The hint is there. From here I'll wait for key SH or SL to be taken and find an entry on pullback or retracement. 0 candle bodies closed below 2D BB. Body, not whisker."
Wicks vs. Break of Structure (Swing Failure)
A wick happens when price touches but fails to close beyond a Market Structure High or Low. Also called a Swing Failure Pattern (SFP).
A wick weakens the opposing structure point.
- In an uptrend: if the high is wicked but not closed above, the low becomes weak → possible retrace to MSL.
- In a downtrend: if the low is wicked but not closed below, the high becomes weak → possible retrace to MSH.
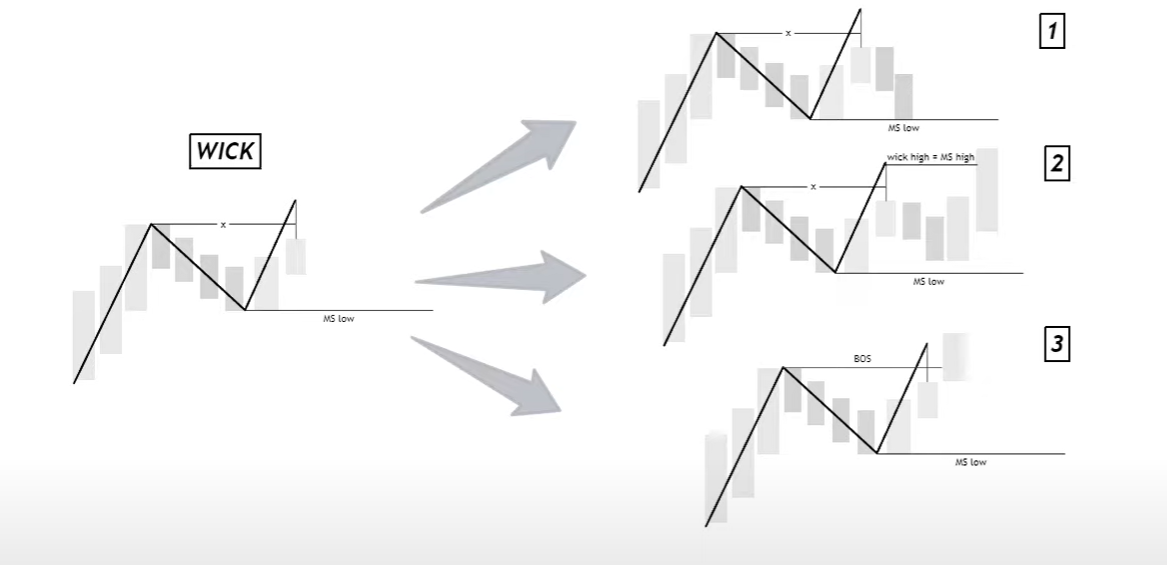
Three Wick Scenarios
-
Full Rotation — Wick the high → retrace all the way to the structure low. To get a full rotation down, you wick the high and most likely have bullish structure from the lows that breaks back to bearish on the mid-timeframe — that's when you get full rotation.
-
Reaction Only — Wick the high → slight pullback → create higher low → break above the wick high later. The new MSH becomes the wick high.
-
Immediate Break — First candle wicks → second candle closes above → becomes a valid BOS.
To predict which wick scenario you'll get, analyze the structure from the low to the high (mid-timeframe). If that breaks bearish after the wick, expect full rotation down (Scenario 1). If it holds and the top-down structure breaks bullish, expect continuation (Scenario 2 or 3).
Immediate Break example:
A wick is not a break of structure. They're two very different things. A lot of people misuse wicks by calling them BOS. A wick actually makes the other structure point weak in nature.
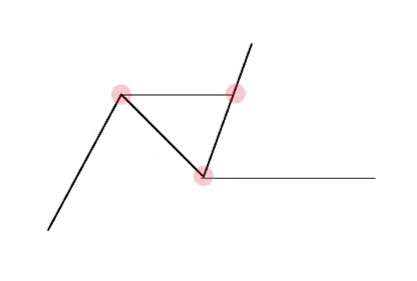
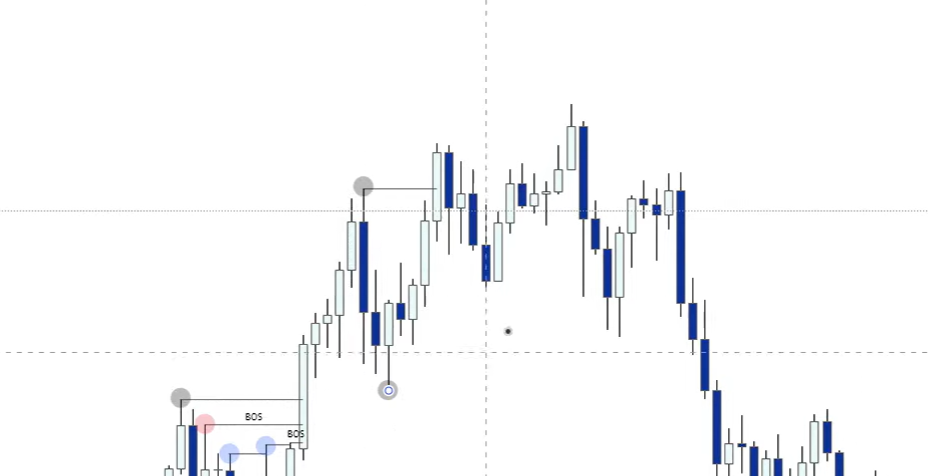
Overlapping Structures and the Domino Effect
Markets don't move linearly. Different timeframes have nested structures.
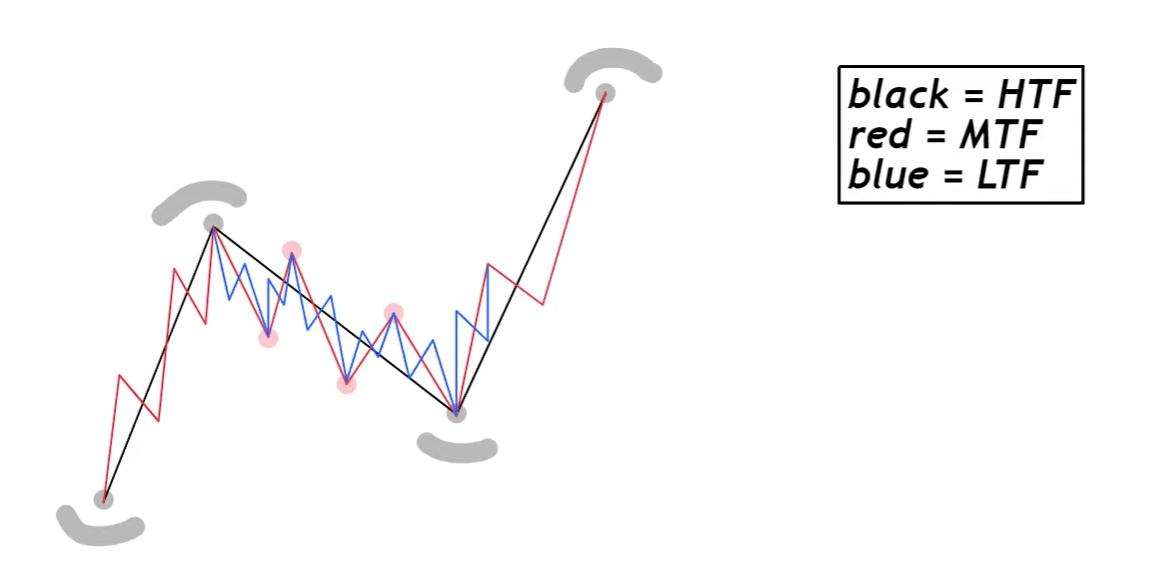
- Black = High Timeframe (e.g., 3-day or daily)
- Red = Mid Timeframe (e.g., 8-hour)
- Blue = Low Timeframe (e.g., 1-hour or 30m)
The higher the timeframe of a structure, the more importance it has. The HTF is most important — but the LTF breaks are what start the HTF pivot points. Pay attention to all of them so you never get trapped.
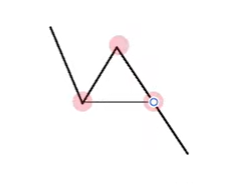
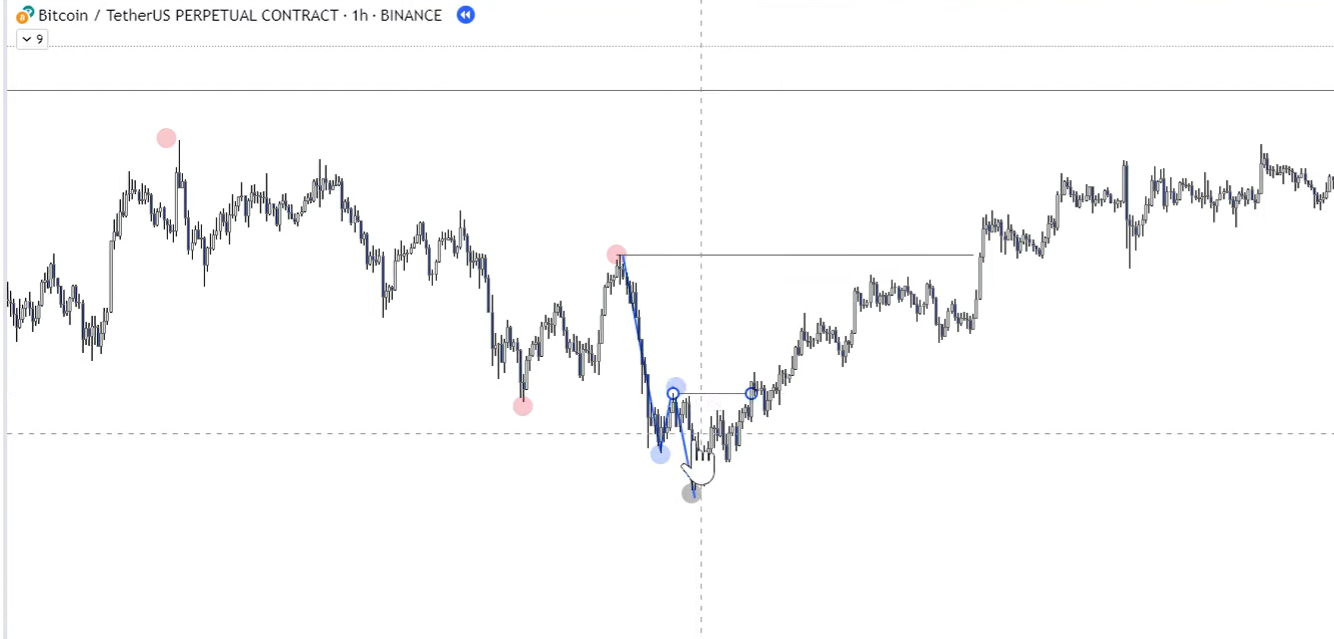
The Domino Effect
- Break blue → rotation toward red
- Break red → rotation toward black
- This is how low-timeframe breaks start high-timeframe pivots.
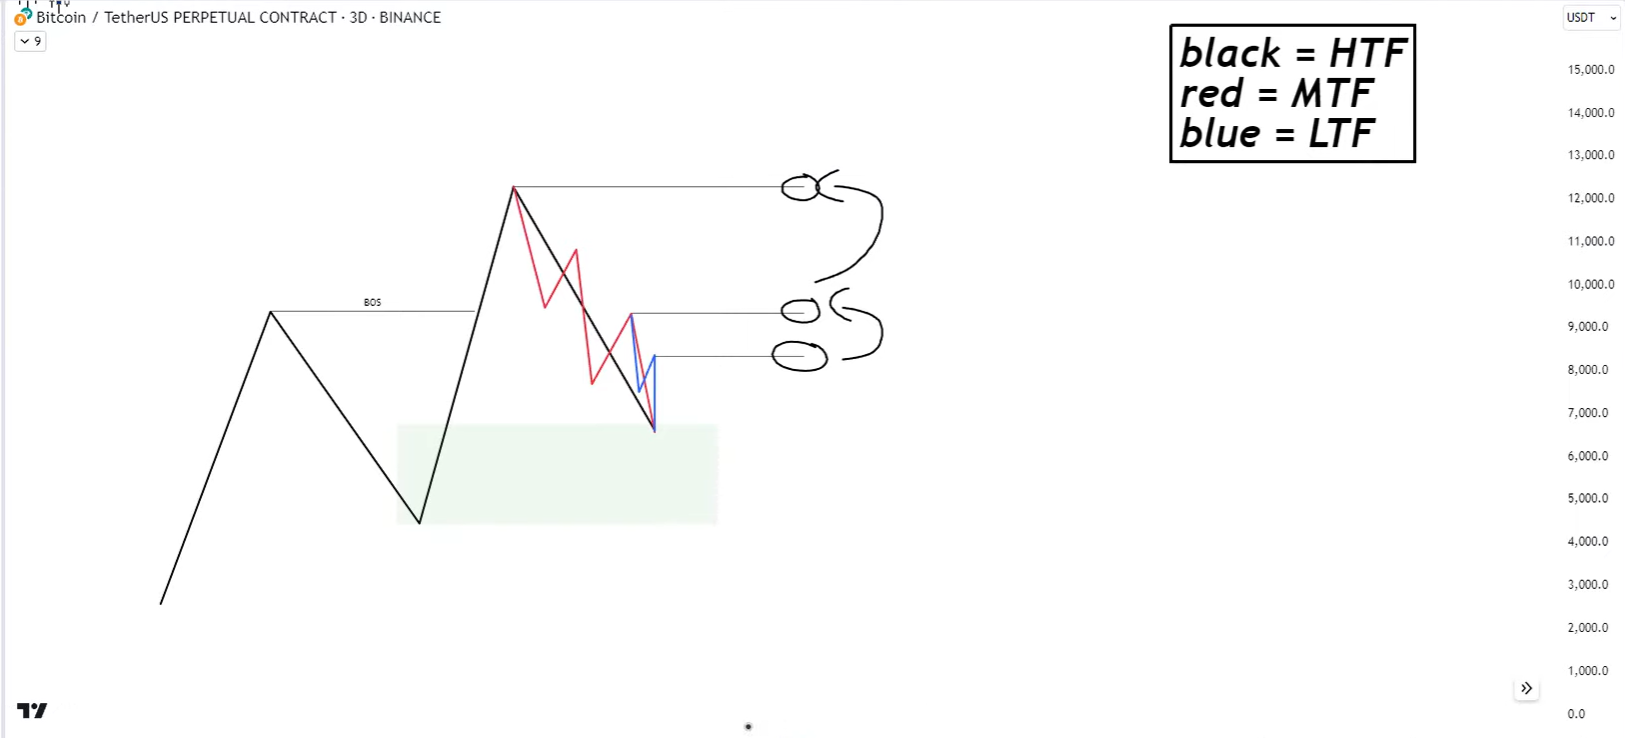
One by one, the MSHs of each timeframe get broken.
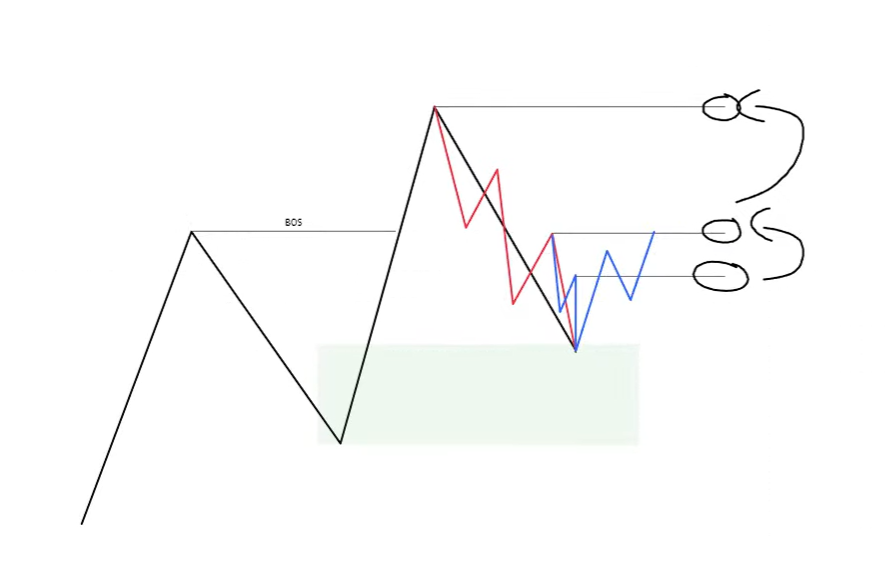
By the time we can expect a higher low for a higher high on red, we can already start anticipating that this could be the pivot point and the MSL for a massive HTF move.
This helps you enter early on reversals, avoid false breakouts, and stay out of traps.
Wait for red to break back to bullish, then long the retracement up toward the black high. If red never breaks back to bullish and you take out the low, you would have never longed the higher low — and avoided a fake move.
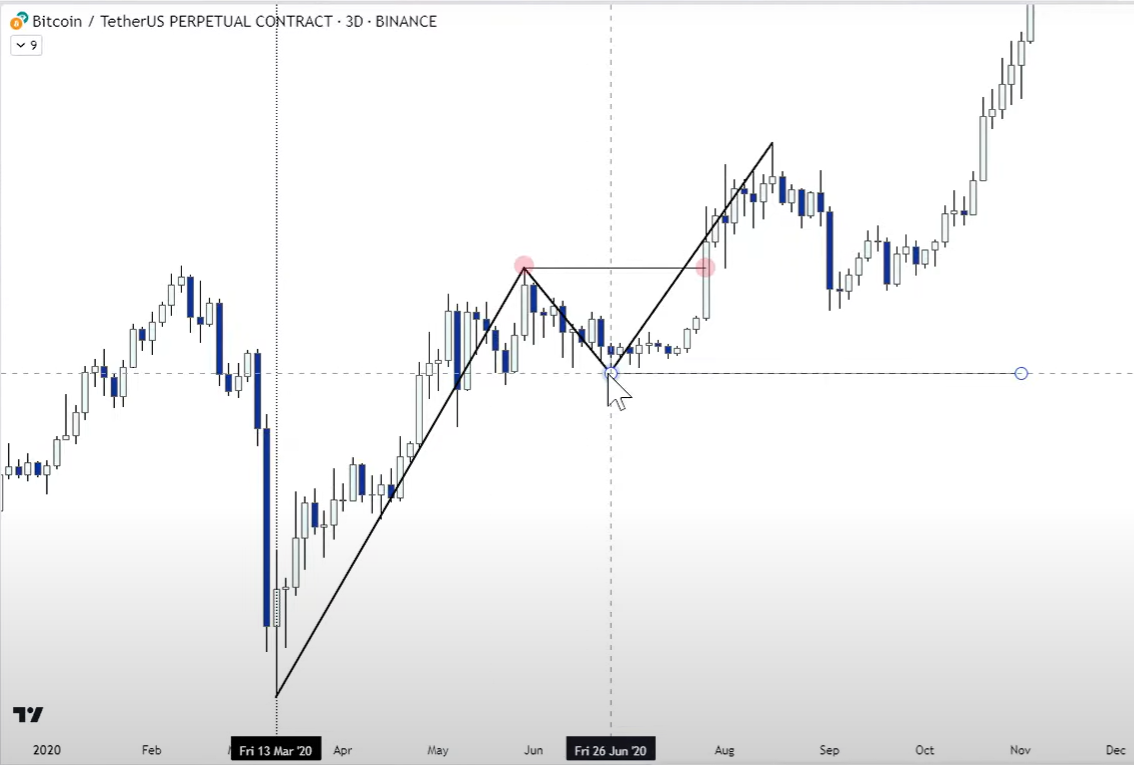
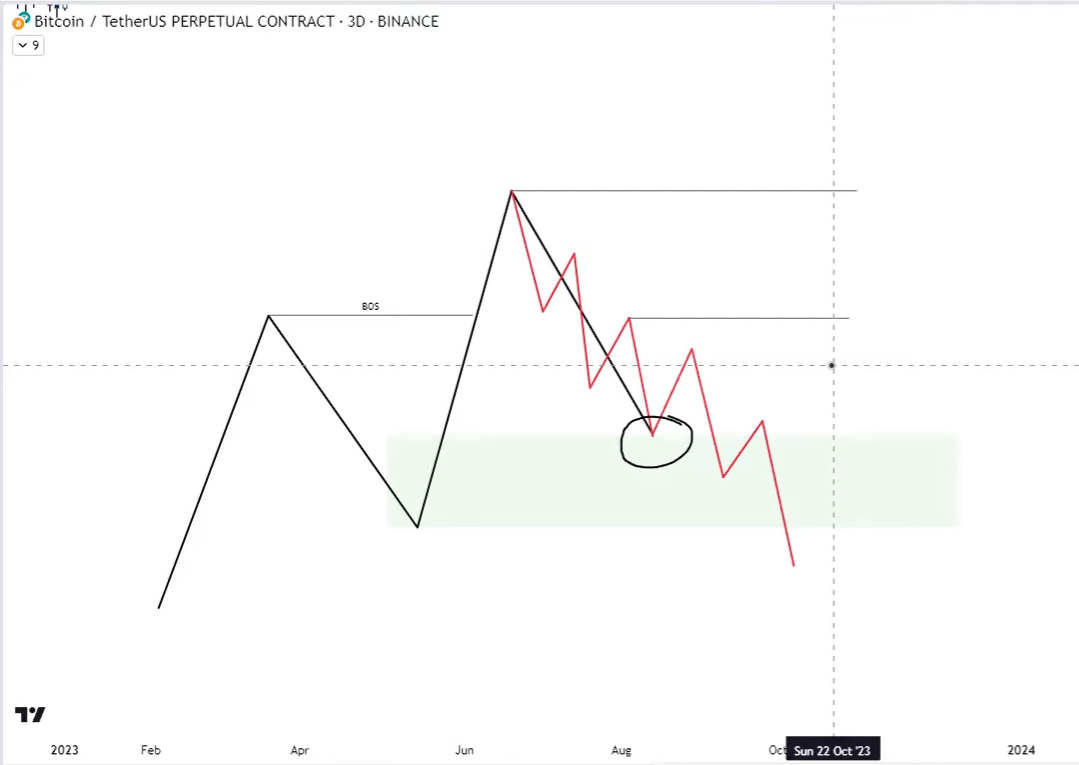
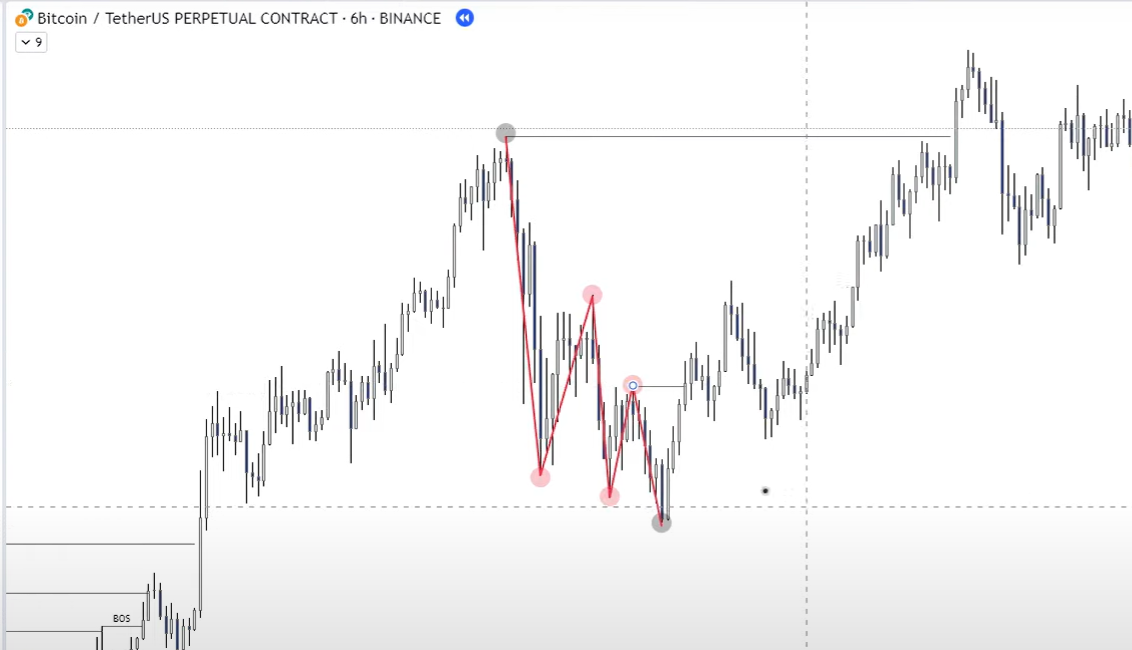
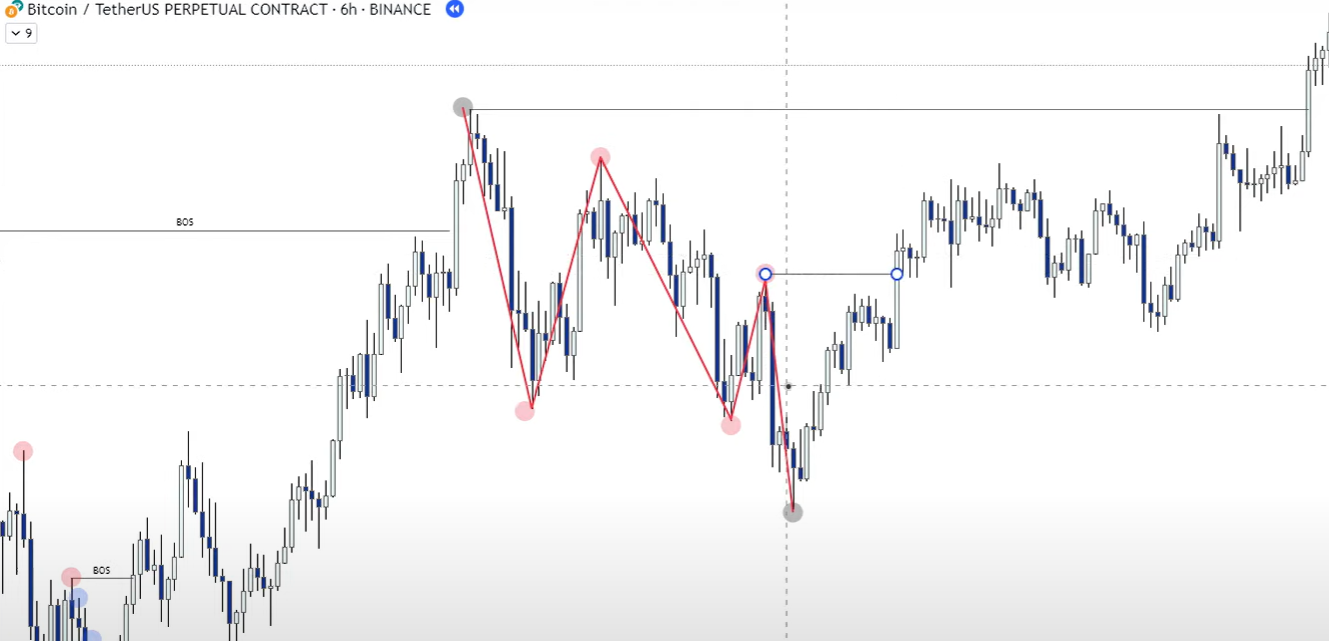
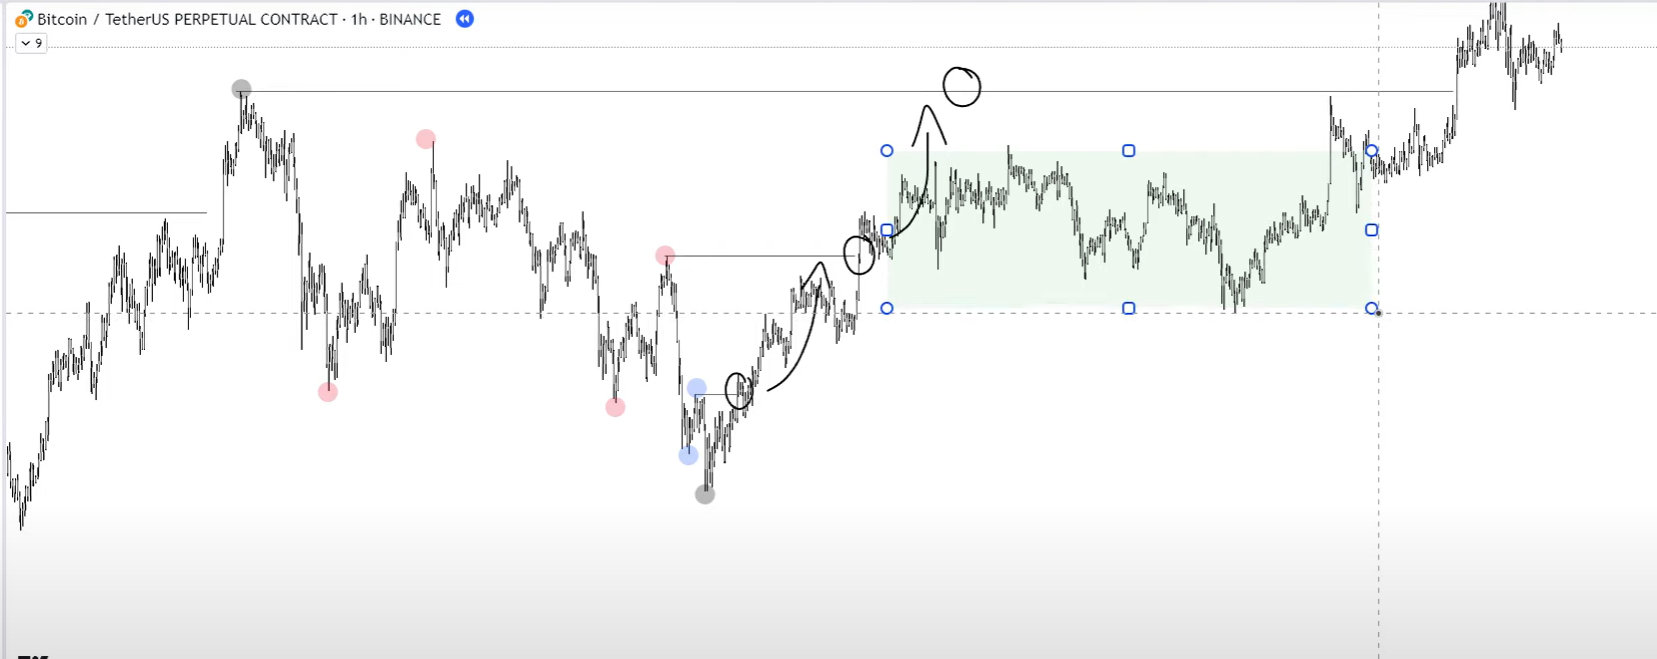
Domino in Action
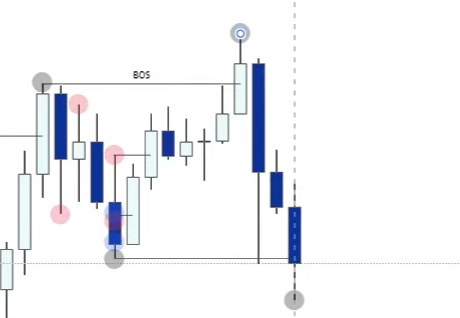
BTC 3-day chart, one big down candle:
On lower timeframes (8h, 4h, 1h), the structure is clear:
Break of blue → confirmed pivot:
The fact that we broke blue confirmed the marked low could be a potential pivot point on the black 3-day drawing. If we never broke that back to bullish, this would never have been a valid low — and you would have never gotten trapped into thinking it was one.
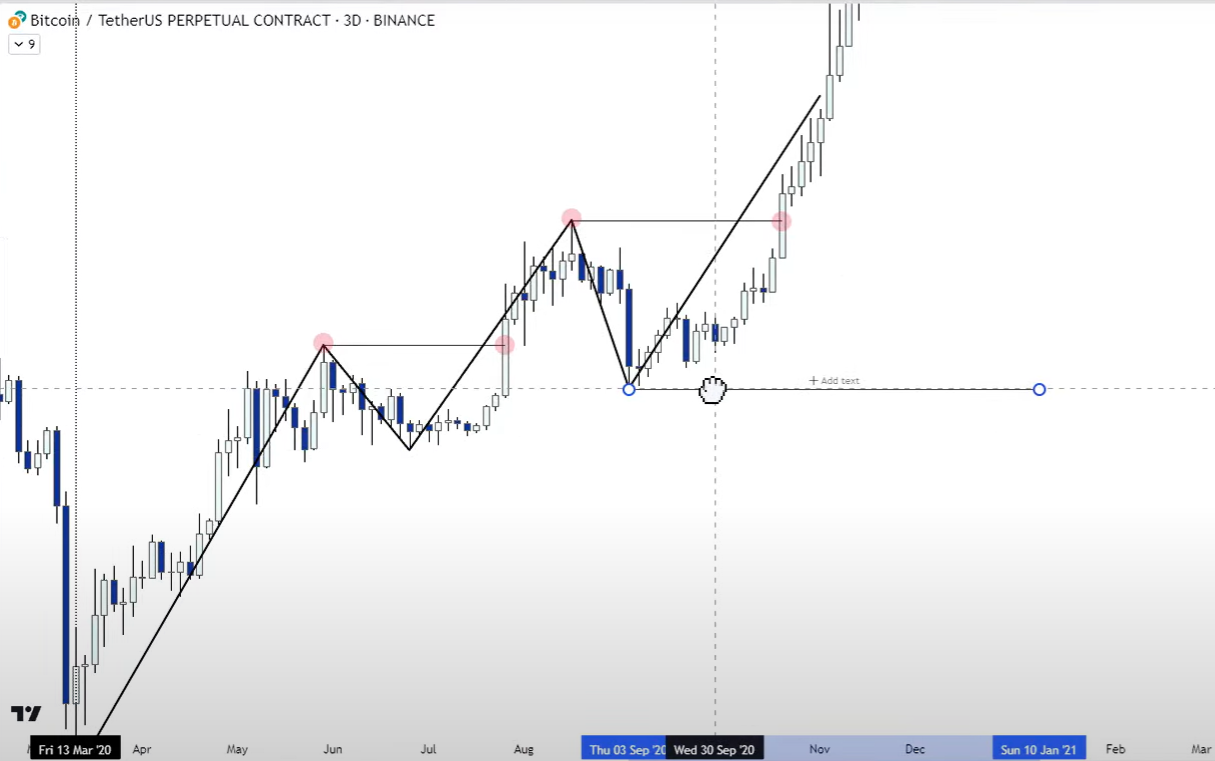
Break of red → confirmed trend reversal on 3-day. Entry was possible early, with high confidence.
Confirming with even more LTF structure on the latest expansion down:
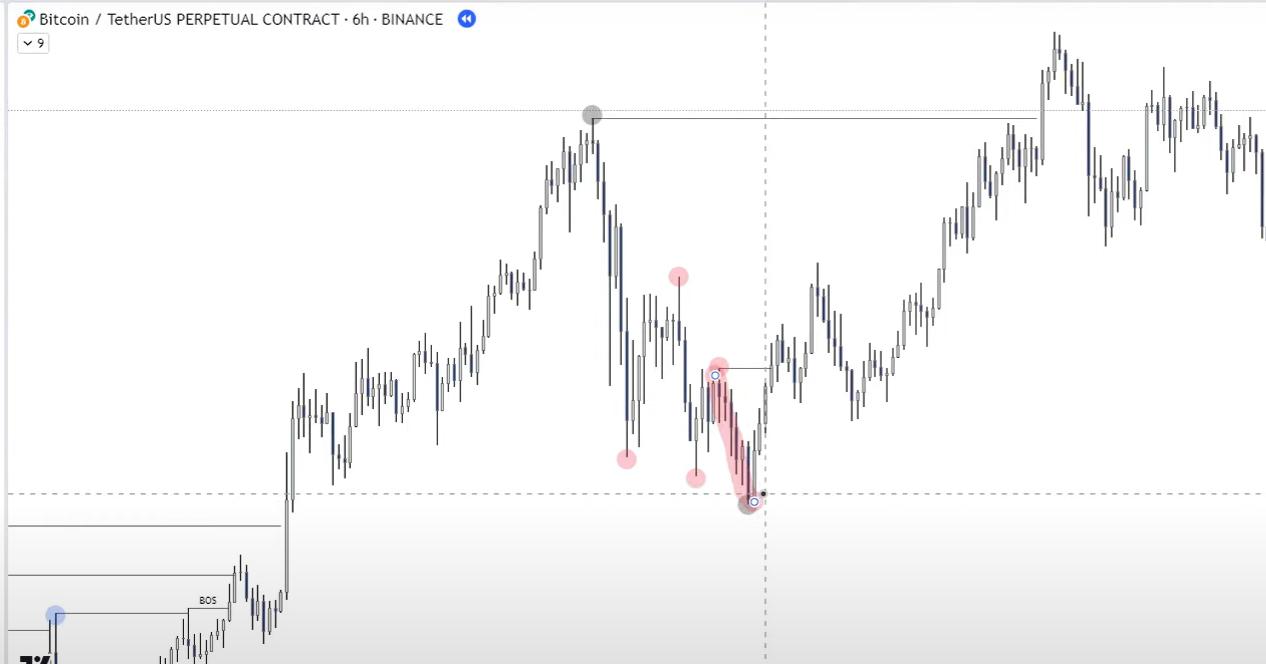
Using the domino effect: the moment we break the blue MSH, we can come up to red. The moment we break red, we can rotate to black.
Played out to perfection. You could have looked for longs across the whole green box of price action and taken them toward the black MSH.
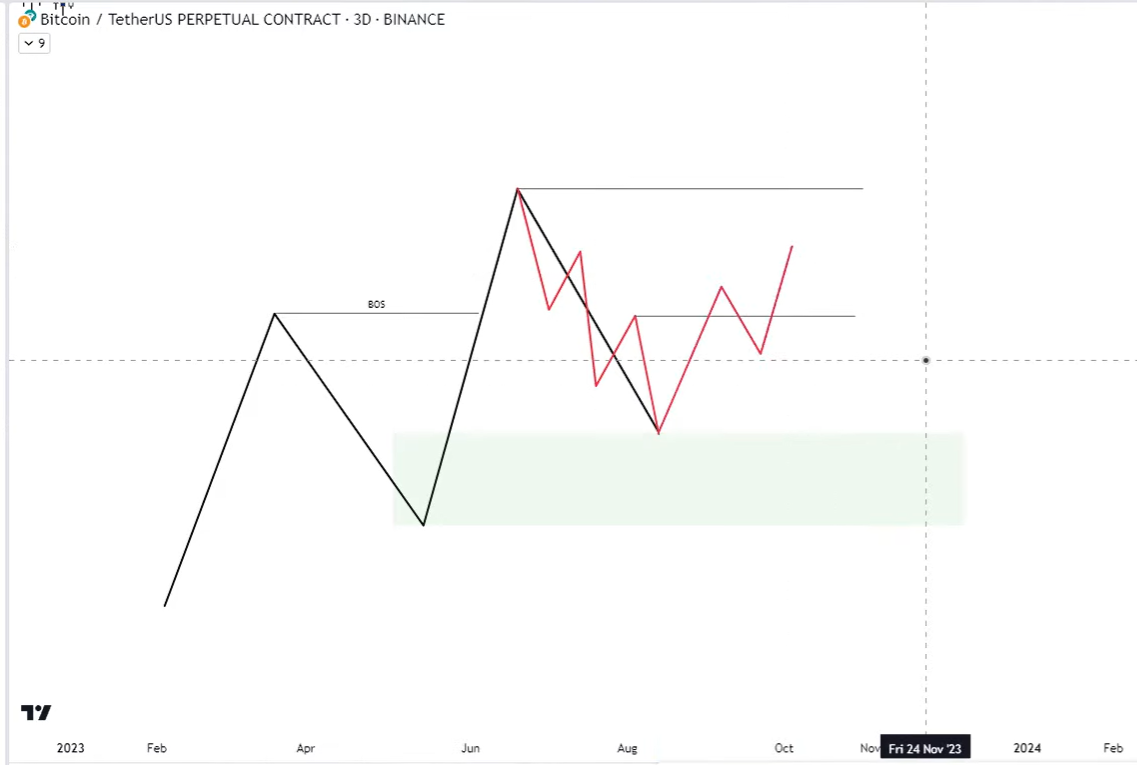
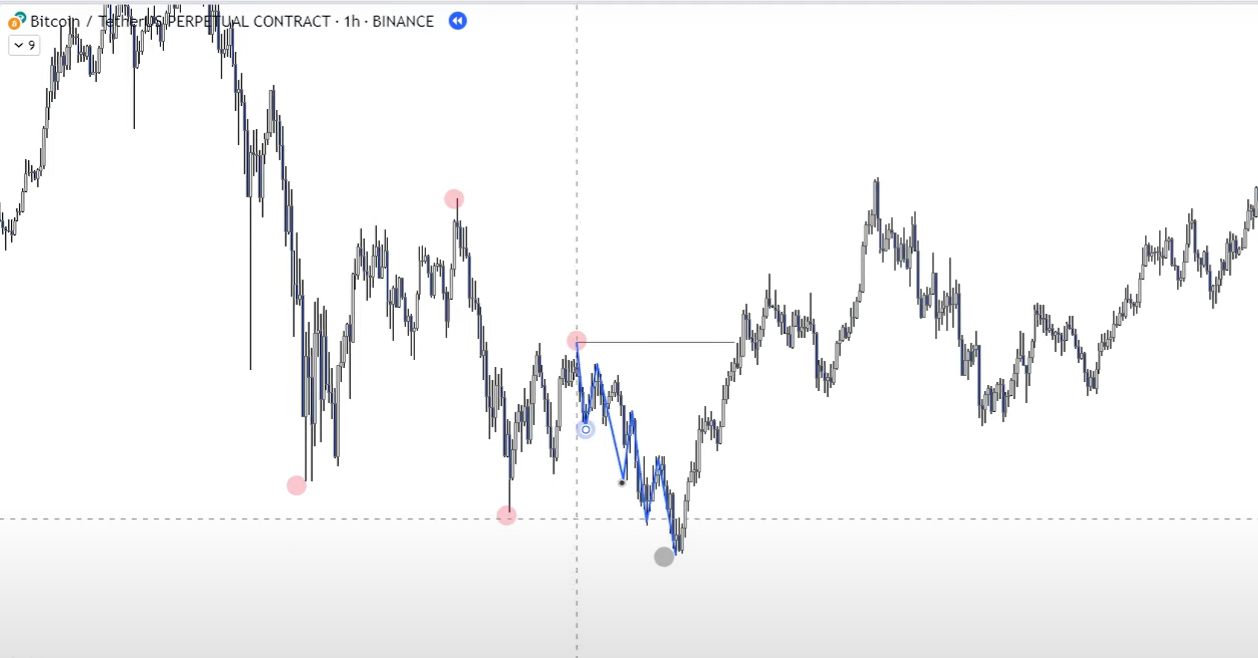
What About a Bad Break?
Apply the domino effect: break blue → rotation toward red. Break red → rotation toward black. If you never break blue and never break red back to bullish, you never get a higher low — and you stay cautious about longing a higher low because the original break of structure was bad.
If you break blue back to bullish, get rotation to red, then break red back to bullish and get rotation to black — you've confirmed the higher low. Even though the original break was not great, the domino chain gives you reassurance and a bias to look for longs in the green area toward the black MSH.
Without that confirmation, you would not have longed a potential lower low and gotten trapped:
On LTFs there were constant lower highs and lower lows — no bullish confirmation, no longs.
Avoiding Fake Breaks
If price is forming a "potential" higher low, don't enter yet. Wait for blue to break bullish, then red to break bullish. If blue breaks back bearish before red breaks bullish → downtrend continues. ==Only long if the domino chain is respected.==
Building High-Confidence Entries
- Analyze black (HTF): identify structure highs and lows.
- Use red (MTF): confirm local trend behavior.
- Use blue (LTF): anticipate reversals or continuation.
- Track breaks in order: blue → red → black.
You avoid longing fake higher lows. You enter with confirmation from smaller timeframes. You build full context and can produce a handful of perfect trades across an entire cycle.
Timeframes — How I Define Them
I teach my own timeframe definitions. Adopt these or come up with your own.
"Micro TF: 5min and lower LTF: 15min > 2H MTF: 2H > 12H HTF: 12H > M+"
HTF (12h+)
- Hold the most liquidity, most reliable.
- The higher the TF, the clearer the predominant trend signal.
- 1W+ are macro timeframes.
- HTF plays = up to 3% of trading account, max 5% if optimal.
MTF (2h–12h)
- First reliable validations of BOS, CHoCH, BOMS.
- Key for refining levels.
- MTF plays = up to 2% of account.
LTF (5m–2h)
- Super-refined entries, exits, and stops.
- First possible signs of BOS, CHoCH, BOMS.
- Less reliable — they hold less liquidity.
- LTF plays = up to 1% of account.
M'TF (<5m)
- Ultra-refined entries, exits, stops.
- Entries based on micro structure reactions to key levels.
"In micro timeframes, you can better see when a price reversal is likely, since the ⚡️ at key levels is a powerful sign of that. If you spend time in those timeframes when the price is reaching key levels where you expect a reaction, you'll start to notice a pattern and better understand whether a reversal can actually occur or if the reaction is too weak."
Note on TradingView and Timeframes
TradingView anchors all intraday timeframes to the daily close. Timeframes that don't divide evenly into 24h produce one partial candle at the end of each daily session — always the last candle before the 00:00 UTC reset. So a 23h candle is actually 1 × 23h + 1 × 1h candle. When trading off a 23h level, the chance is high that you're really taking a trade based off a 1h hOB.
Position sizing for these plays is covered in 🔷Position Size; broader risk thinking is in 👑Risk Management.
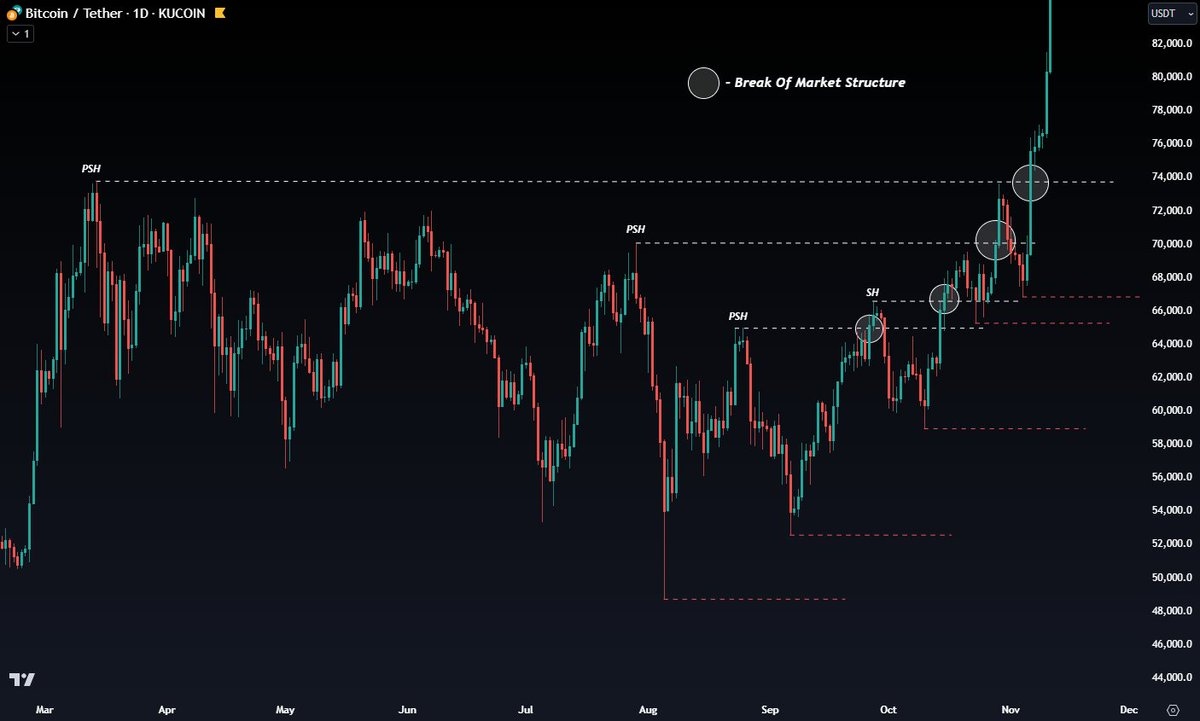
Previous Swing Highs (PSH) and Previous Swing Lows (PSL)
When we talk about a structural break, we're usually talking about price closing past a PSH or PSL. The two main factors that decide whether you enter a trade are market structure (MS) and liquidity/volume — the two simple concepts most traders overlook.
MS tells you whether the trend is bullish, bearish, or consolidating. It also helps you spot manipulation that whales set — like a False Breakout.
A BOS is important because it represents a shift in MS/trend.
- If PA breaks above a PSH or below a PSL, it indicates a potential reversal or continuation in the breakout direction.
- A BOS on a HTF is far more reliable than on MTF/LTF.
- Never trade against the HTF trend. If you do, accept that the probability of success is lower — risk less, or ignore the trade entirely.
HTF > MTF > LTF. The higher the timeframe, the more powerful the BOMS.
You always look for the MS first when charting a setup — it's a confluence. If your PSH wasn't broken but you can still see a key liquidity level, it doesn't mean you ignore it. You can just risk less, because the confluence is weaker. Find your personal preference and master your thoughts on a chosen setup.
Once the PSH / PSL is broken, you have a new range — and you'll look for key levels within it. Remember 🔷Premium & Discount zones when placing your fibs. Understanding MS helps you identify optimal trades.
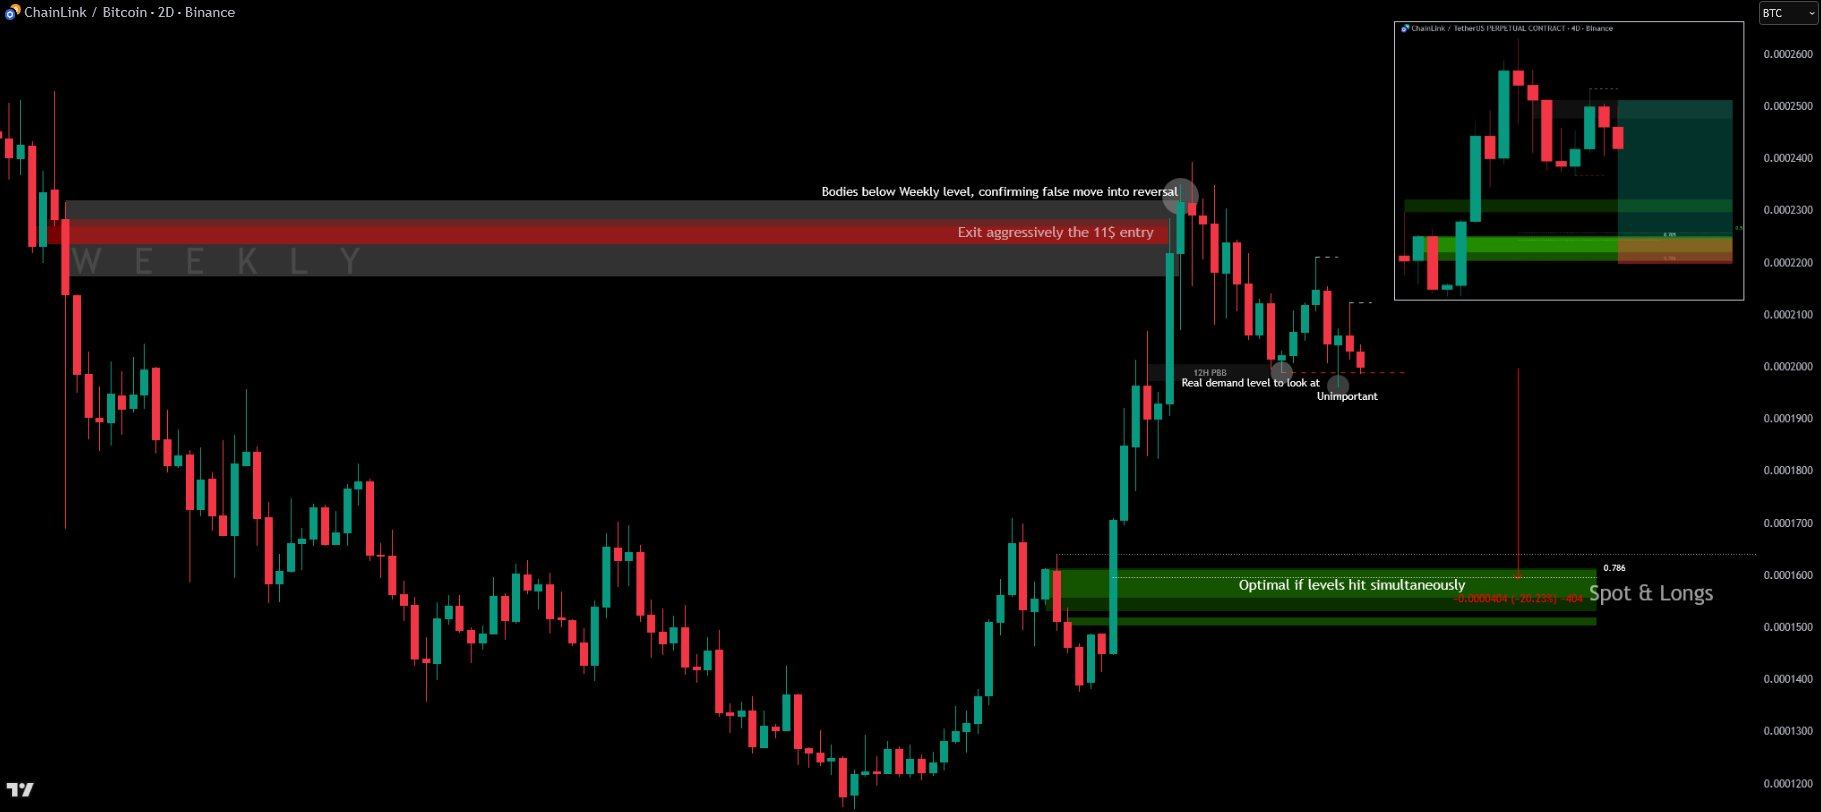
LINK Example
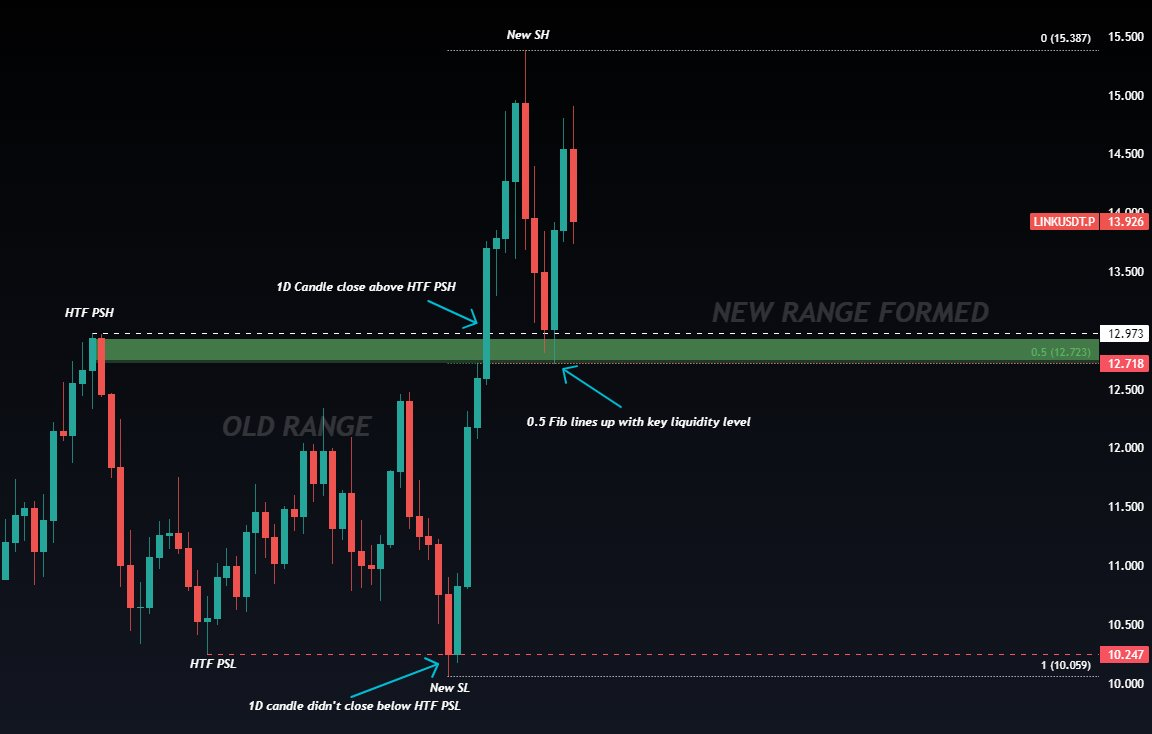
In the old range, the 1D candlestick didn't close below the HTF PSL — so we can assume PA will continue ranging inside the old range. Then the 1D candle closed above the HTF PSH, indicating a market structure shift (MSS) and leaving behind an FVG which created the HOB.
Now there's a new SL and SH (new range formed). Place fibs from SL to SH and you can see equilibrium lines up with the key liquidity level — the 17H HOB inside the 1D pHOB.
Confluences:
- Market structure shift
- HOB as key level
- Equilibrium lining up with key level
It all started with identifying the MS and seeing that price broke past the PSH to the upside — so we can assume price will pull back into a key level and continue upward. PA seeks the key area of liquidity, giving us a long opportunity.
Check the HTF BOS as your main confirmation of whether the long/short setup is strong or weak. The key to successful trading is understanding the MS and identifying the shift patterns — timing the market. Once MS has shifted, look for the best entries on the pullback. Waiting for a pullback into a key level after a MSS will increase your chances of success.
Outcomes When Price Hits Range Boundaries
Structure defines 🎁Supply & Demand, 🔷Premium & Discount, creates liquidity zones, and defines ranges (see Ranges and RANGES Tips). When price action moves beyond range boundaries, there are four main outcomes:
- Break out / down — price breaks through and keeps moving.
- Rejection — price fails to break.
- Break out / down plus retest — price closes relevant candle bodies past the range, then continues after retracing back into key liquidity.
- Fake-out — price breaks out / down, then reverses.
The third and fourth differ clearly. Fake-outs are usually sharp and aggressive, often leaving large wicks from stop hunts or liquidity grabs. Retests are slower and more deliberate, usually following higher-timeframe candle closes past the prior range boundaries.
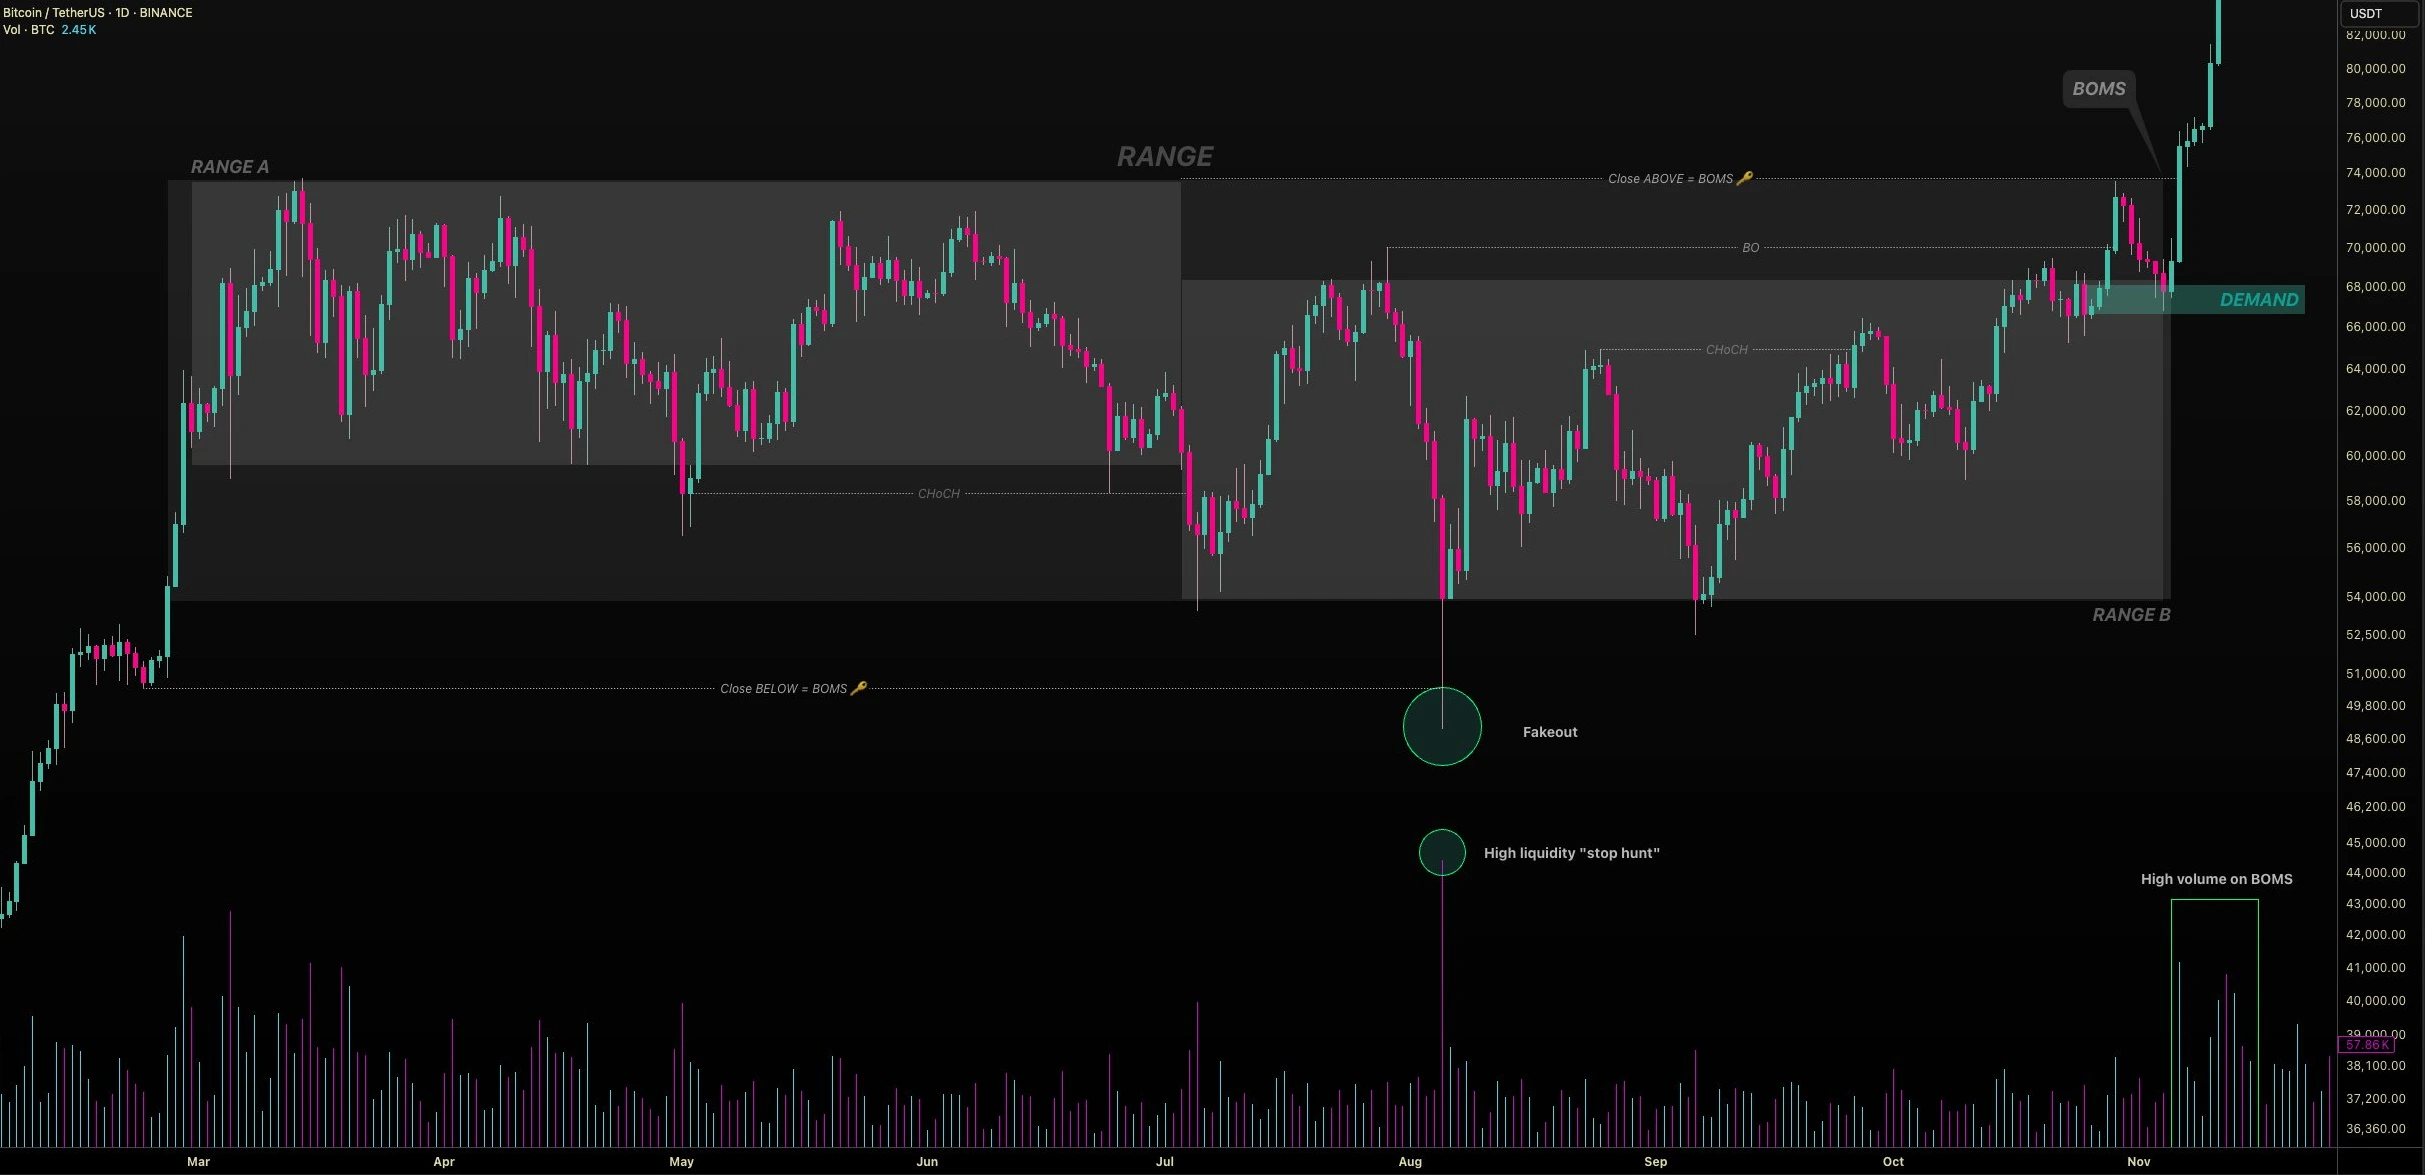
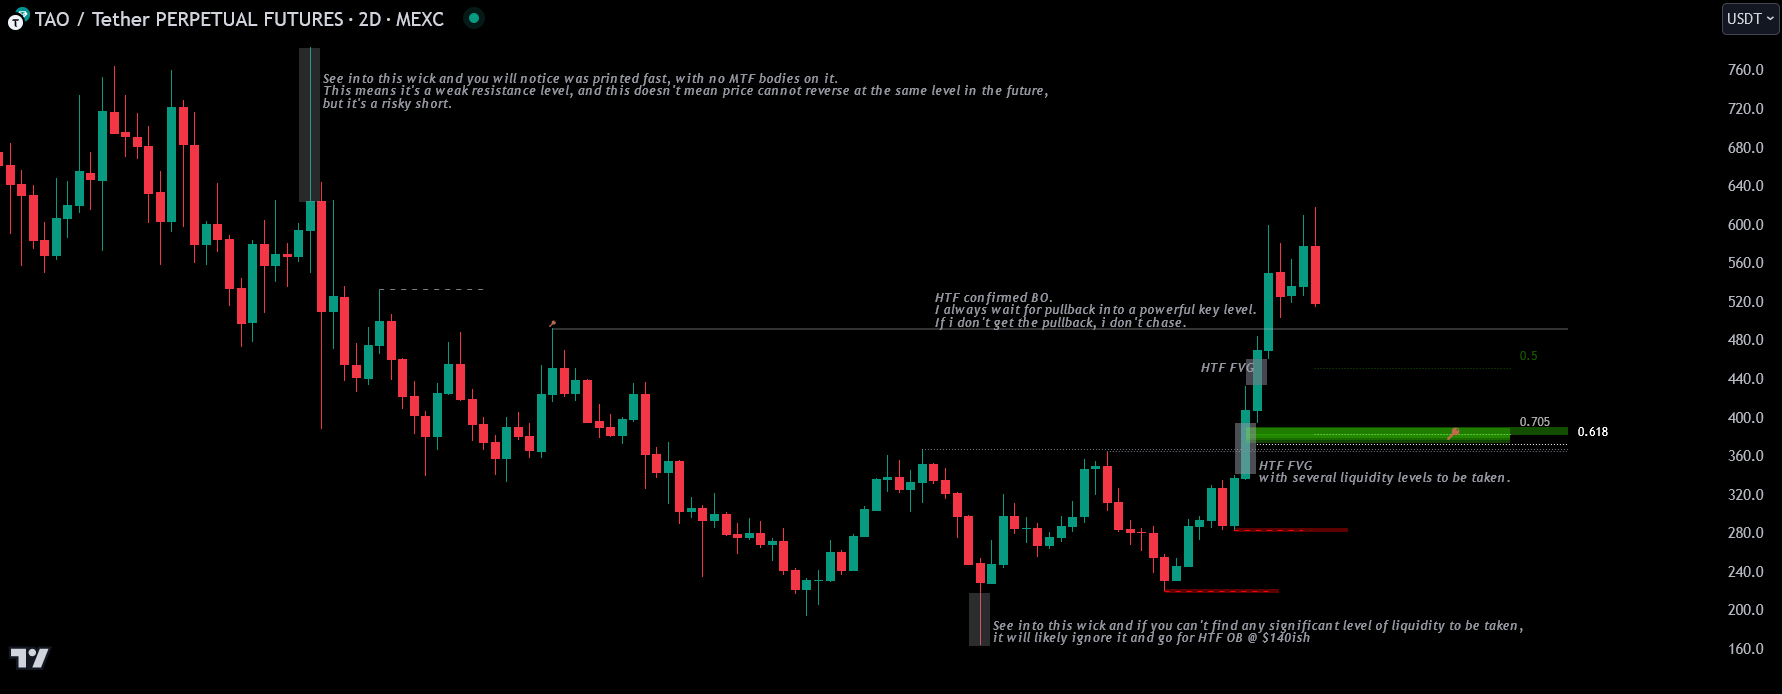
"Look for HTF body close above previous most significant swing highs. If not, it's likely a false breakout. If it does, the highest probability play is waiting for a pullback into key level before continuation into the next HTF liquidity level, and if there's none to take it will likely go to new ATH."
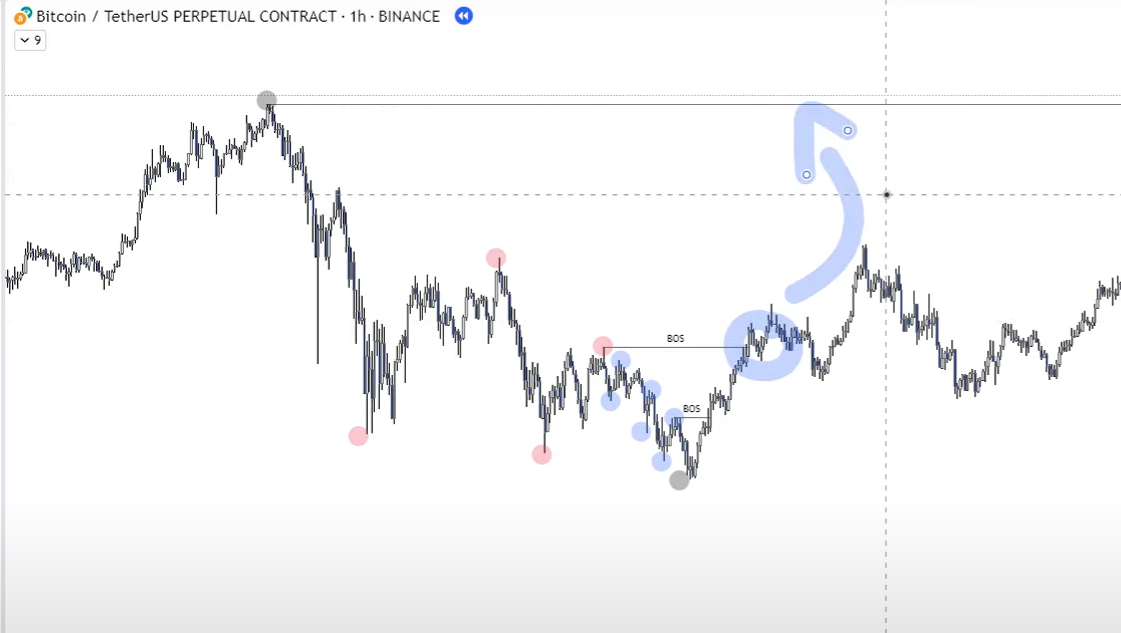
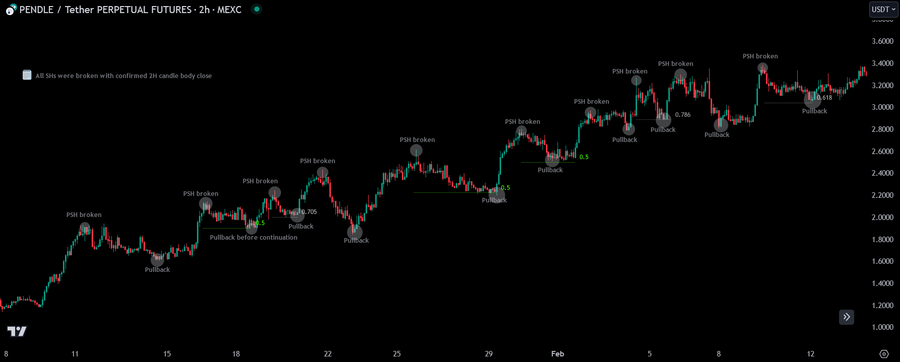
The 1, 2, 3 System (Squiggles)
Structural shifts are an essential part of my setups. The system has three parts:
- A valid break of a key level (BOS)
- A retrace into liquidity
- Entry at the refined level to ride the reversal
This ensures you get the optimal entry after fuel is taken, letting you ride the trade longer with clearer invalidation and better RR.
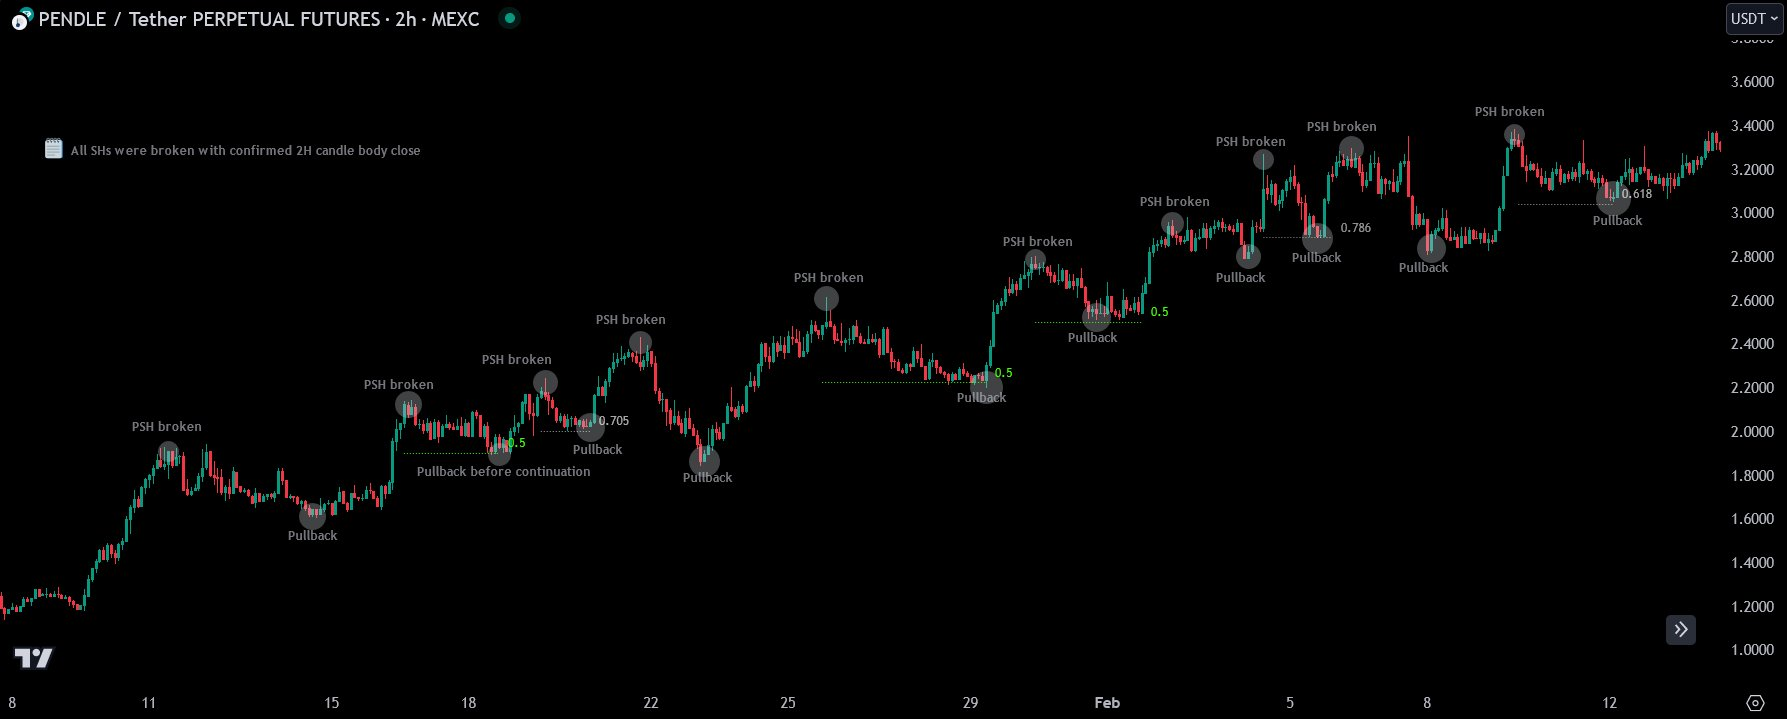
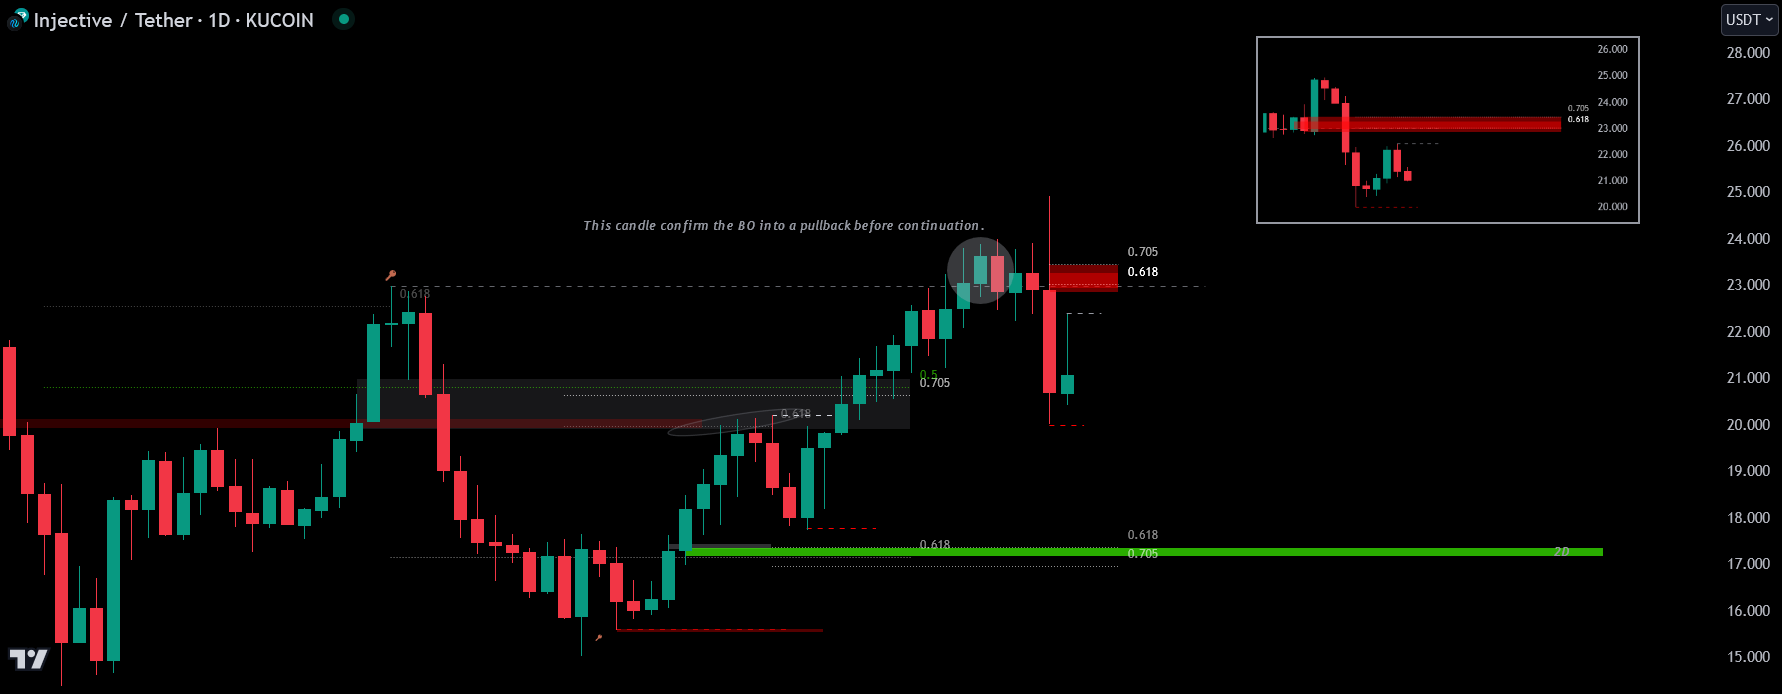
"There's no MTF or HTF candles closing above key PSH, so you don't long here. For the highest probability long it's the squiggle on the chart, with MTF (at least) close above key PSH plus pullback (the entry) before bullish continuation."
"All 'squiggles' mean the strategy is to wait for close above or below HTF key levels as stage 1 of 3, pullback or retracement into key levels if you can find them, and most of the time you can because bots always leave such levels with fuel behind, to come back later and reverse price again as stage 2 of 3 and this is your entry, and then continuation into the direction of the first move, stage 3. This is how these liquidity games work."
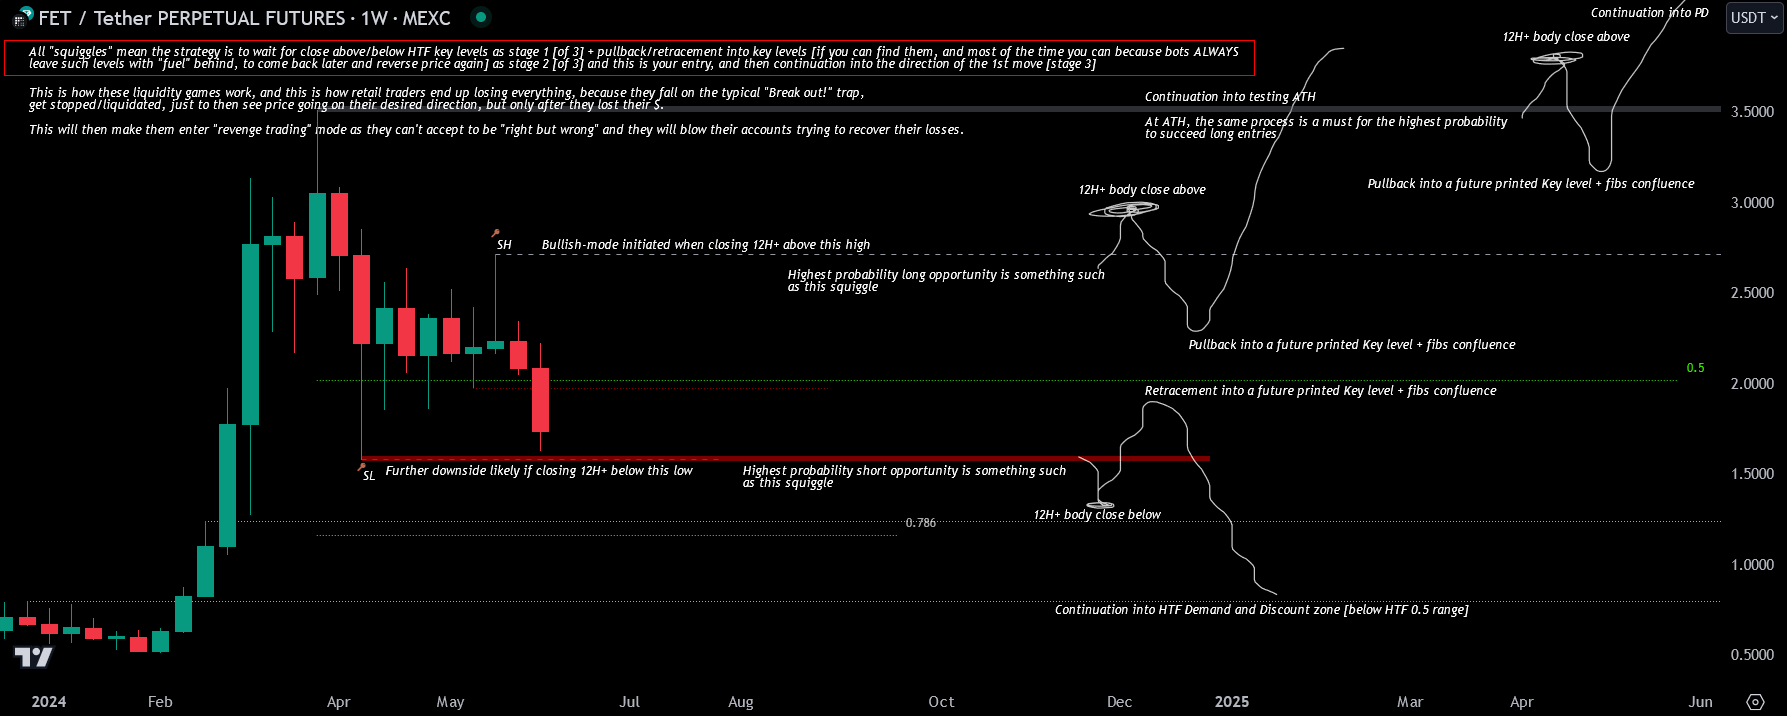
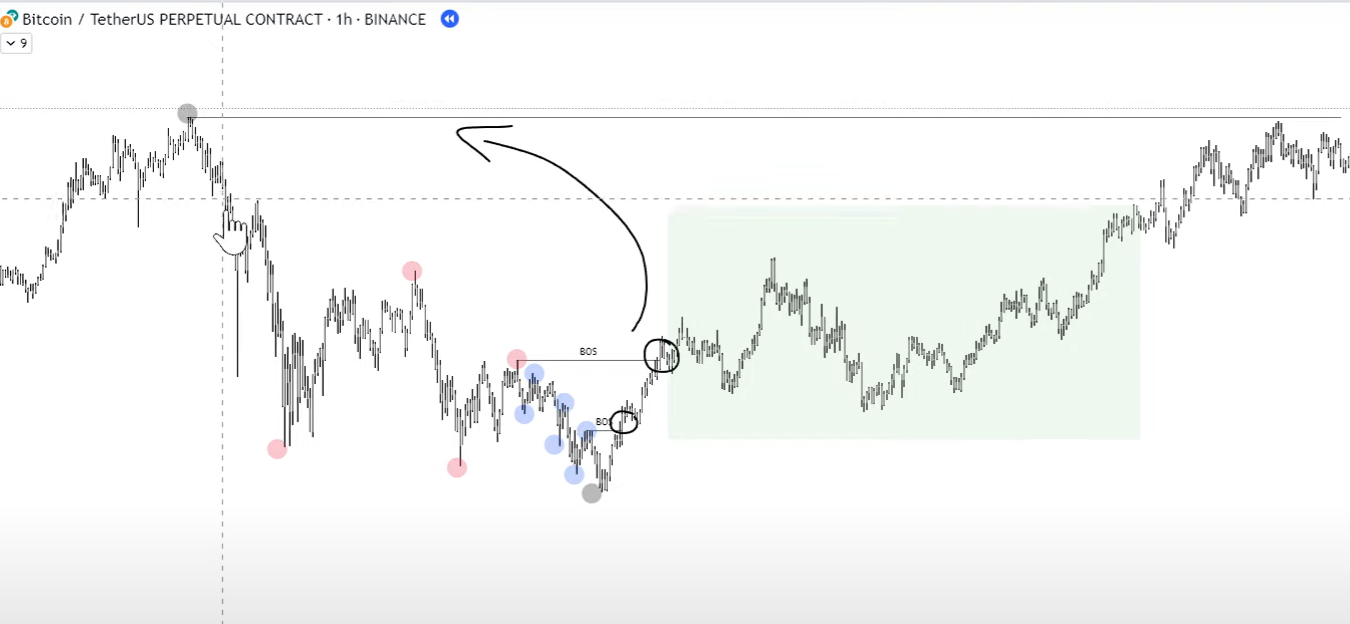
Breakout trading is popular, but charts like this one and the effectiveness of squiggles show its weakness clearly:
"You can always choose to long the breakout, but this isn't going for high probability as it's what all retail traders do, and the game's designed to stop or liquidate them all, collecting fuel, and then proceed in the direction retail traders expected, which will then make them start revenge trading as they were 'right but wrong'."
Liquidity as a Guide
Market makers leave footprints that help us assign probabilities to the next move. Liquidity is key. When key levels are left behind and price approaches a level without taking the liquidity first, chances are high it will revisit to grab that fuel before continuing.
"A helpful hint to determine if a breakout will reverse into a key level before trend continuation is to check if there's a key level left behind in the previous range that price is attempting to break out from. If the key level is present, especially on HTF and you can refine it into lower timeframes, the probability of a pullback into that level before continuation becomes significant, as price tends to gravitate toward such levels. Additionally, if there's a key level above the swing high that can be taken, it could act as fuel for a drop into the lower level, setting up for a subsequent pump."
When no such levels exist, the probability is higher that the breakout/down is real and price will continue.
"If you cannot find such, the probability for breakout into price discovery, without looking back for a while, is higher."
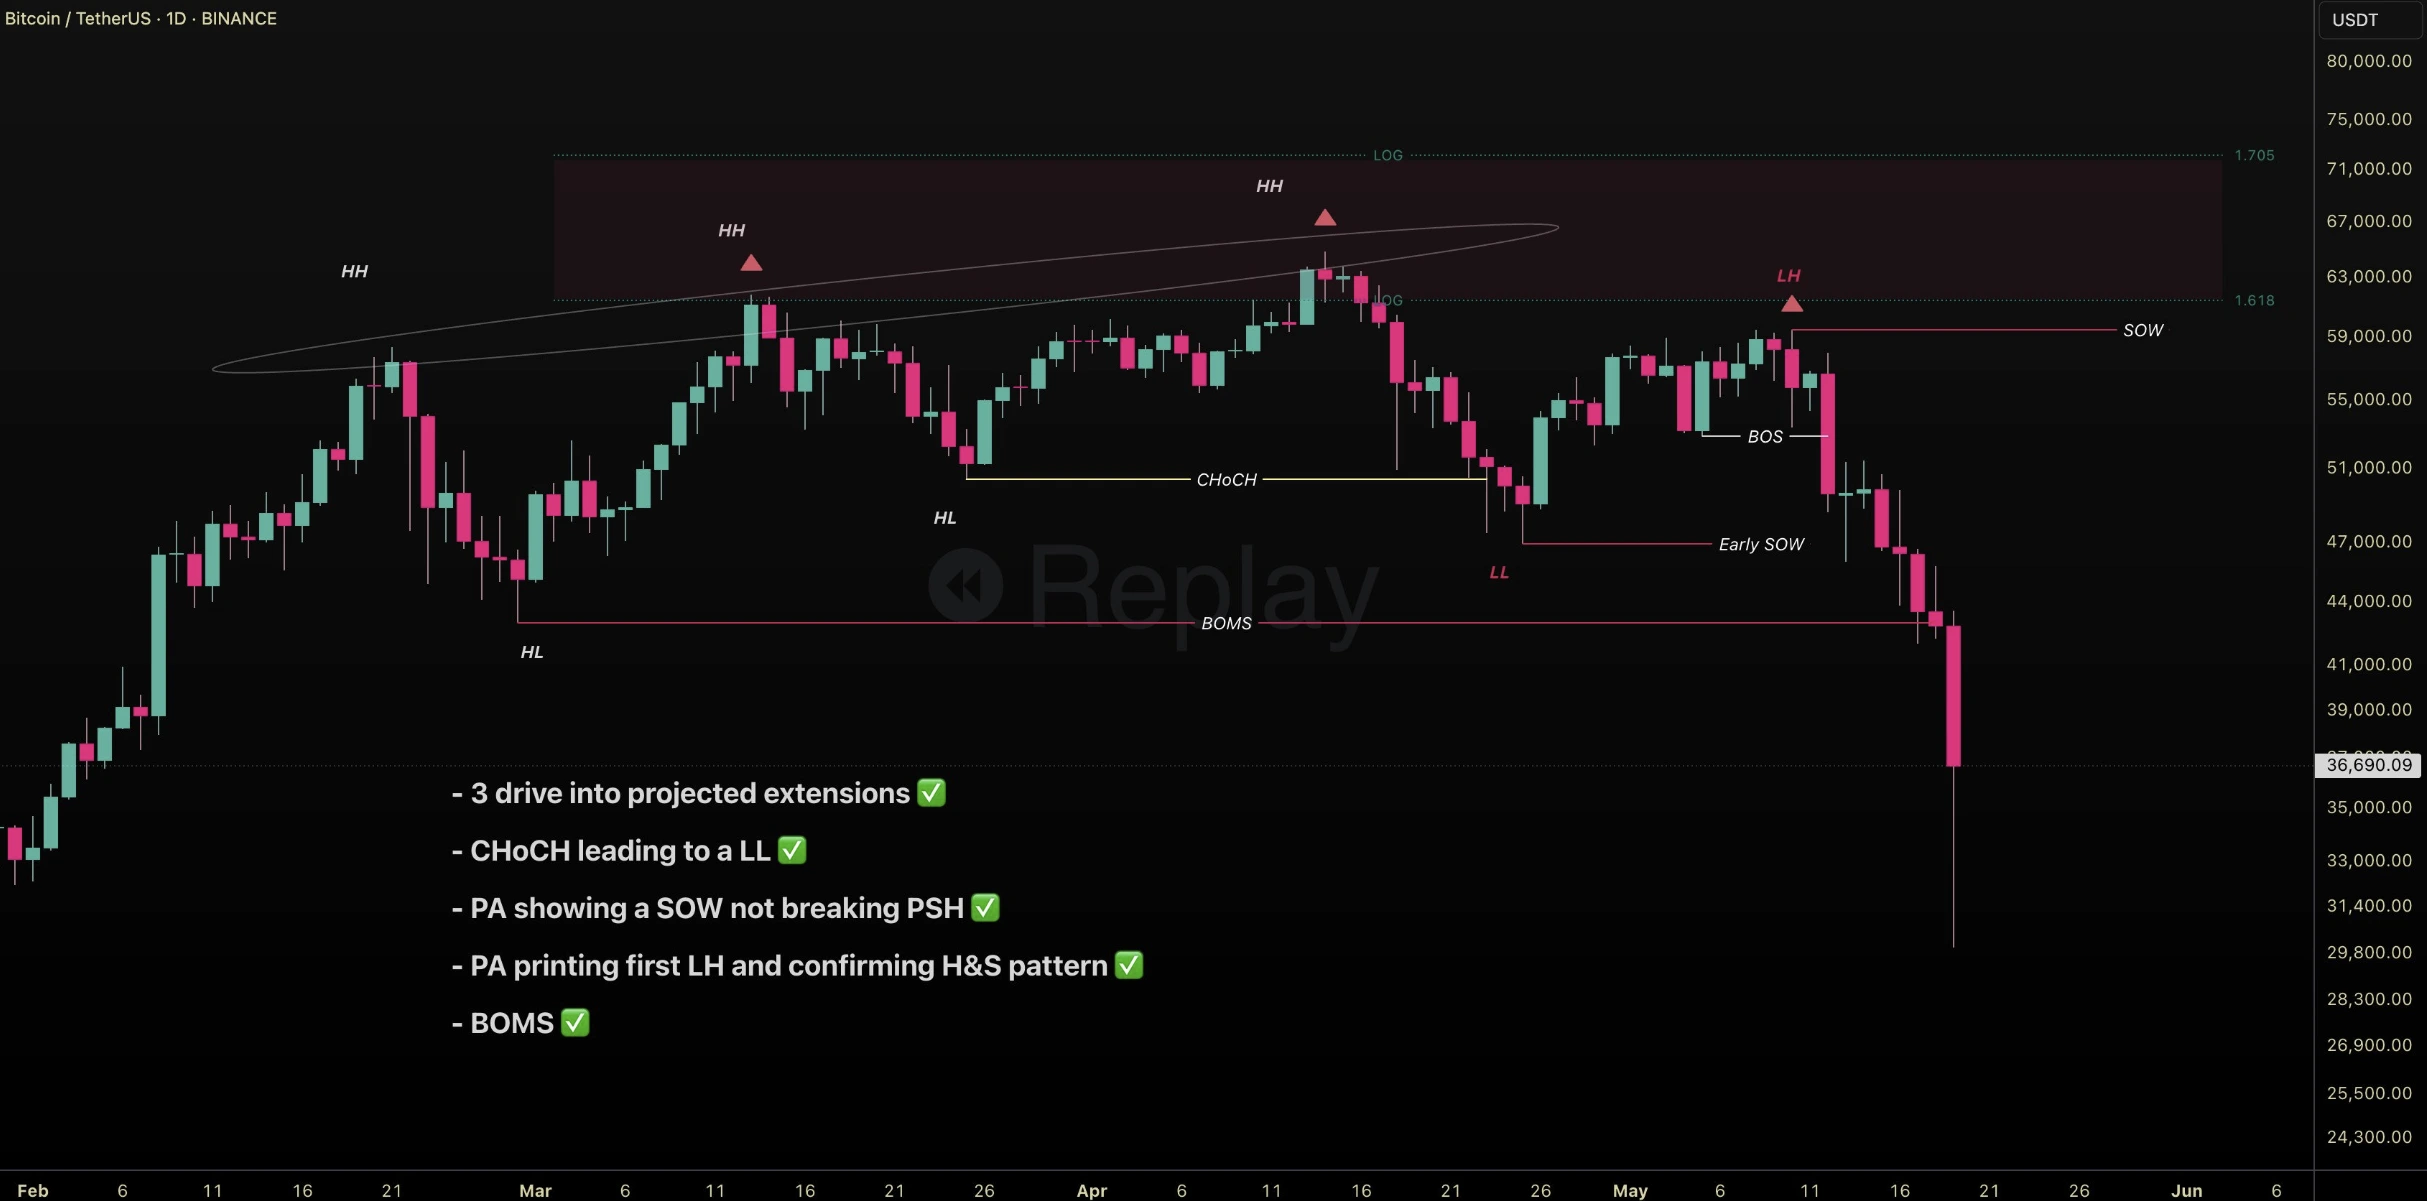
Trend Changes and Bias
Putting these tools together helps spot potential tops forming. Using BOS, CHoCH, BOMS gives further confirmation.
"Buy program: Bullish BBs work wonders. Buy program: Bearish BBs can often fail, unless optimal. Sell program: Bearish BBs work wonders. Sell program: Bullish BBs can often fail, unless optimal."
Key Swings: Beyond the Obvious
♨️Key Levels🗝️ Key Swings🗝️
Many traders label whatever swing is visually obvious as "the previous" swing. That's reasonable in normal market structure — you can usually pick the obvious swings and still be factually correct. But not all structures are created equal.
I've seen many label 100.7k as the key PSL on Bitcoin instead of 93.4k. Reasonable, but not precise — because this MS is different. There were no real pullbacks, so there are no obvious SHs. You have mostly range highs from areas of consolidation to measure from.
MS is the best formula to identify trend, but advanced MS is great in identifying "premium" and "discount" liquidity highs/lows from whales. Those are the most powerful key swings, not ordinary key swings — where large-magnitude SFPs occur and macro double tops/bottoms form. If you can identify those before they occur, you can use the same criteria to understand why 100.7k is a MSS while 93.4k is the key PSL that will make or break a rally.
Opposite Pole Trades
Opposite Pole Trades
==Opposite poles / direction is more powerful than taking a supply level through FVGs== (same direction).
The more FVGs hide a key level, the more powerful the level is. No PA is the same. The game isn't "linear".
I have countless different criteria because there are millions of different patterns. It's not always what's "valid" or not, but how powerful each different level is. I don't take every FVG just because it's an FVG into liquidity. I often skip an opportunity if there's no fib confluence or ability to refine through TFs.
I don't need to wait for PSH or PSL close when it's like this, because this is proper hidden liquidity on HTFs. I look for opportunity at the test on opposite directions.
Trigger Confirmation Example
[Aug 14, 2025] — see also Trail Your SL
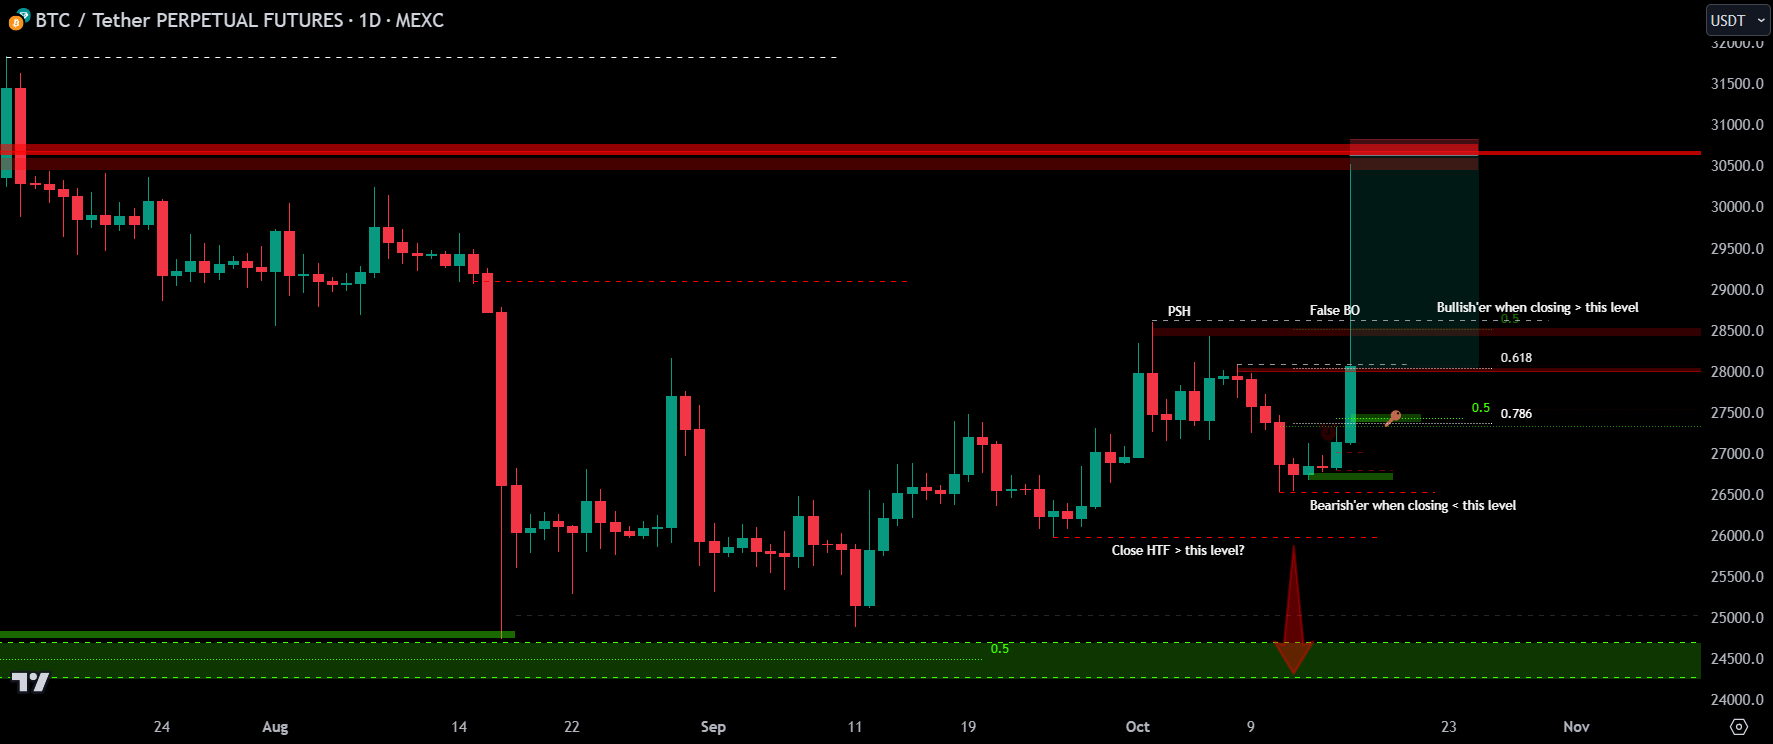
When strong timeframes align — a fib like .786, a clean block, sitting above a key swing high, near a HTF swing high, with clean levels close to the range low so price is 🧲 back down — that's trigger confirmation.
Now, here's where most traders lose the move: they push their SL to BE too soon and get wicked out on the second or third hit before the real drop even begins.
What I do — wait until price tags the 0.5 of the latest swing before moving SL to BE (or just above/below a key level). Not always, but most of the time. That patience and experience keeps me in position while others get shaken out early.
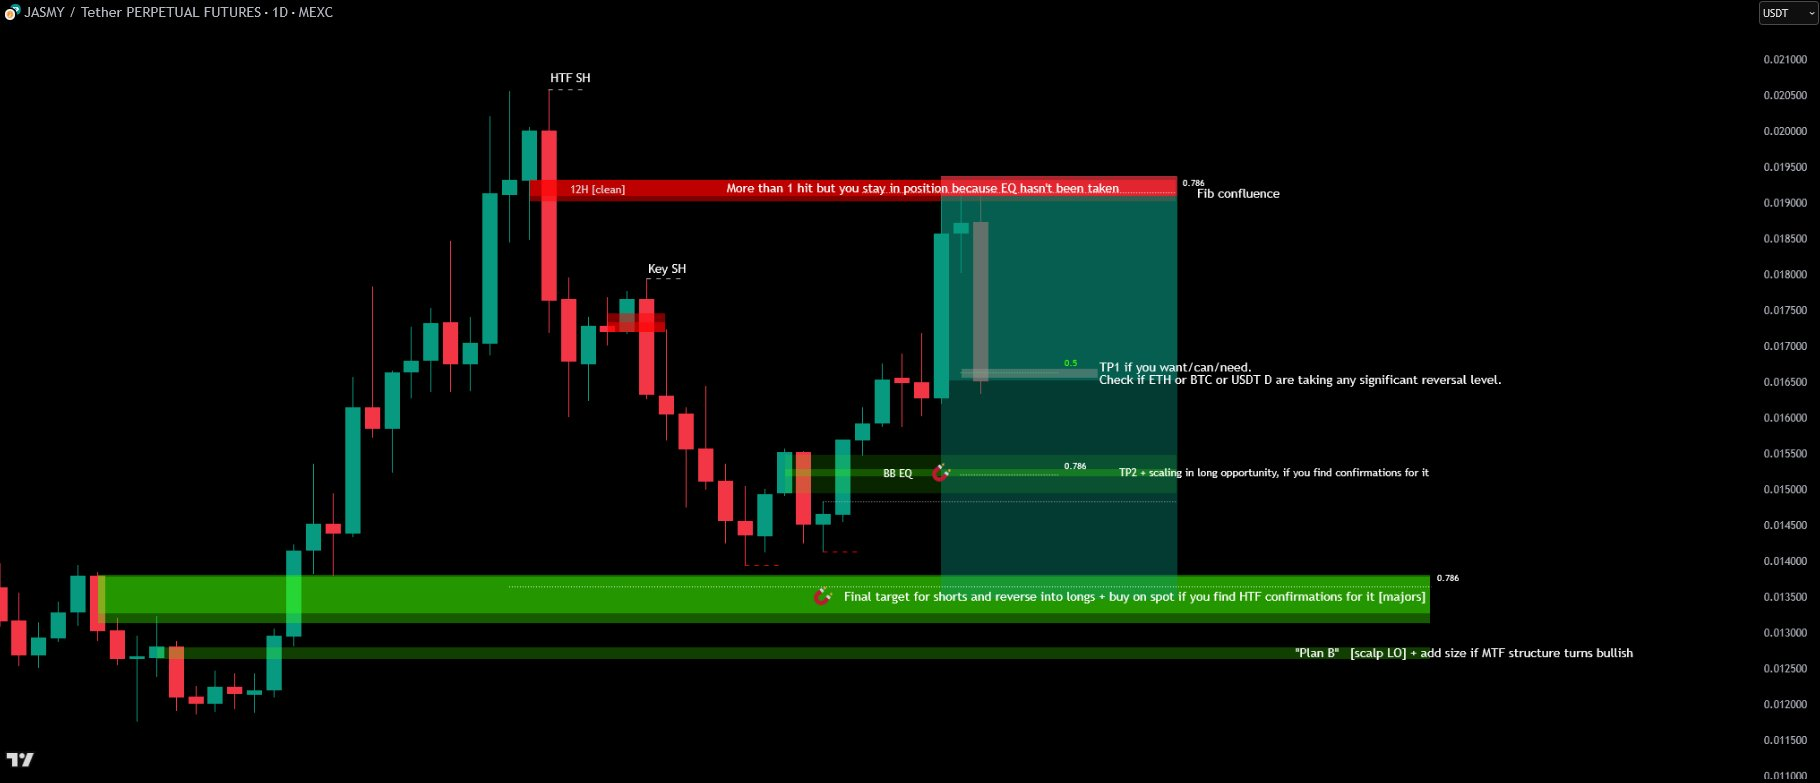
Real Demand Level
[Sep 21, 2025]
Real demand level to look at.
ETH Taking Macro Supply
[Feb 3, 2025]
Watch how ETH is closing above its HTF key level, confirming the latest ⚡️ as a liquidation hunt:
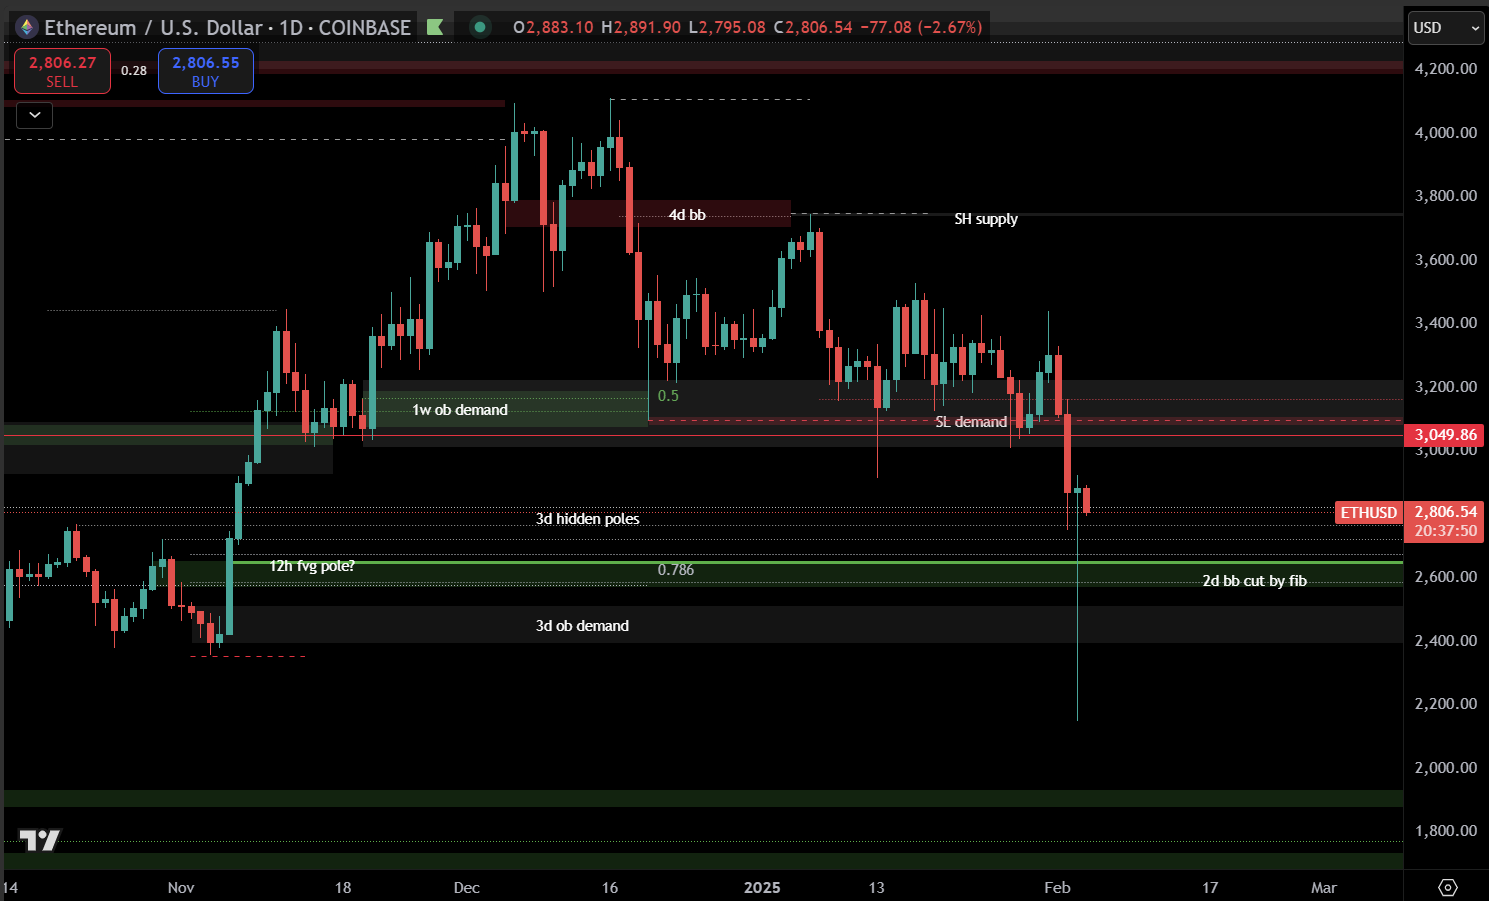
USDT dominance and Total2 hit their key levels perfectly, all happening during 🇨🇳 new year:

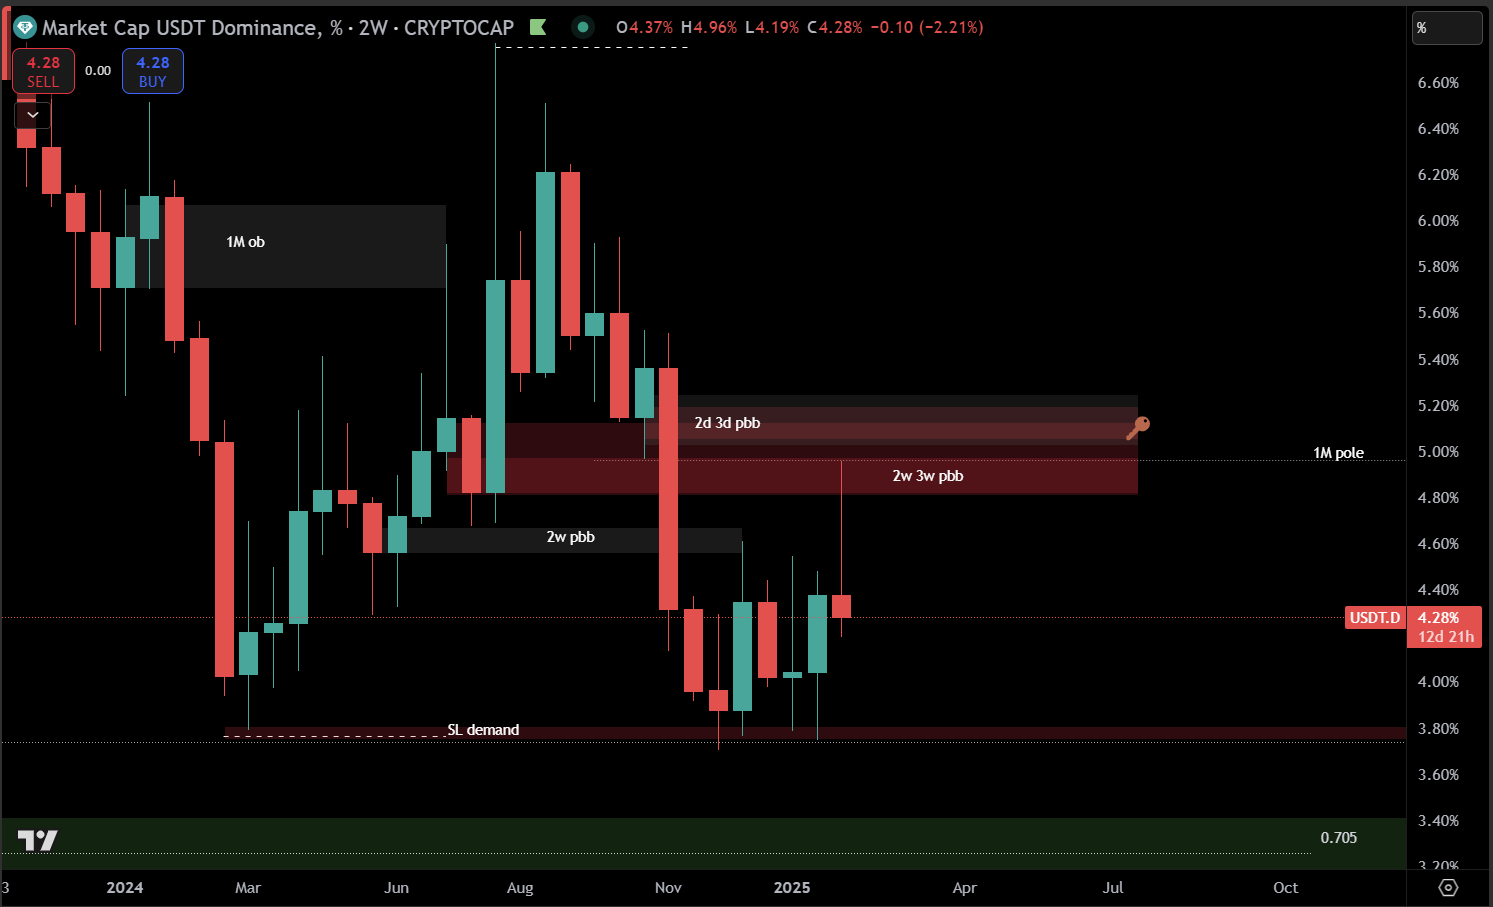
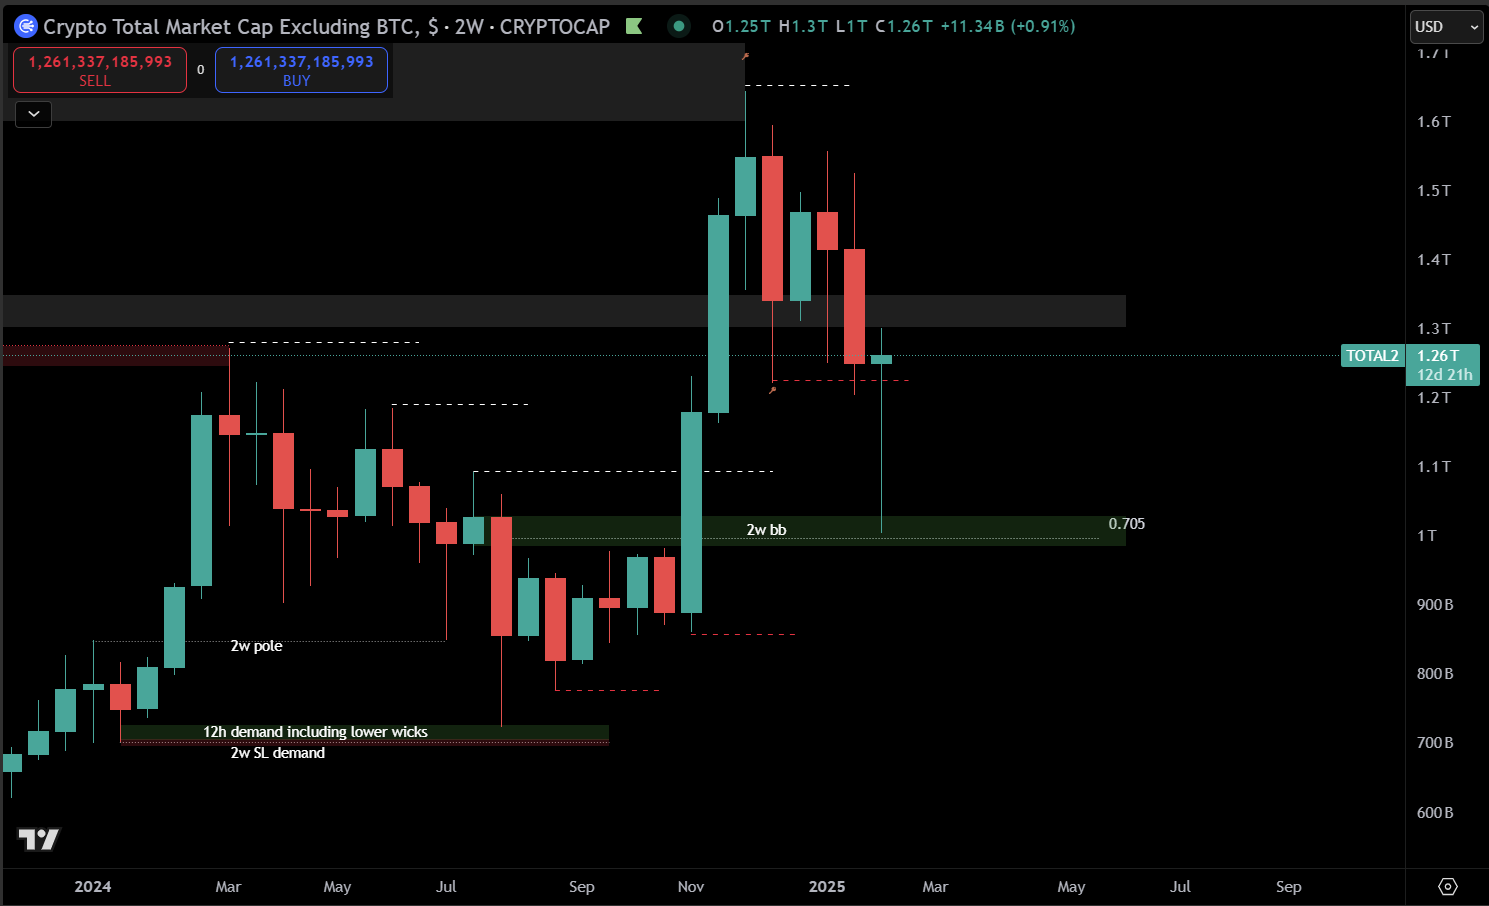
It's a beautiful game.
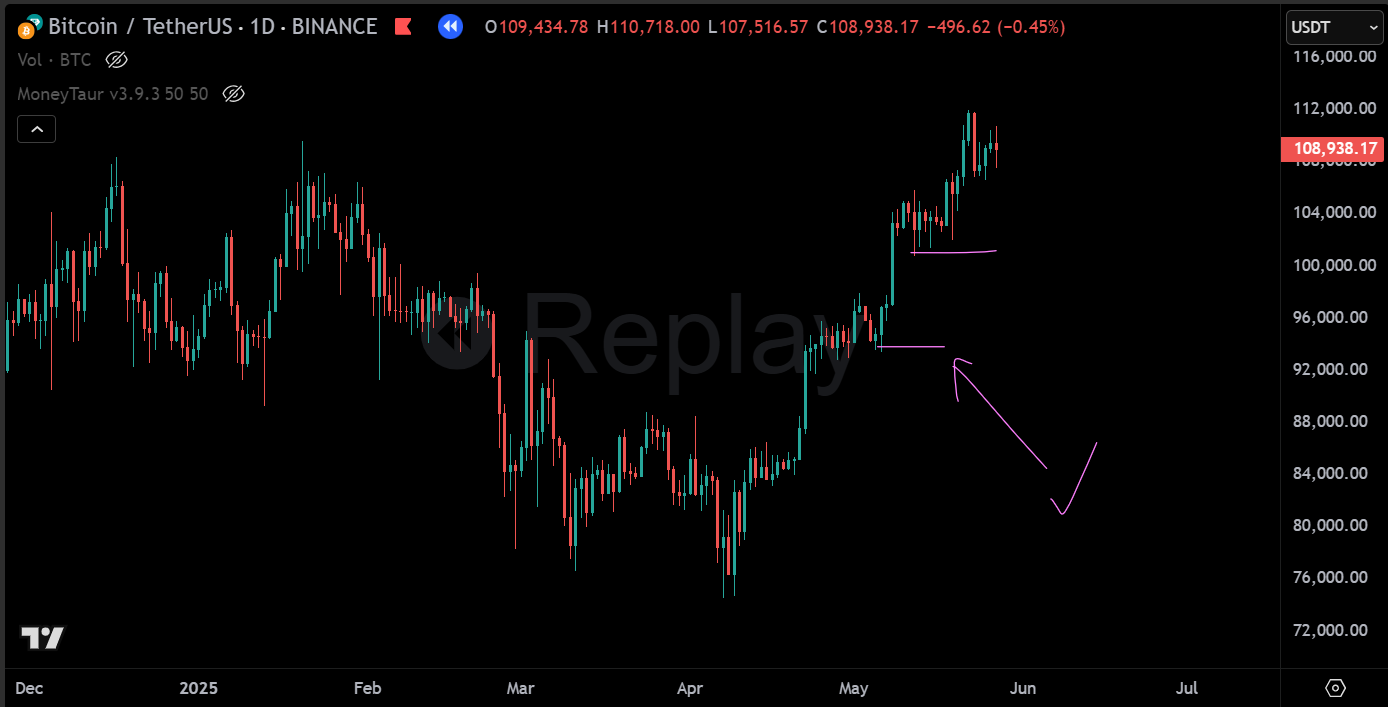
Probability, Not Prediction
[Feb 28, 2025] Bitcoin update — trailing stops wide from CME gap.
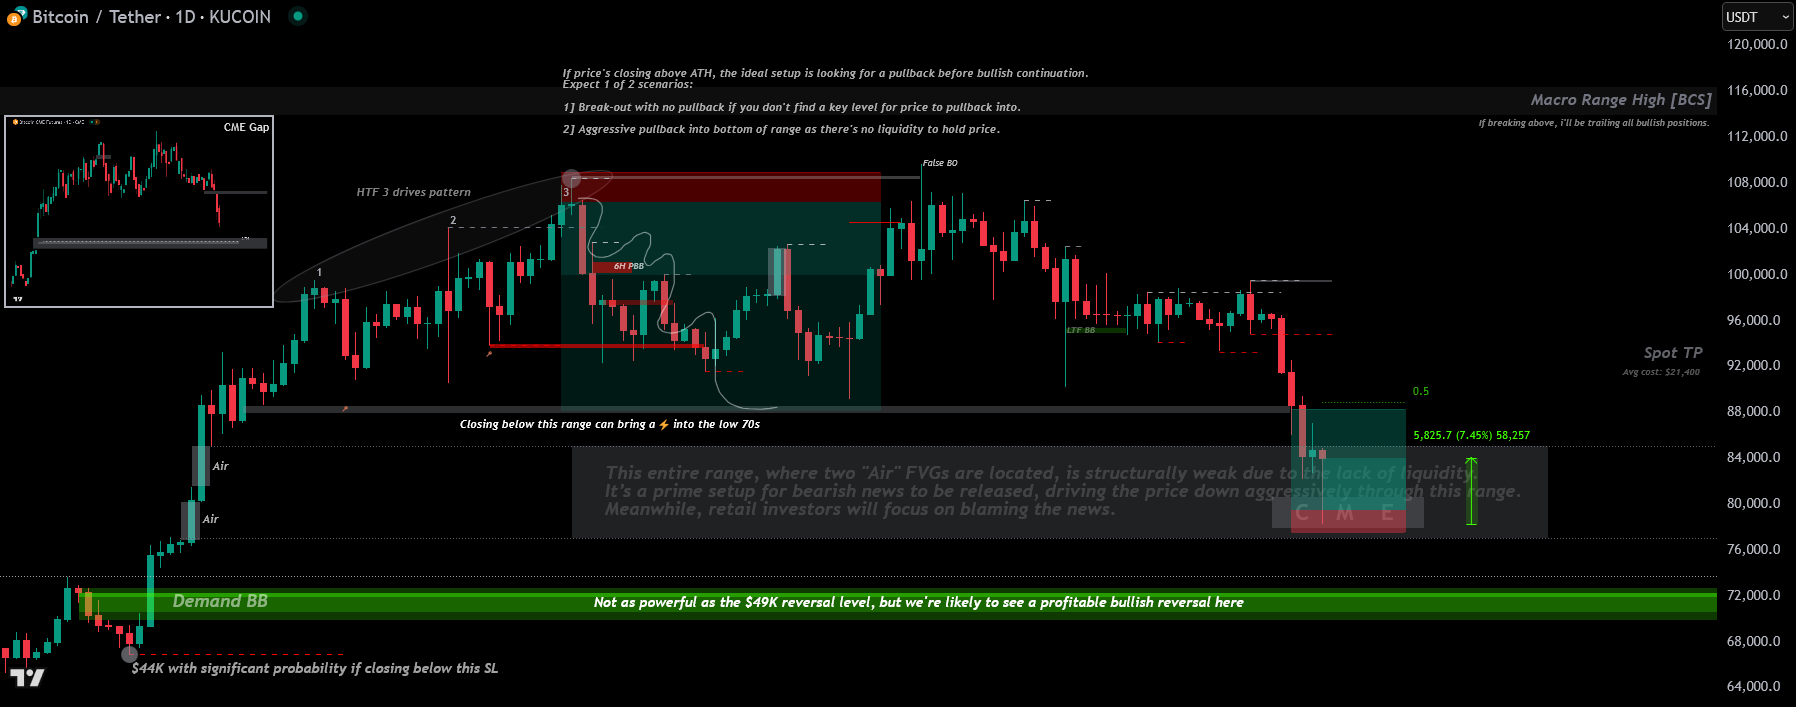
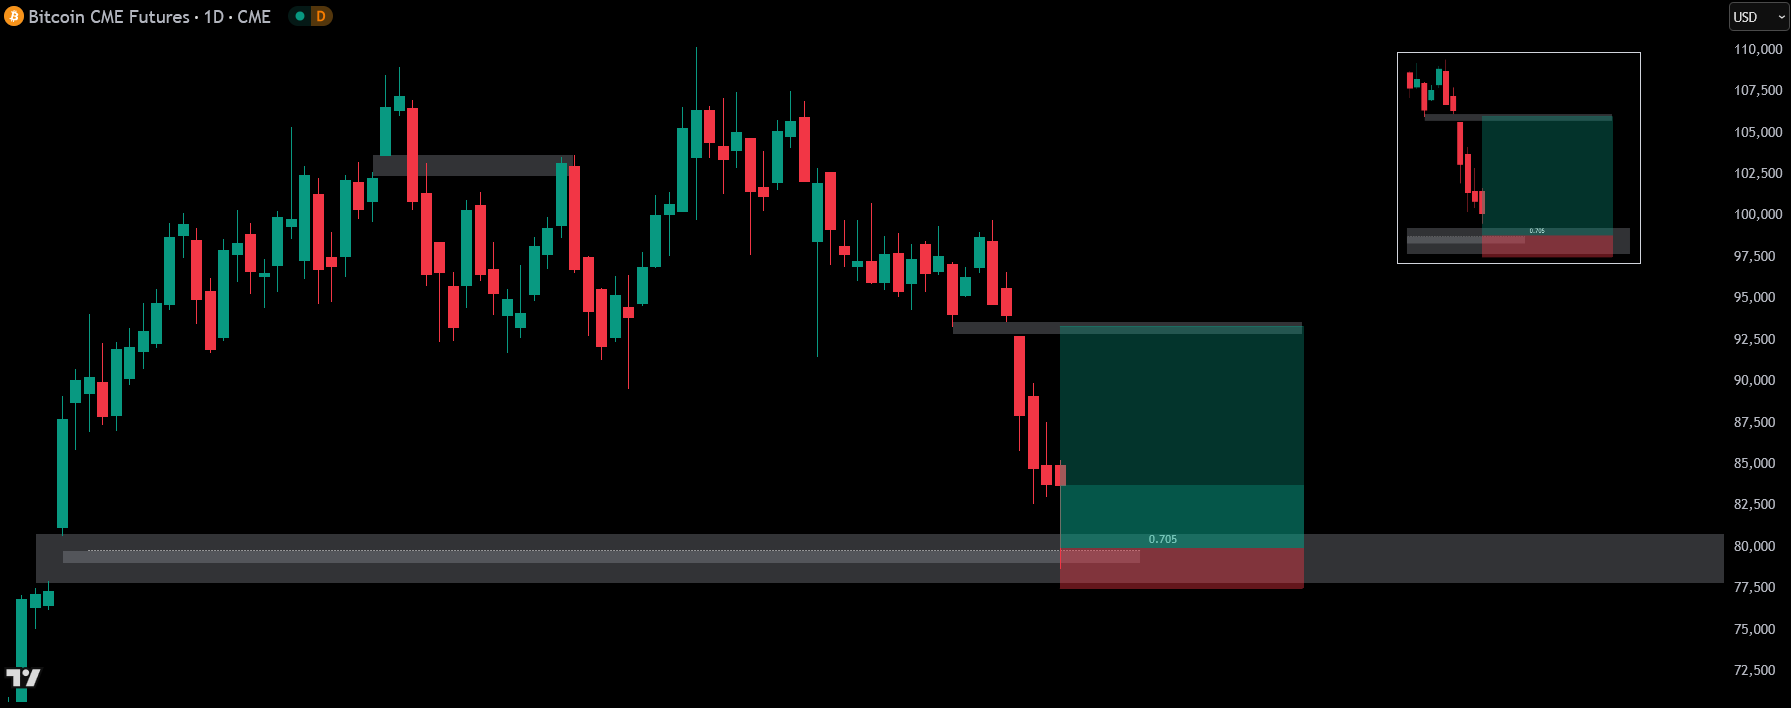
Another ⚡️ didn't strike, exchanges didn't ❄️… so does that mean the bottom isn't in? Instead of fixating on a single event as confirmation, map out the most probable scenarios, position yourself accordingly, and execute based on what unfolds. Avoid analysis paralysis. Adapt and act, or you'll always be three steps behind.
More Key Level Examples
[Oct 2, 2024]
Some key levels I'm watching. What I'll consider them — between scalp or MTF/HTF good opportunities — depends on how I see the market when the levels hit.
BO
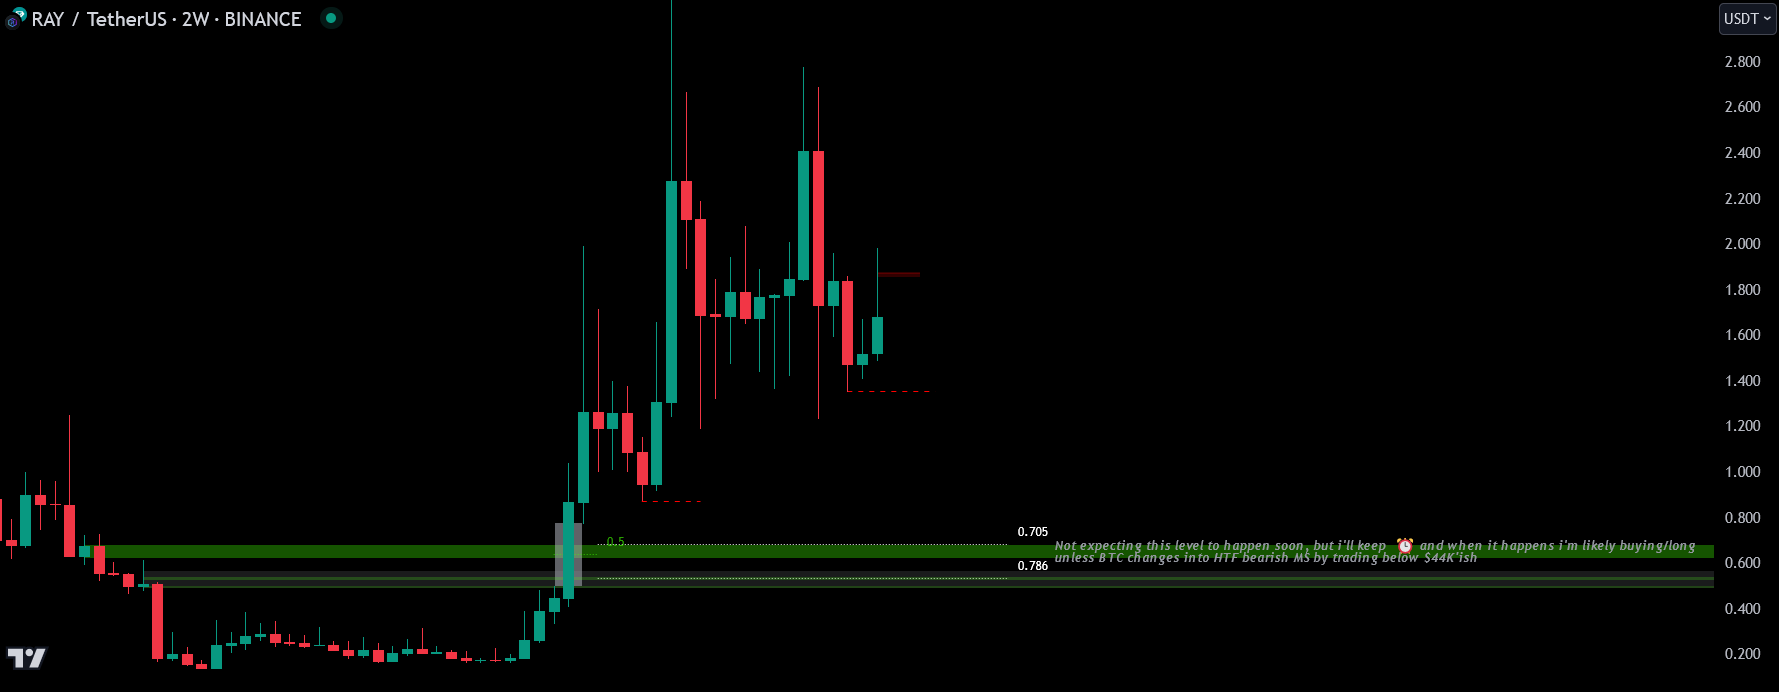
Why would the first level on RAY be more optimal than the lower second one — is it because the OB/BB is already partially taken?
2W vs lower TFs.
ZEPH and HTF Accumulation
[May 19, 2024]
ZEPH ran 200%+ after many sold the exact HTF 2023 accumulation level, right before a parabolic run — because they don't even open a chart and look at a good R:R opportunity.
Such HTF key levels are where you take risk rather than panic-sell. They usually take months to give such opportunities, yet many panic instead of focusing on the best entry levels at HTF Demand (and the best exit levels at HTF Supply).
These levels are what you wait for. They can fail, but at least you can risk up to 10–20% of your position if you use a stop-loss for the key level only, instead of riding your bag into -90% with no R:R assessment and no 🔷Stop Loss. The best investors and traders in the world use stop-losses. Why don't you?
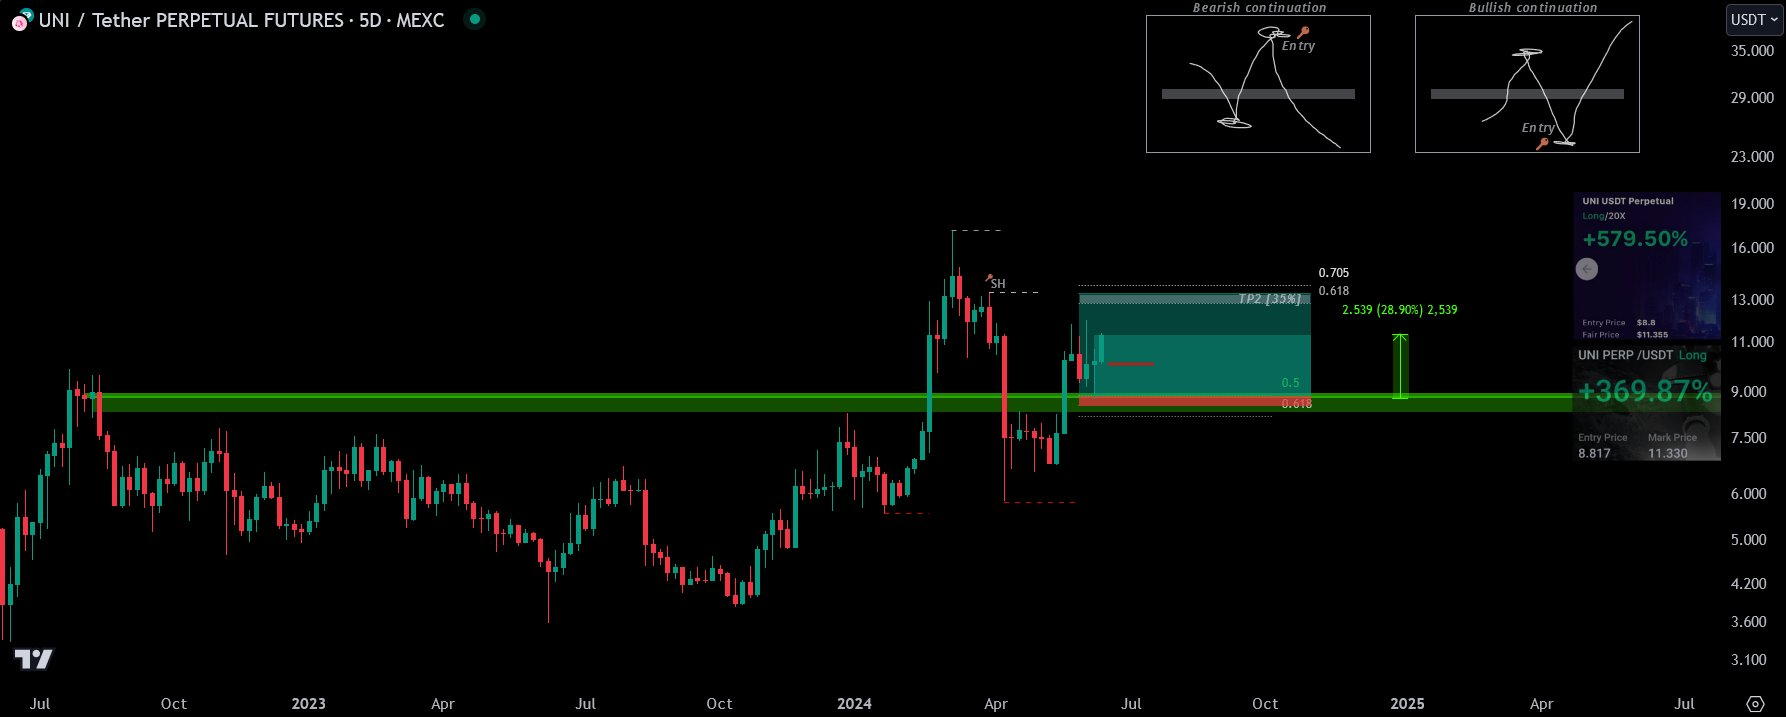
If you took the risk and bought near the latest bottom, you now have a good opportunity to trail your first stop-loss. TA-wise, bullish MS is confirmed when closing 12H+ above the previous 🔑 SH.
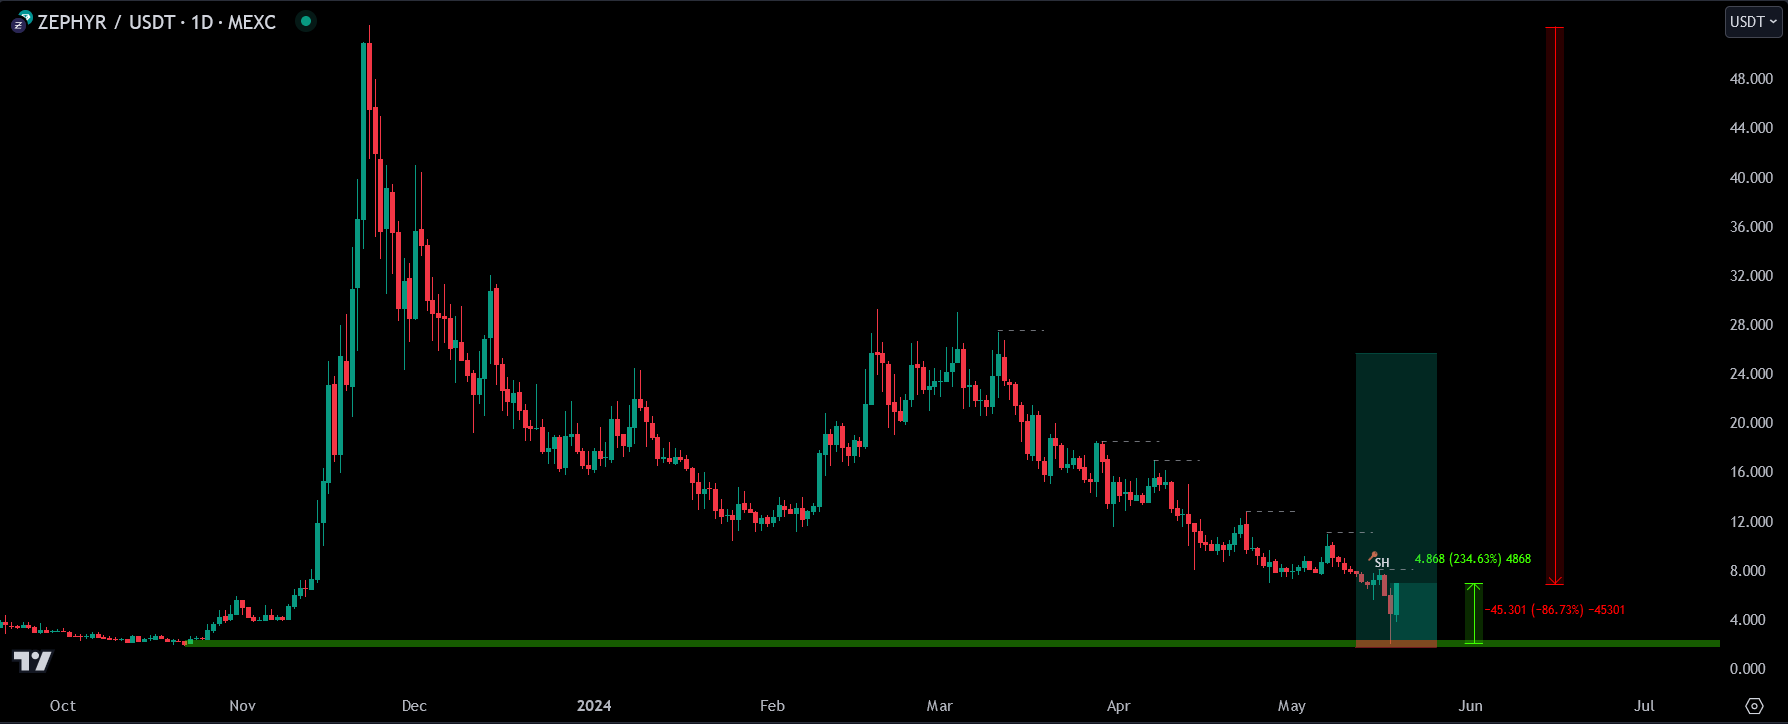
At 2023 lows… so let's say you have a buy order at 2.50 — what would in this case (extreme volatility) be your stop-loss?
Tight, covering just the bodies found on 2023 lows. There's always much higher risk on micro-caps vs. large-caps. If the coins are listed on futures with significant volume, they'll often wick past SL before reversing (SL hunting). When the coins aren't listed on futures, the reversal is often clean (no wicks).
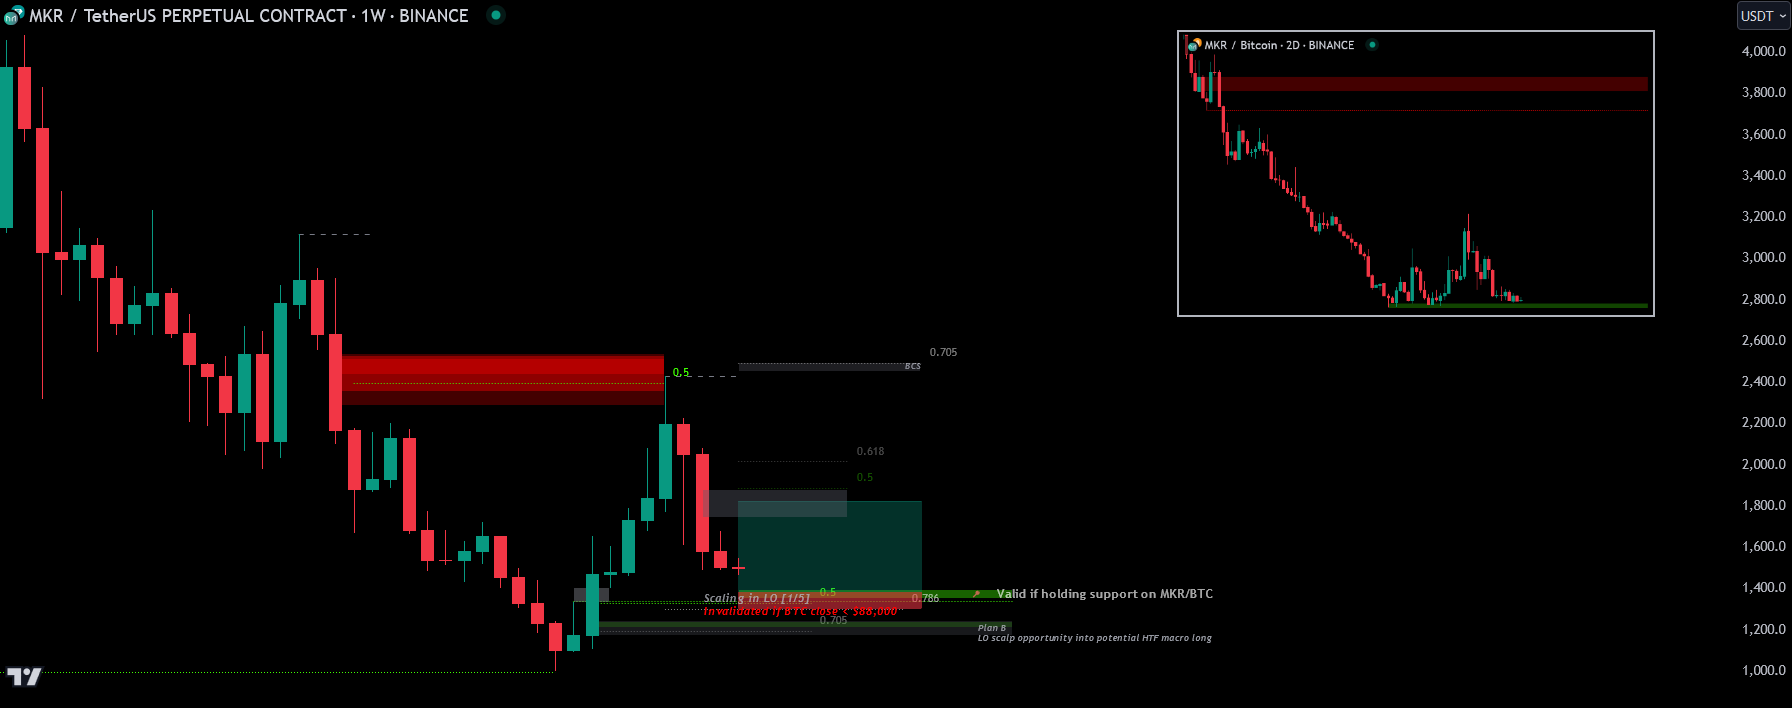
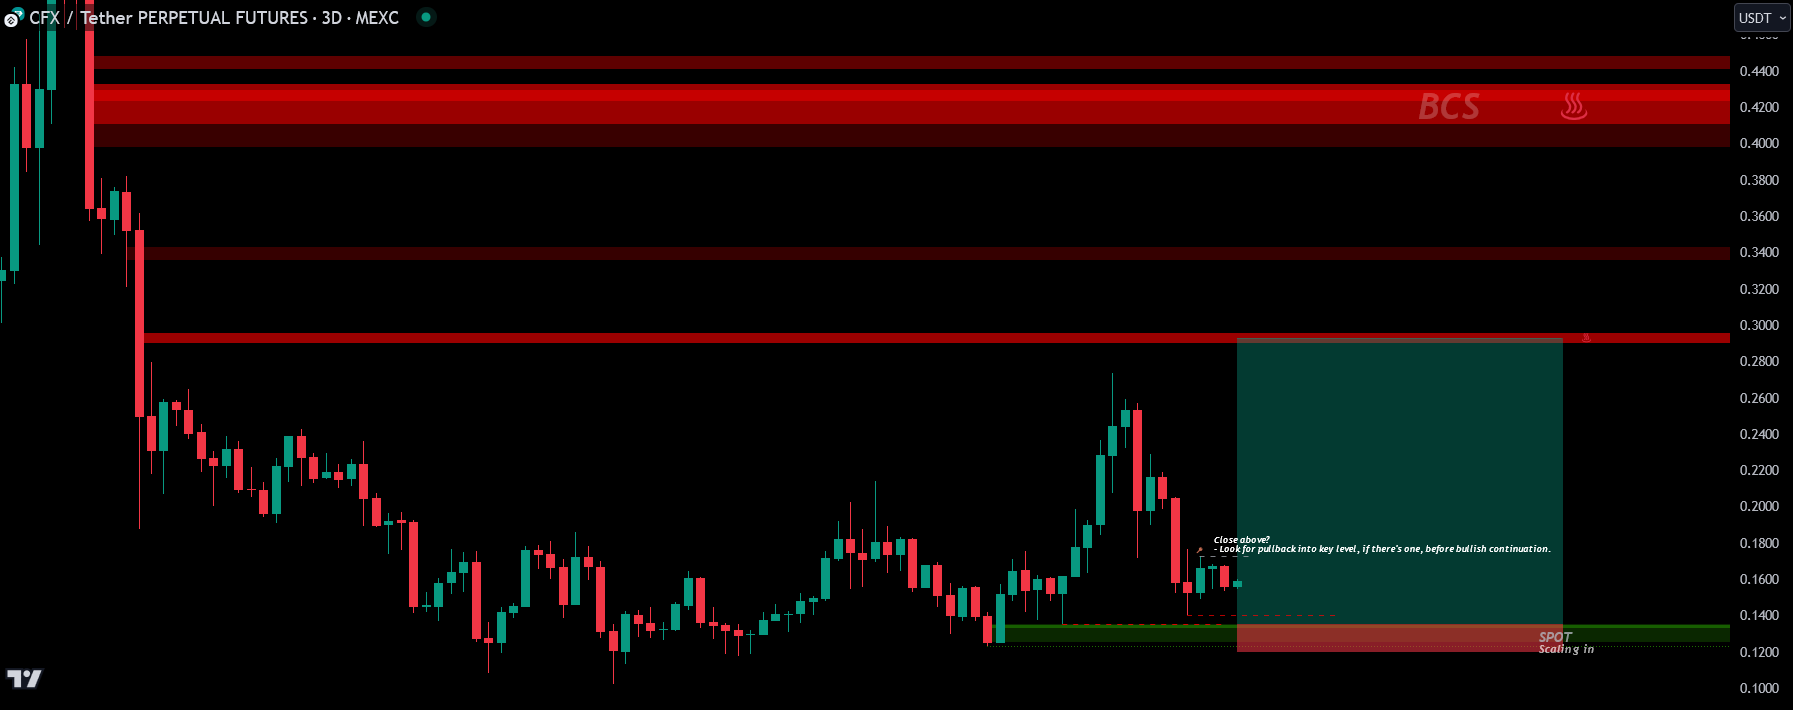
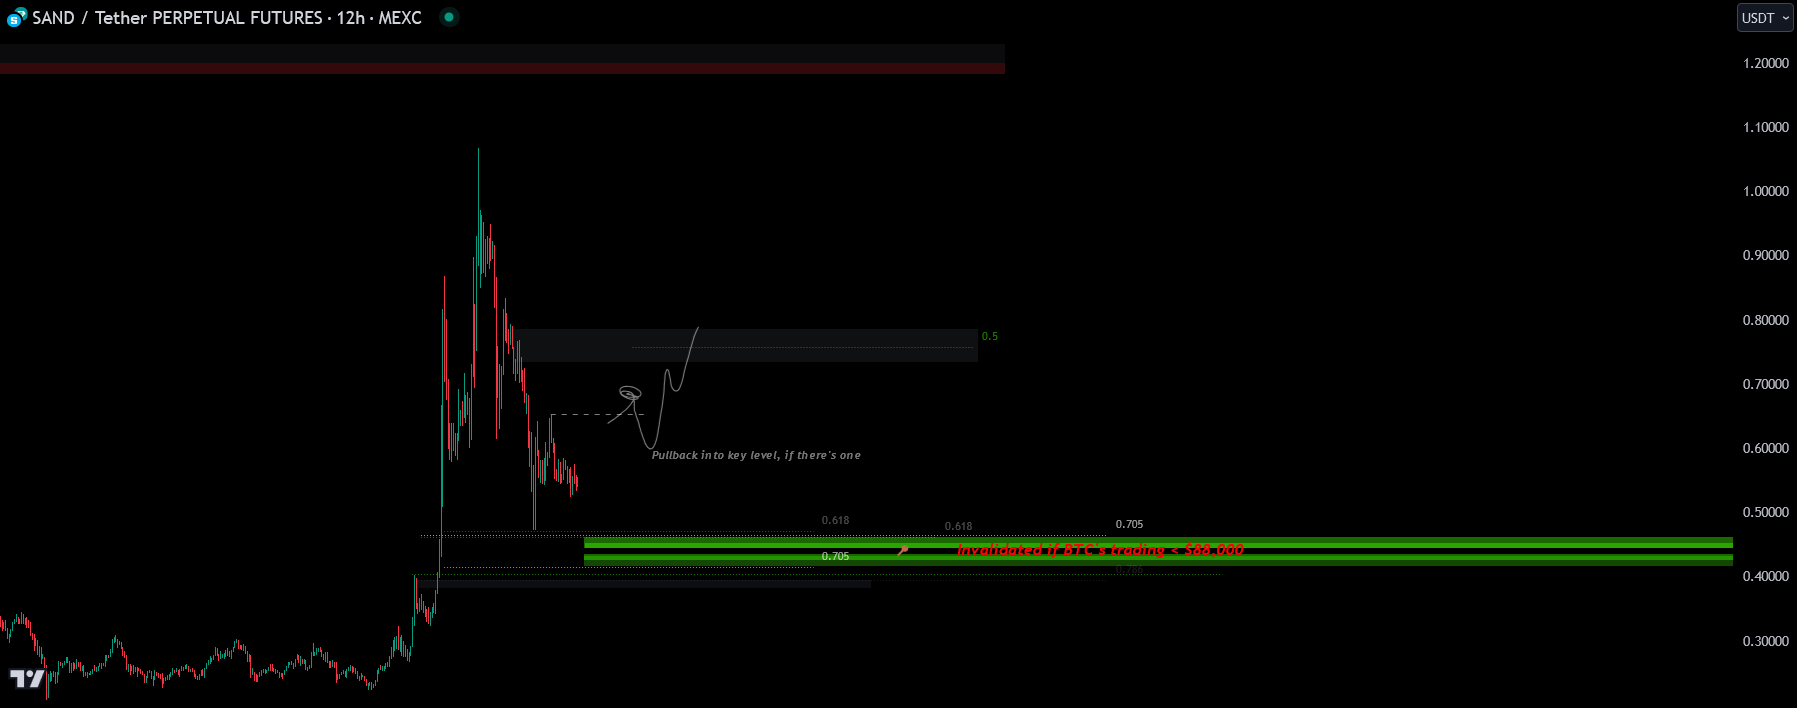
More HTF Key Levels
[Jan 1, 2025] — HTF key levels on MKR, CFX, SAND.
[Jun 25, 2025]
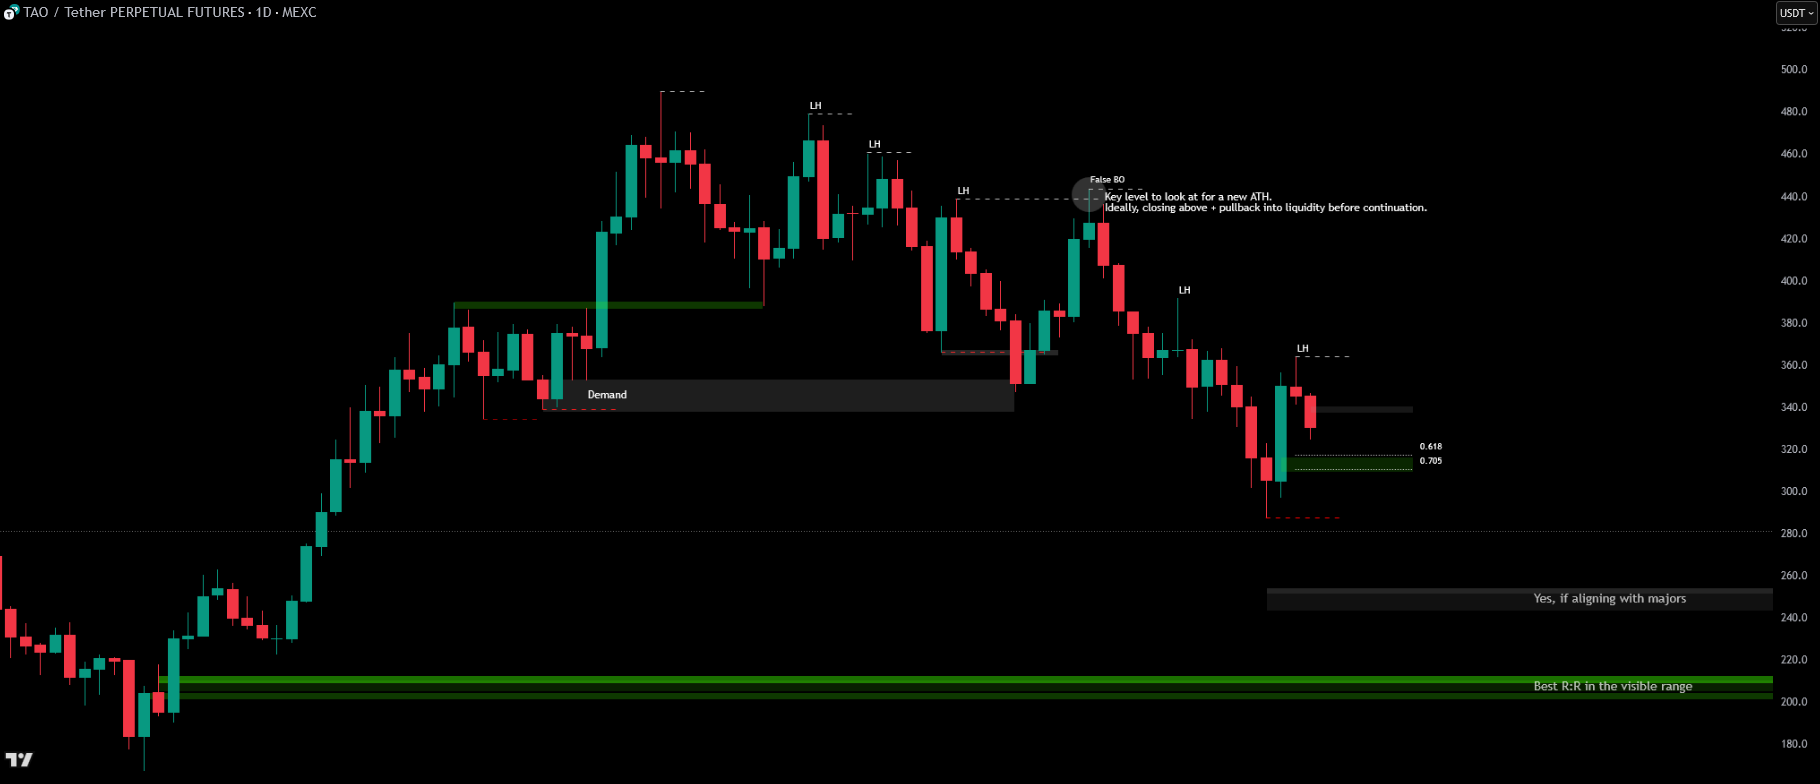
Key level for a new ATH. Ideally, closing above + pullback into liquidity before continuation.
[Nov 3, 2025]
[Nov 13, 2025]
Code Law, Restated
Three things to walk away with:
One — the trend is your friend until the end. HH + HL on the higher timeframe means you ride. LH + LL on the higher timeframe means you protect. No asset is immune.
Two — bodies decide breaks, wicks define levels. A wick at a swing high doesn't break it. A body close past it does. A wick weakens the opposing swing. Don't confuse the two.
Three — HTF dominates LTF. Always. Internal structure shifts give early clues, but they don't override external structure until they cascade up. The domino runs blue → red → black, and you wait for the chain before committing size.
Master this and you stop fearing price action. You start to see the game for what it is.