The Timeframe Taxonomy: Micro, LTF, MTF, HTF
Before you can talk about levels, liquidity, or refinement, you need a shared vocabulary for time. When I say "HTF," I don't mean "anything above the 1-minute chart." I mean a specific band. Same for MTF, LTF, and what I call the Micro TF. Get this taxonomy straight and the rest of 👑Timeframe Rules starts to make sense.
The four bands
In general, this is how I split the chart:
- Micro TF: 5 min and lower (also MTF')
- LTF: 15min > 2H
- MTF: 2H > 12H
- HTF: 12H > M+
That's the working definition. A 1H chart is LTF. A 4H chart is MTF. A daily is HTF. A 1m chart is Micro.
There's a question that comes up almost every time I post one of these:
HTF is 12h Minimum?
12H is the floor, but best to be Daily if Bitcoin and ETH. When the asset is a major, I prefer the Daily as my anchor before I call something truly HTF.

Why HTFs carry more weight
The single most important property of timeframes is this: the higher the timeframe candle body, the more liquidity it holds. The lower the timeframe candle body, the less liquidity is contained within it.
A 1D candle represents more volume than a 4H candle, and both hold more volume than LTFs. That's why fewer false signals appear at HTF levels — there's less room for a wick to be a fakeout when the candle behind it represents a real day's worth of order flow.
HTFs can represent billions of dollars in reversal pressure, while LTFs might only reflect a few million. That's not a metaphor — it's why my largest size positions go on HTF plays, and it's why I rarely fail on any HTF trade. A weekly candle carries significantly more liquidity than a daily, 12h, 8h, or 4h candle. These setups can take time to play out, but the 24/7 nature of this market gives you thousands of opportunities. Stop chasing. Improve your game instead.
The flip side: LTFs can fail for obvious reasons — less liquidity, less reversal pressure, less ability to refine the level. Yet my success rate on LTFs is still high. Not for beginners though. Master HTFs first.
If you want to play alongside whales and bots, play on HTFs and you'll end up seeing the true and most successful "patterns" in this game. Lagging indicators aren't necessary — trading bots, responsible for the largest moves in this market, prioritize liquidity and don't rely on them.
How many touches each band can absorb
A practical consequence of the liquidity asymmetry: HTF levels survive multiple hits, LTF levels usually don't.
So LTF levels have low probability to hold after the first touch, MTF levels two touches, and HTF three touches?
LTFs = higher risk vs HTFs. Less liquidity, less reversal pressure. HTFs can get 2, 3, or even 4 hits and still reverse price, yet weaker with each hit. LTFs might handle only one. (MUBI)
This is why position sizing scales down with each subsequent touch on the same level:
- 2nd touch @ HTF 🗝️ equals 1-2% size instead of 3-5%
- 3rd touch @ HTF 🗝️ equals 0.5 to 1% size or no play.
More often than not the third touch is a no-play for me, because there are too many coins with untouched fresh levels out there and too high a risk of the level not holding.
Confluence: stack the timeframes
Day trading is often viewed as a riskier alternative to investing or swing trading. When trading on shorter timeframes, it's not enough to analyze one timeframe in isolation. The window to enter is small, and being slightly late means missed opportunities.
To increase your chances of success, look at more than one timeframe. If you see a promising trade on a 15-minute chart, also check the 1-hour and 4-hour. Zoom out, examine the bigger picture. You'll find opportunities that aren't apparent on smaller chart timeframes alone.
A full analysis looks like this:
- W > D > 4H < LTF.
- Mark important levels. Set alerts. Enter. Profit. Exit.
- 📝Journal everything and learn about yourself / your game.
Or, walking down the ladder more carefully:
- M > 2W > 1W > 5D > 3D > 1D > 12H
- Refining: 8H > 4H > 2H > 1H
- Ultra-refining for 30R+ opportunities: 1H > 30min > 15min
On what timeframe are you on to confirm the level though?
HTF (refined) > MTF (refined) > LTF (refined) > MTF'
The principle is simple: the more confirmations across different TFs, the more powerful the level. 🔷Risk Reward scales with confluence.
But I think the same concepts (OBs, FVGs, etc) could be used in different TFs. At least for highly liquid coins, indices or FX.
Correct. The same applies to all TFs on all markets. The higher the TF, the higher the % success rate with the right concepts.
For max accuracy and refined entries into huge R: R, all TFs should be analyzed — from monthly all the way down to 15min, if PA shows confluence all the way into micro TFs.
How many timeframes is "enough"?
To even consider getting close to elite, you need to scan through 14–18 timeframes (sometimes more) on the coin you want to long or short on any market.
Do you ever look at TF like 8D or 11h? Timeframes that at first glance seem a little odd.
If I'm looking to fully confirm the level, yes. If I don't need more than what I've already found, no. Sometimes I look through 30+ different TFs.
I've been checking 10–20+ TFs for almost every trade, which can be overwhelming. Then I see others killing it with just a handful of TFs.
As it should be. You dig until you find. It's not mandatory to check 10+ timeframes.
Is there a reason why the daily was preferred over the 9d on USDT.D?
If one's going to look at every single TF, he will not take any trades.
That's the balance. Dig until the level is confirmed, then stop digging.
"Price is fractal" — no, it isn't
Price is fractal. 1m or 1M is the same.
Not at all. You're oversimplifying. Since when does a 1 minute body hold the same volume and liquidity as a 1 month body? HTF game is where the big $ is at and where there's the least false signals/fake-outs. False Breakout
Same concepts, yes — OBs, FVGs, Supply and Demand, imbalance zones — but the power of each is a function of how much liquidity sits behind the candle that formed it.
Trading bias by HTF trend
Once you have the HTF context, all your LTF/MTF decisions inherit from it.
MTF/HTF downtrend? Look for retracement before continuation. Bullish reversals into 🗝️ levels should be treated as scalp or short-term opportunities.
MTF/HTF uptrend? Look for pullback before continuation. Bearish reversals into 🗝️ levels should be treated as scalp or short-term opportunities.
The same logic applies to BTC dragging the alts:
Bitcoin 🩸? Alts long scalps invalidated. Instead of long positions, look for retracements into 🗝️ levels before bearish continuation.
Bitcoin 🚀? Alts short scalps invalidated. Look for pullbacks into 🗝️ levels before bullish continuation.
Don't go on LTFs and fight the HTF trend. Should be common sense. (❗ BTC Rules / Invalidation)
When such conditions are in play, scalp long opportunities should be invalidated and only HTF/MTF opportunities should be considered for entries. (BVOL24H)
Order types follow the timeframe
Set Alerts near all ♨️Key Levels🗝️. Alerts can start as far as 15% away from a level.
- MOs if scalps, LTF, and MTF plays.
- LOs if HTF semi-optimal/optimal plays.
If the levels are found from HTF > MTF > LTF (optimal or semi-optimal findings), you can consider leaving a limit order for a small % of your account. When your alert hits and you're live trading, take a decision on the actual size you want to play with. 🔷Position Size
If it's findings from MTF or LTF, don't use limit orders. You catch what you can if you're on the charts.
Where to start: HTF first, scalps later
Play on HTFs. Micro TFs, LTFs, and MTFs are too volatile and "erratic" for newbies to play on. Go gradually and start on HTFs. When you see yourself with good % success rate you look for faster plays.
I play on several different TFs, with different strategies and 👑Risk Management. 🎮Game Isn't Linear, neither is my thought process. I come up with different potential outcomes and find the 2 or 3 that are most likely to happen next, and prepare for each.
- Focus mostly on HTF and MTF opportunities.
- Learn from the analysis on the scalp opportunities I share but be careful with them.
- Even I have to be extra-focused on those, and my hit rate isn't the same as HTF, so you would incur a much higher chance to fail.
- Go through "levels." HTF is slower, safer, and normally more profitable. Master your game there. Later, when your success rate is good, you can start playing the "tougher league."
You just need 2 or 3 good HTF moves per cycle — buying HTF lows, selling a lot at HTF highs. Do this and your realized 100x is sorted. The problem isn't that this is hard to understand. It's that most people haven't been able to do it yet.
Don't miss out on HTF opportunities. Use some LTFs/scalp opportunities to trial/error with low risk, burn some $, earn some $, so you can progress much faster than if you do nothing but waiting for a miracle. Fail and make mistakes. You will be learning on steroids. (🎓Learning Process) You'll be ahead of the herd, and being ahead of the herd means gains. It means freedom.
LTF gave me too much anxiety.
In my opinion, if you want to play LTFs/scalps with cryptos, you must live off of this and fully control your time.
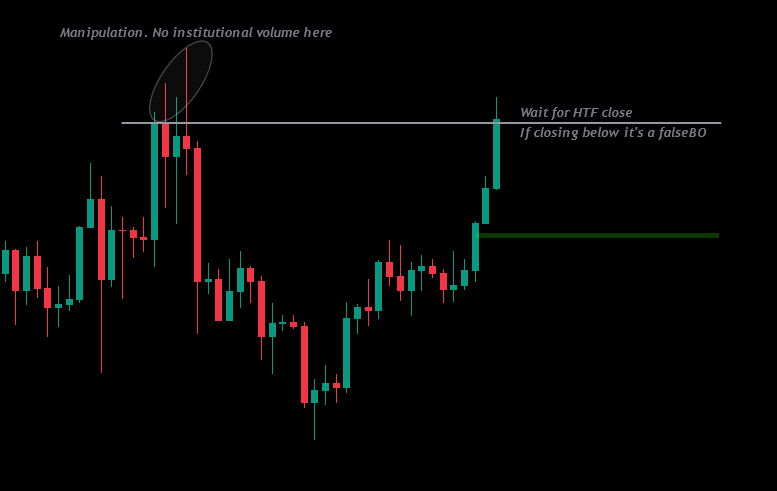
Break of structure across timeframes
🔷Break of Structure strength scales with TF, just like everything else.
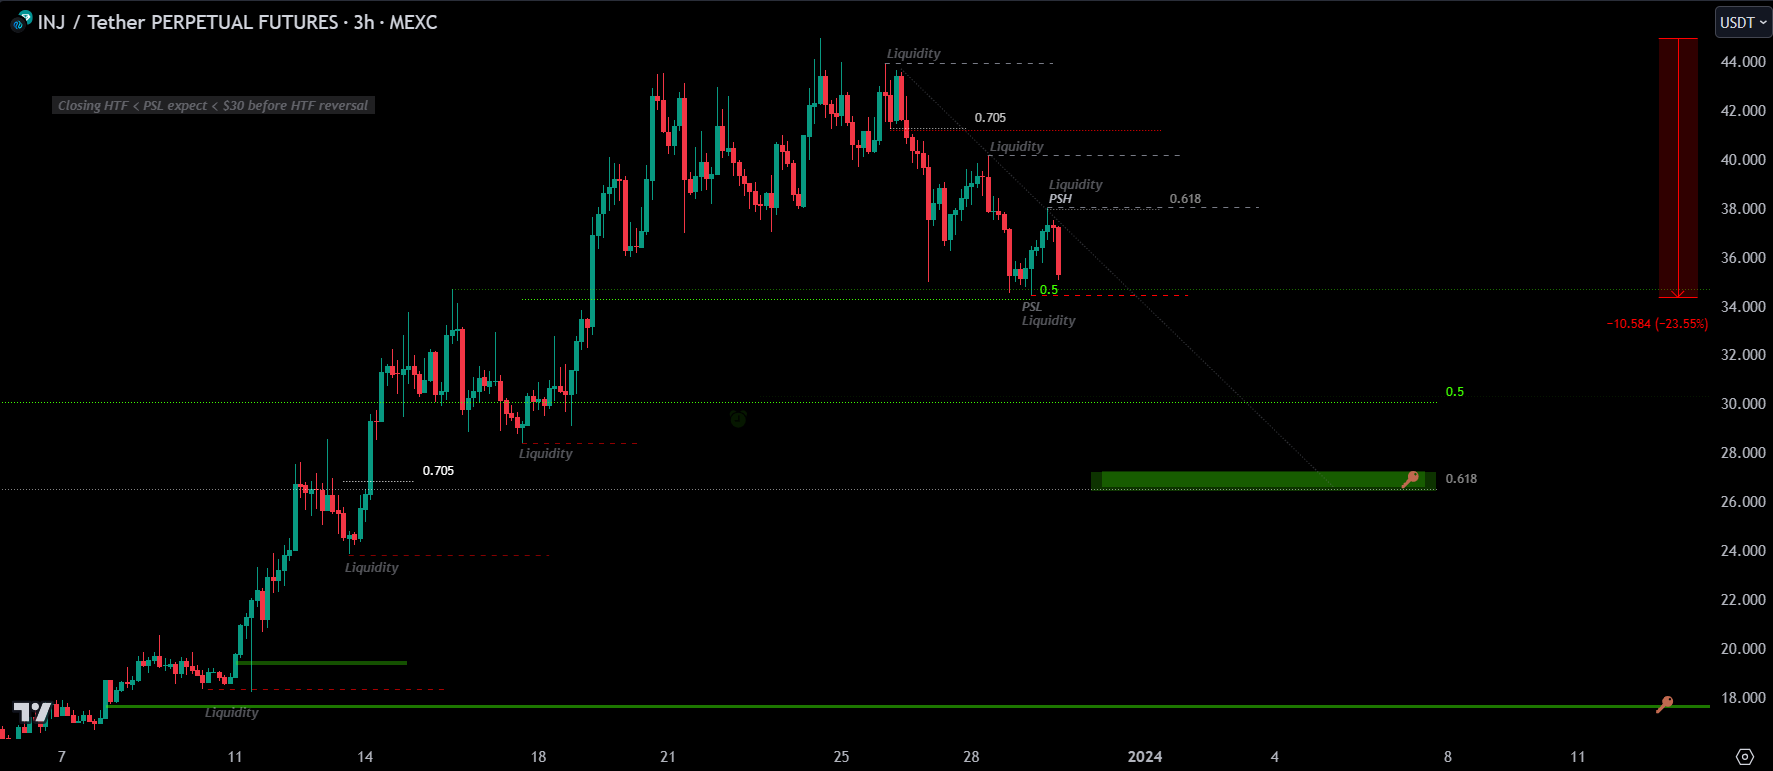
- Close MTF > PSH: Start going for liquidity at higher levels.
- Close MTF < PSL: Go for 0.5 fib (at least) of the HTF range. Ranges
Is it better to look for breakouts in same timeframes where PSL/PSH were marked, or marking levels in HTF and looking for breakout in MTF?
HTF and MTF. The higher, the more powerful. LTFs to refine entries into the best R:R possible.
The higher the TF, the more powerful the break of market structure (BOMS) is. The more powerful everything is, and your size/risk should be smaller vs HTF plays.
When there are no clean levels
A short rule for orientation:
- If there's no significant imbalances, there will be OBs and Supply/Demand fresh levels.
- If there's no OBs and Supply/Demand fresh levels, there will be significant imbalances.
- If there's none at all, it will ⚡️ into a "fresh" level and build a new trading range. Ranges
MTFs matter. On BTC, even LTFs matter.
A live BTC example
BTC [Jul 3, 2024] — "Find the most powerful FVGs and place SL above it"
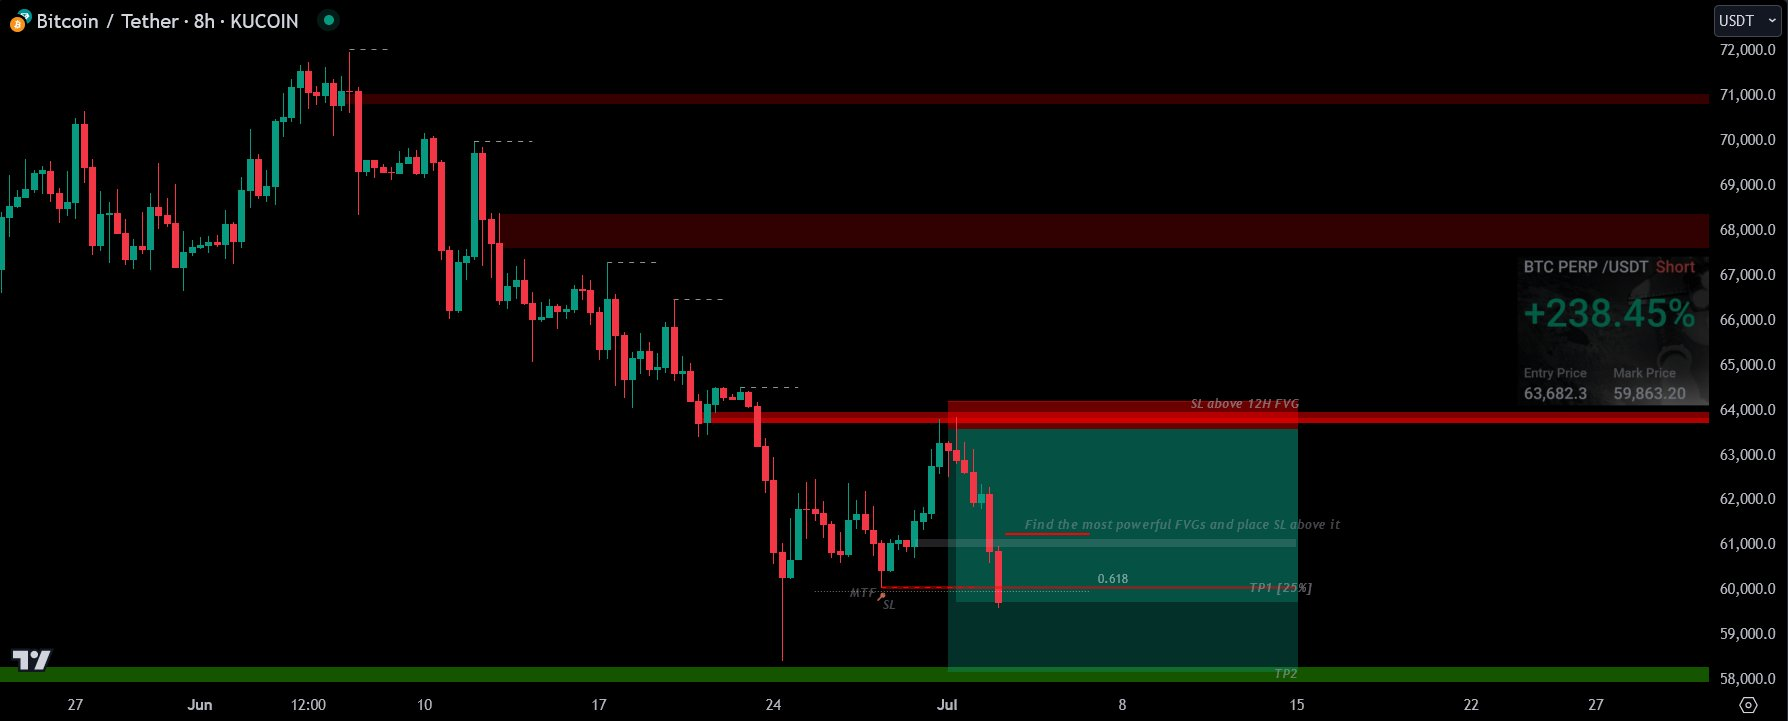
Go through timeframes and you'll notice there's no bodies closing below the MTF 🔑 SL — the level's holding for now.
What makes this such a strong FVG?
The TF, and the only significant hidden liquidity level inside the whole ATH > HTF low range.
Bitcoin context for any altcoin scalp
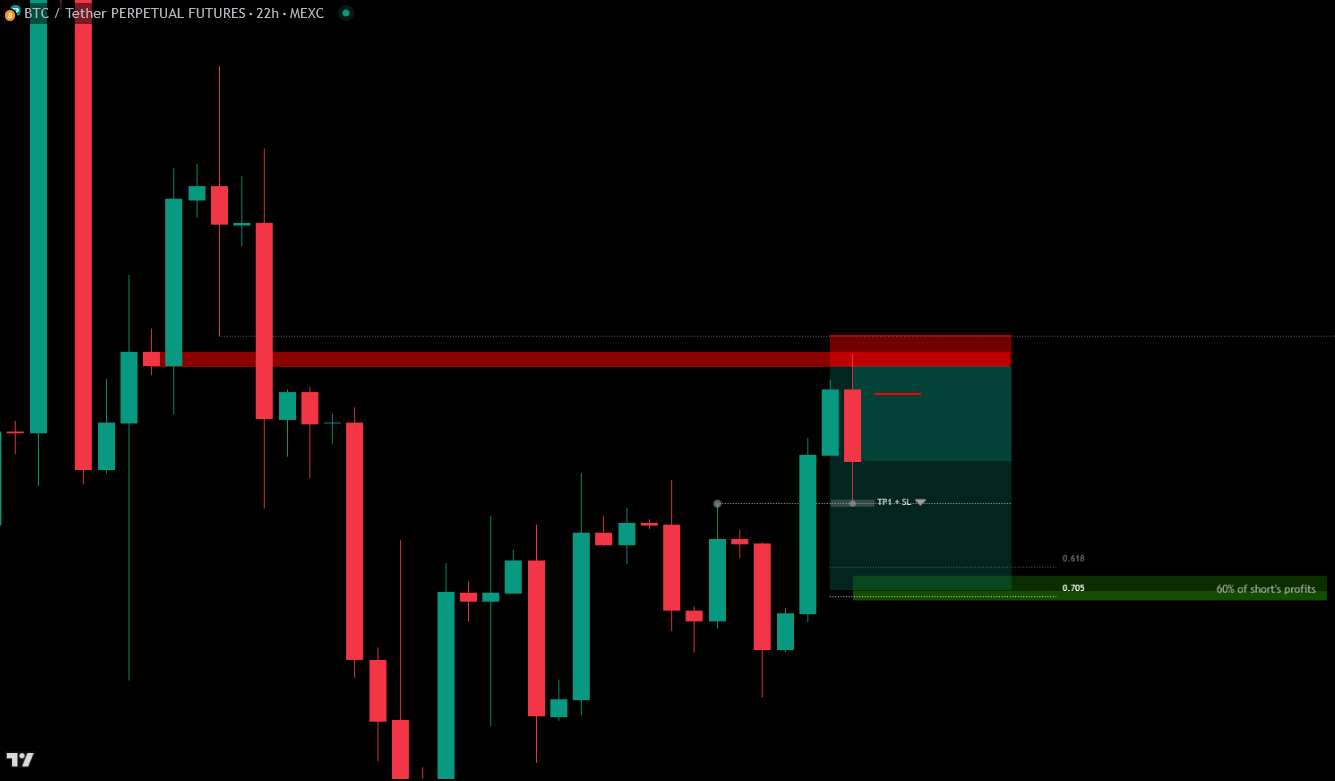
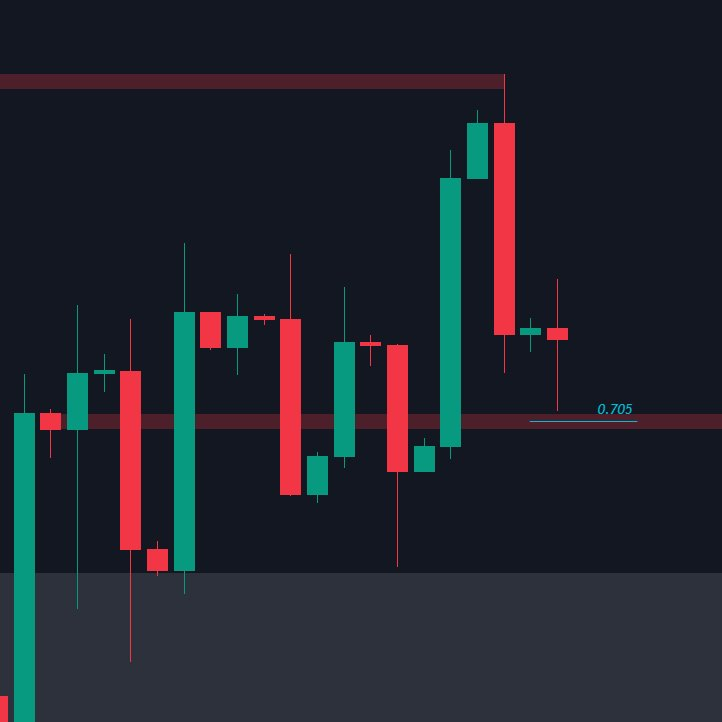
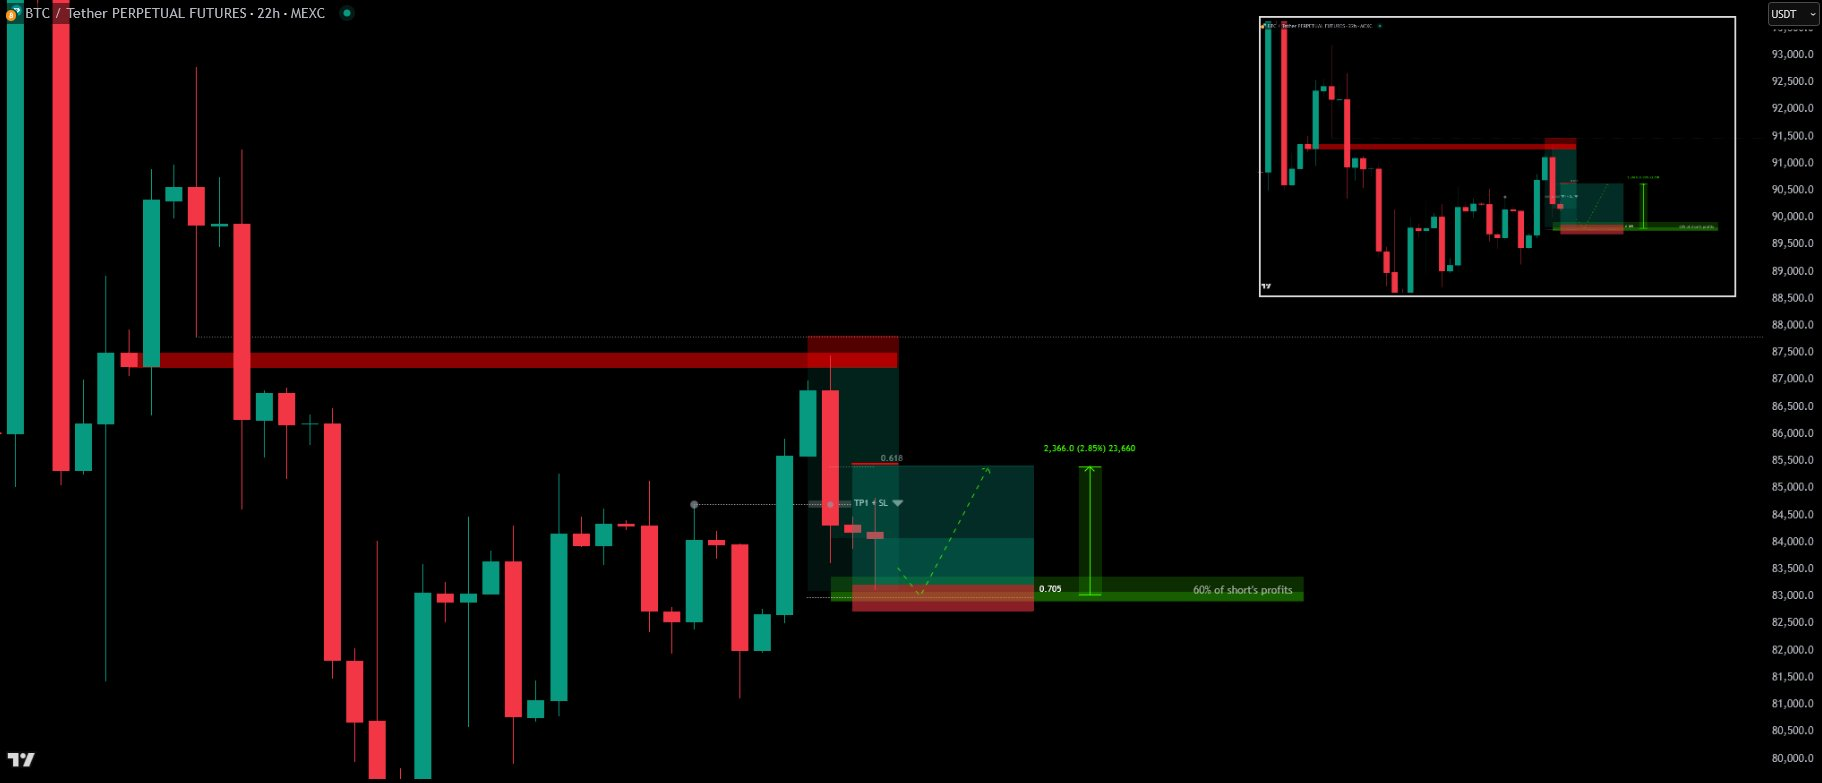
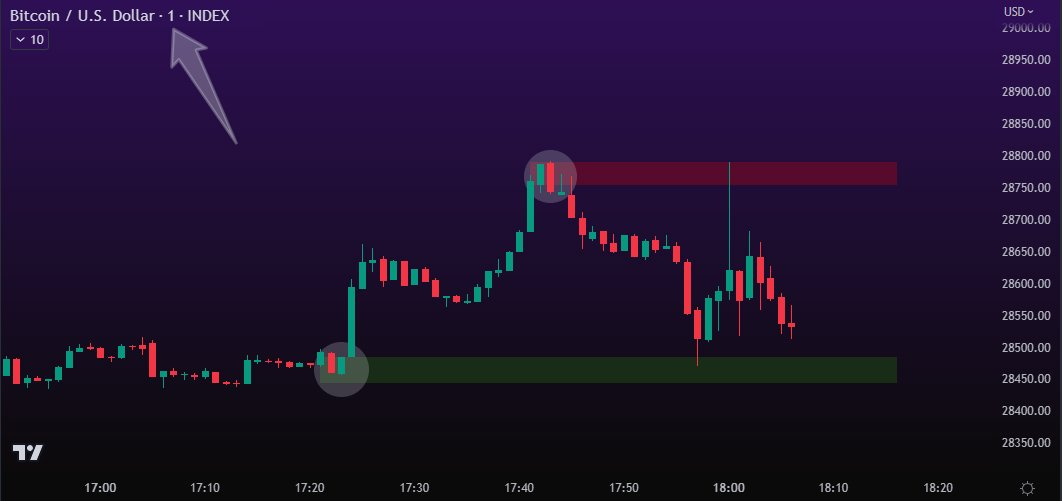
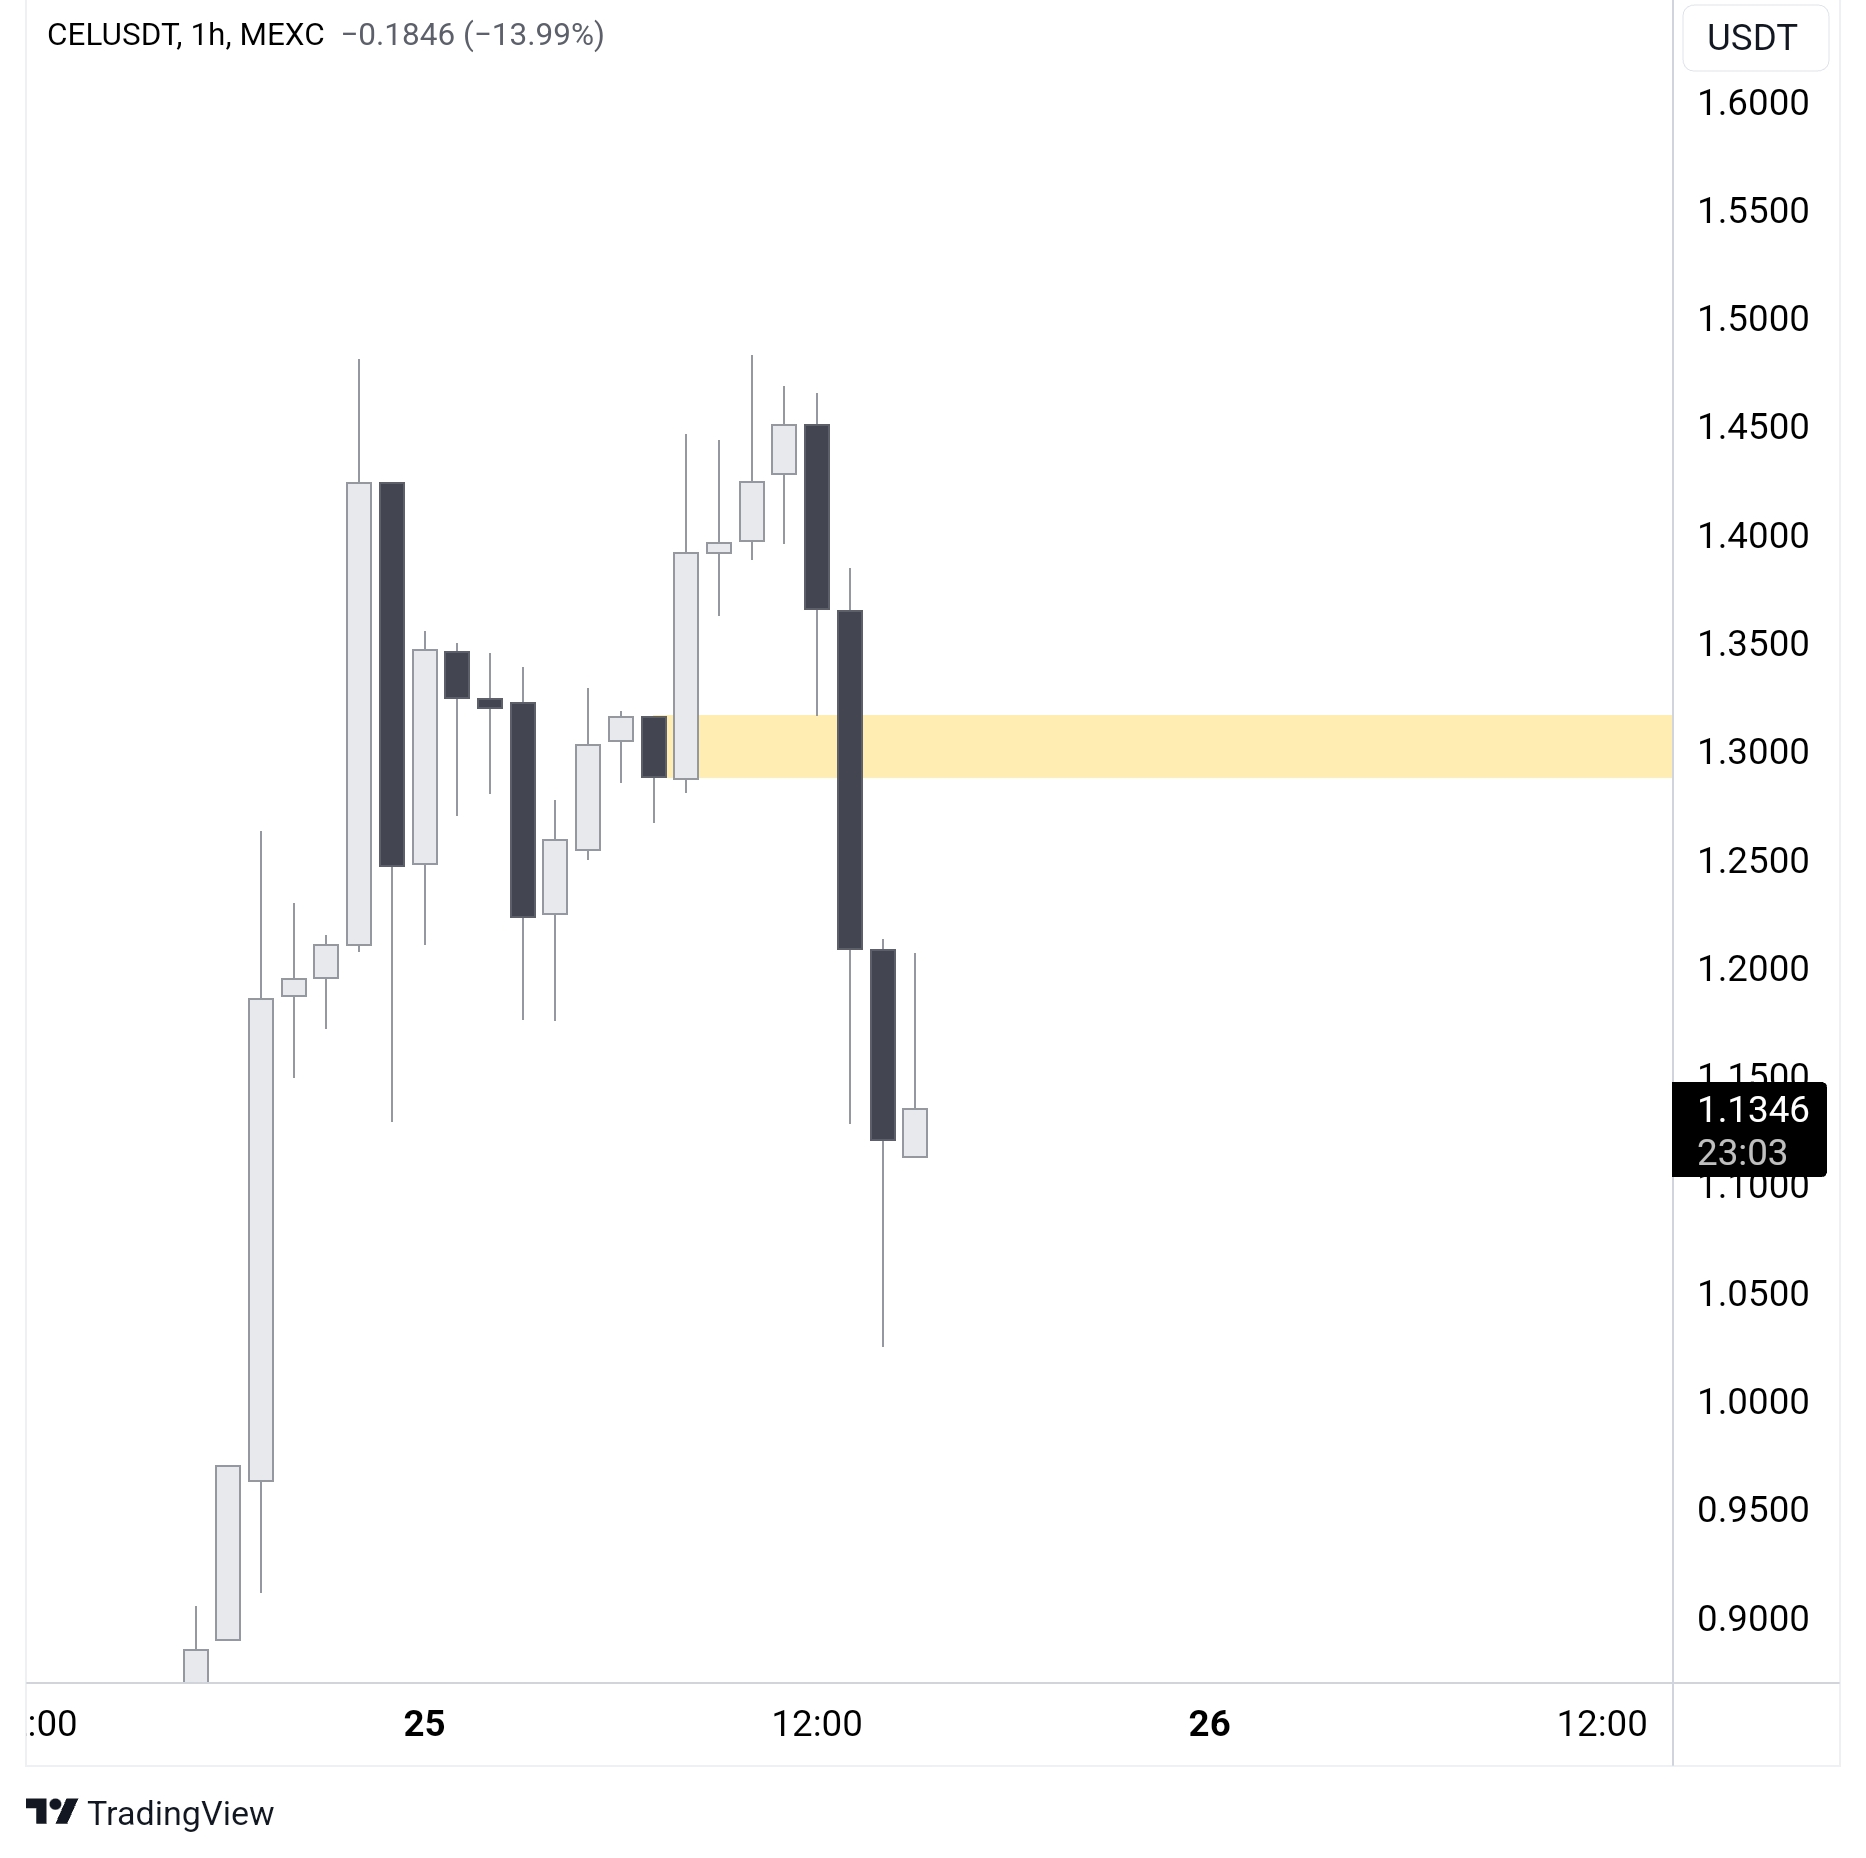
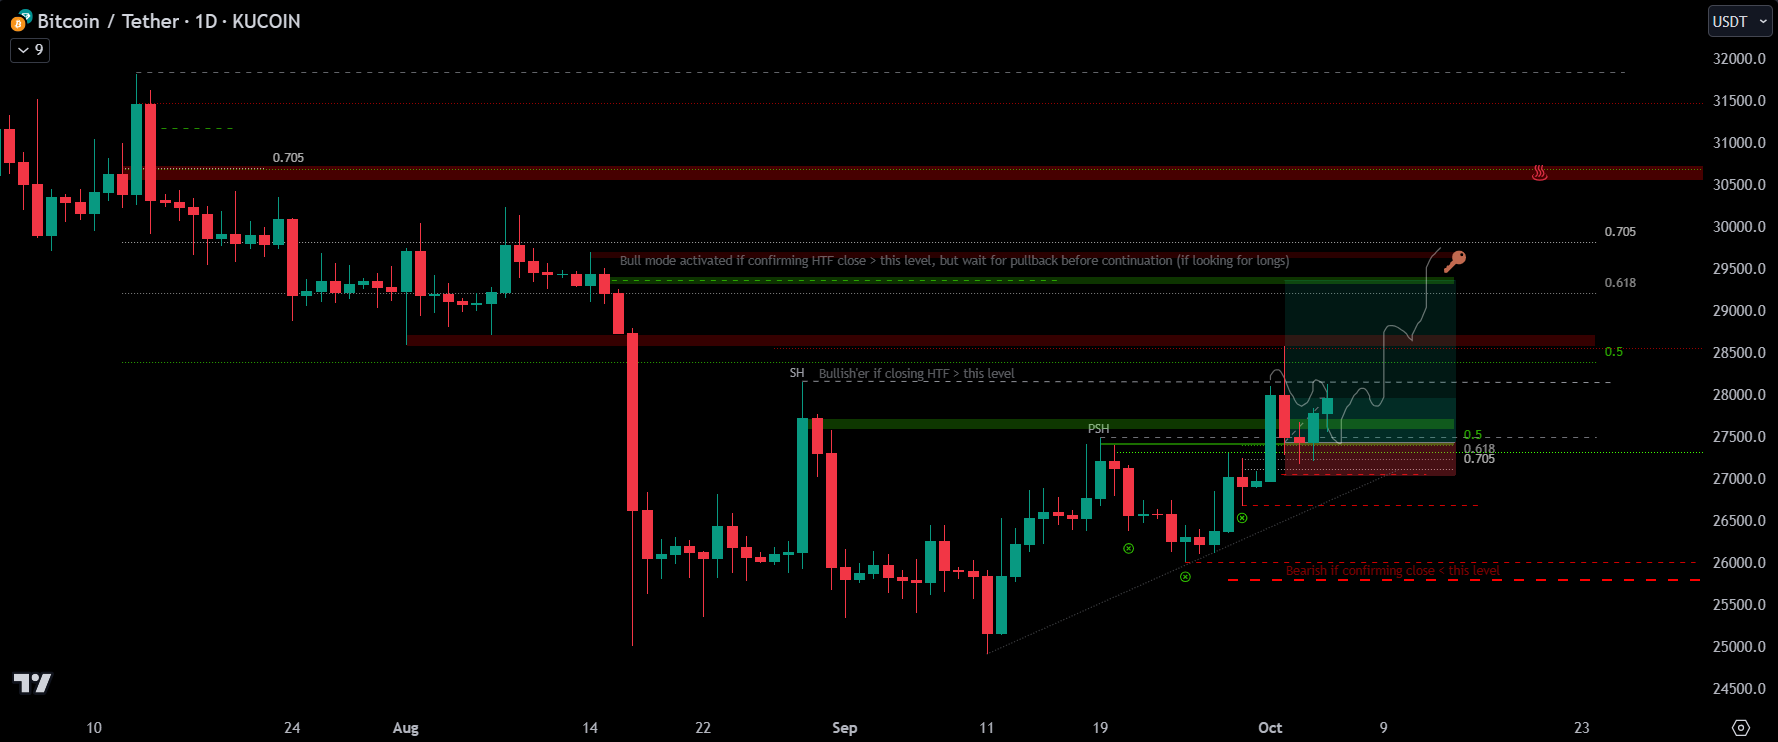
[Mar 19, 2025] #oddtf
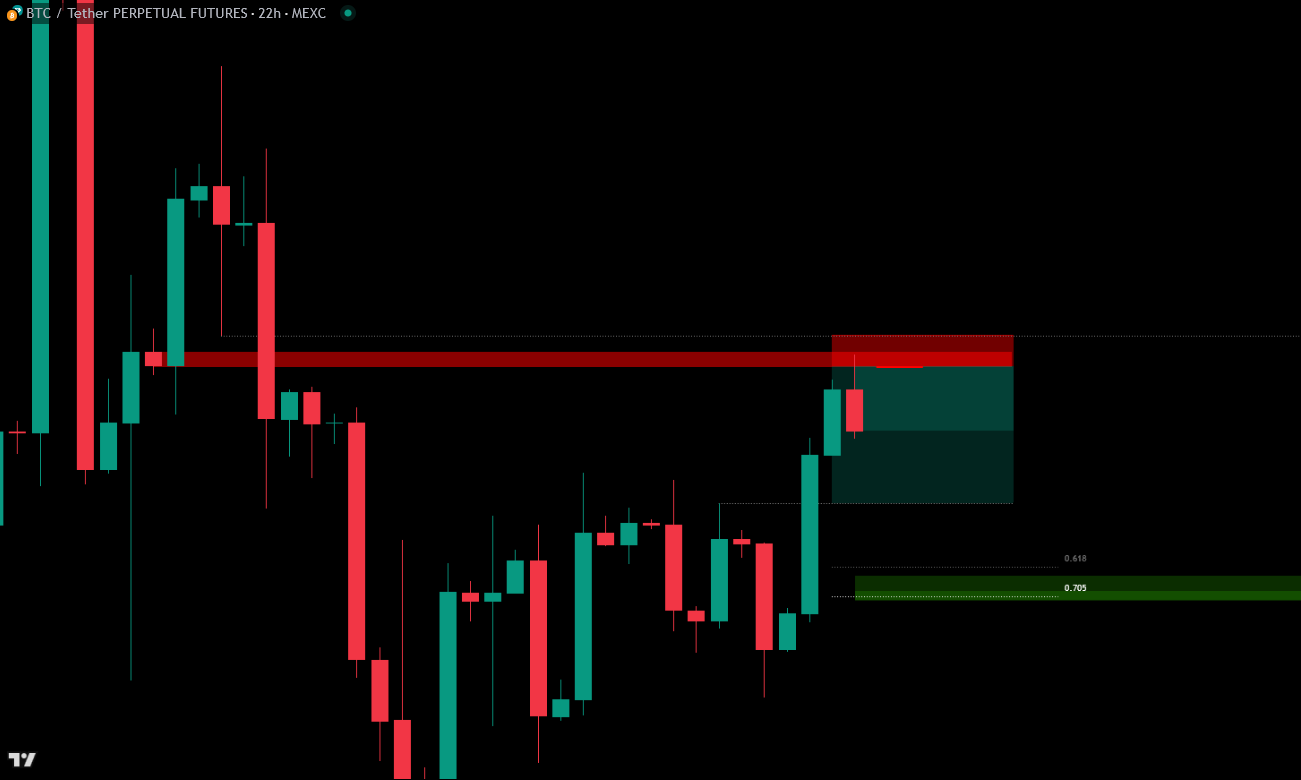
When planning to scalp an altcoin with high R: R always check Bitcoin's PA first. Look for any imminent reversal that could move against your trade.
If you're about to scalp short, and Bitcoin is reaching for a key level like the one on this chart, it adds confluence and increases the probability of a successful trade.
Having Bitcoin and ETH's price action engraved in your mind — especially key levels — is a massive edge. Altcoins follow the King. Know what BTC is doing, and you already have half the trade figured out.
SL🔻again, above 1H partial BB.
Fk somehow I thought this one is stronger (23H) and missed that opportunity.
SL below that one.
I thought you considered 12h and above to be HTF?
Not on this refined PA.
That last answer is important. The taxonomy I gave you at the top is the general rule. On a fully refined chart, where the PA is dense with confluence, a 23H or 17H level can act with the weight of an HTF level even though by definition it sits in the LTF/MTF band. Probabilities × Size.


[Mar 21, 2025] As the 🗝️ level gets hit and since it's not HTF, your SL should already be at break-even at the very least. If you're sitting on any losses to recover, your priority now is realizing profits, not chasing more.
Odd timeframes — and why TradingView makes some of them weak
Now we get to the part most people skip: the unusual timeframes. The 23H, the 7H, the 11H. (#Odd Timeframes oddtf)
Odd TFs are usually for MTF and LTF trades. They don't count as HTF because of the way TV's candle closes work. (Timeframes)
Here's the mechanics, because at least 90% of people in this server have the wrong idea of how hourly time frames (1H–23H) work in TradingView.
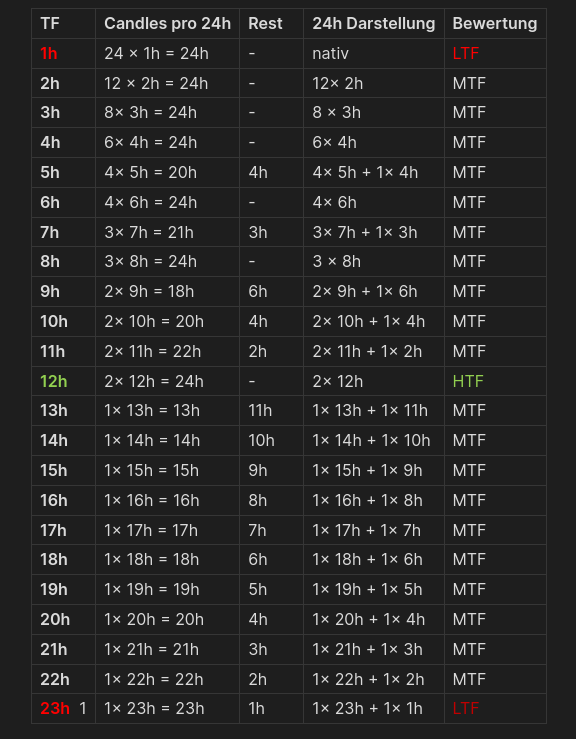
You probably think that on a 23H chart every candle represents a 23H period. This is wrong. The way hourly timeframes work in TradingView is that the first candle opens at 0:00 and the last candle closes at 0:00 the next day. So on a 23H chart you get 2 candles per day: one 23H candle and one 1H candle. The chart is "unbalanced."
The only timeframes that are 100% balanced — where every candle represents the same time period — are the ones that divide cleanly into 24: ==1, 2, 3, 4, 6, 8, and 12 hours.==
This matters because it's WAY easier for a HOB and FVG to form on unbalanced timeframes than on balanced ones. A level found on 1, 2, 3, 4, 6, 8, or 12H is a lot stronger than one found on, say, 23H.
Not all unbalanced timeframes are equally weak. The 5H still gives you four 5H candles and one 4H candle per day — much better than 23H, which only has one real 23H candle. The bigger the unbalanced TF, the weaker it is, because the asymmetry between candle durations grows.
So 23H is actually the weakest of all hourly TFs. Then 22H, 21H, and so on. The misconception that "the higher the TF the better the level" is invalidated when you realize higher unbalanced TF = more lopsided candles = thinner liquidity in the small companion candle.
Start your analysis with the balanced timeframes (1, 2, 3, 4, 6, 8, 12H) and then check the unbalanced timeframes for extra confluence. When it comes to minutes, days, weeks and months, everything is balanced — so this rule only counts for hours.
So moving on to when I refine down the different timeframes. Example, I start on the weekly timeframe but then refine as much as I can, down say the lower time frames even as low as 1H for example. But the 1H is still WITHIN the weekly zone. Using the real market place analogy again. Would this be like having 100 people all stood at a large "stall" and then the refining process is finding out where most of the buying/selling is coming from within those 100 people?
1. Starting with the Weekly Timeframe (the Large "Stall"):
- Think of the weekly zone as a large stall in the marketplace where 100 people (traders) are gathered. This represents the big picture, where long-term buyers and sellers are congregating because they see something of value (supply/demand or a key Fibonacci level).
- In this case, the large stall is the entire weekly zone where you know there's a general area of interest. The crowd is there, but you don't yet know exactly where the most buying or selling pressure is concentrated within that large space.
2. Refining Down to Lower Timeframes (Finding the Key Points Within the Crowd):
- As you zoom in, moving from the weekly to the daily, 4H, and finally the 1H chart, it's like getting closer to the crowd of 100 people and observing where the real action is taking place. You're looking for where the most active buyers or sellers are standing within that larger stall.
- For instance, within the weekly zone, you might find that a specific 1H Fibonacci retracement level, or an untested support/resistance level, is where most of the buying or selling is concentrated. This helps you refine your entry point within the broader weekly zone, allowing you to pinpoint the highest-probability location for a trade.
3. Pinpointing the Most Active Traders (The Best Entry):
- As you zoom into lower timeframes, you're essentially identifying the most significant areas of liquidity, or where price is most likely to reverse or react within that weekly zone. This could be influenced by smaller timeframe Fib levels, price action patterns, or fair value gaps within the larger zone.
- So, while the larger crowd (the higher timeframe traders) is active in the general zone, you're now finding the core group of traders on the 1H chart who are making the real moves. This helps you spot the exact areas where price might pivot or consolidate, and allows you to refine your entries and exits with more precision.
4. Refining for Precision Without Losing the Big Picture:
- While refining your analysis down to the 1H, you're still keeping the context of the weekly zone in mind. It's like looking for the exact point of interest within a busy stall without losing sight of the fact that you're still within the broader, more important area where the long-term traders are active.
- This allows you to balance the macro view (weekly timeframe) with the micro view (1H timeframe) to make more precise trading decisions. You're essentially finding where the strongest forces of supply and demand (within the larger crowd) are acting within that key area.
5. In the Marketplace Analogy:
- 100 people are gathered at the large weekly "stall" (the weekly zone). Some of them are just observing, but a subset of them are actively buying or selling. As you zoom in to the lower timeframes (like 1H), you're figuring out exactly where within that stall most of the transactions are happening-who's placing the biggest orders, or where the price is most likely to react.
- By refining this way, you're finding the highest activity spot within the crowd. This might be a Fibonacci level on the 1H chart that aligns with the weekly zone, or a fair value gap on the 4H chart that adds extra liquidity to the area.
A simple way to see why 23H HOBs are so weak:
They might not look small, but they CONTAIN NO LIQUIDITY. Use a volume indicator to determine if a level holds enough liquidity to fuel a reversal or not. A 23H chart level can work — but only if the volume matches the other candles too.
The thing is, OB's can contain liquidity without there being significant volume displayed on the chart. That's why retail can't see it.
That's the impression — and it's why volume on 23H HOBs will always look small: they form on the 1H companion candle, not the 23H one. The 1H candle's volume looks tiny compared to a real 23H candle.
The practical rule from this: use 'weird' TFs as refinement only, not as the primary basis of an OB/HOB. Same process for any TF between H13 and H23. The higher you go, the weirder it gets. Same applies to lesser extent for H5, H7, H9, H10, H11.
It doesn't mean odd TFs can't work or don't react to PA. It's a probabilities question. (Refining Intro)
A rough taxonomy for odd hourly TFs, observed across many setups:
- 22h – 23h is usually LTF
- 13h – 21h is often MTF
- 12h is always HTF
- 11h, 9h, 7h and 5h can also be weaker than they seem

Why I still hunt the odd TFs
Despite the unbalanced-candle problem, odd TFs matter — because that's where hidden liquidity lives.
But if I may ask, in the beginning, what led you to think the answer of liquidity is hidden in multiple TFs by whales?
Liquidity is the fuel that moves the markets. If it's taken from above, price often moves lower. If it's taken from below, it tends to move higher. It's one of the most basic principles in the markets.
I started noticing where reversals were consistently happening. At first I was seeing it on traditional timeframes — 4H, 1H. But everything changed when I began digging into those "odd" timeframes others overlook. That's where the real PA-related precision started to show itself.
A lot of people out there claim to be trading experts, then turn around and say things like: "I only trade on the 4H chart with two moving averages." 🙃
[Mar 25, 2025] Study PA on "odd" timeframes:
How do you recognize when liquidity is taken? Often a candle is covering multiple FVGs. I would probably have placed an order earlier. Or do you always set orders and get stopped out often?
The more FVGs, the more hidden. The more hidden, the more powerful. Experience might tell you how many you should wait for. It varies from coin to coin, and you'll need confluence with fib levels too.
[Oct 11, 2024] On CFX. Count the FVGs.
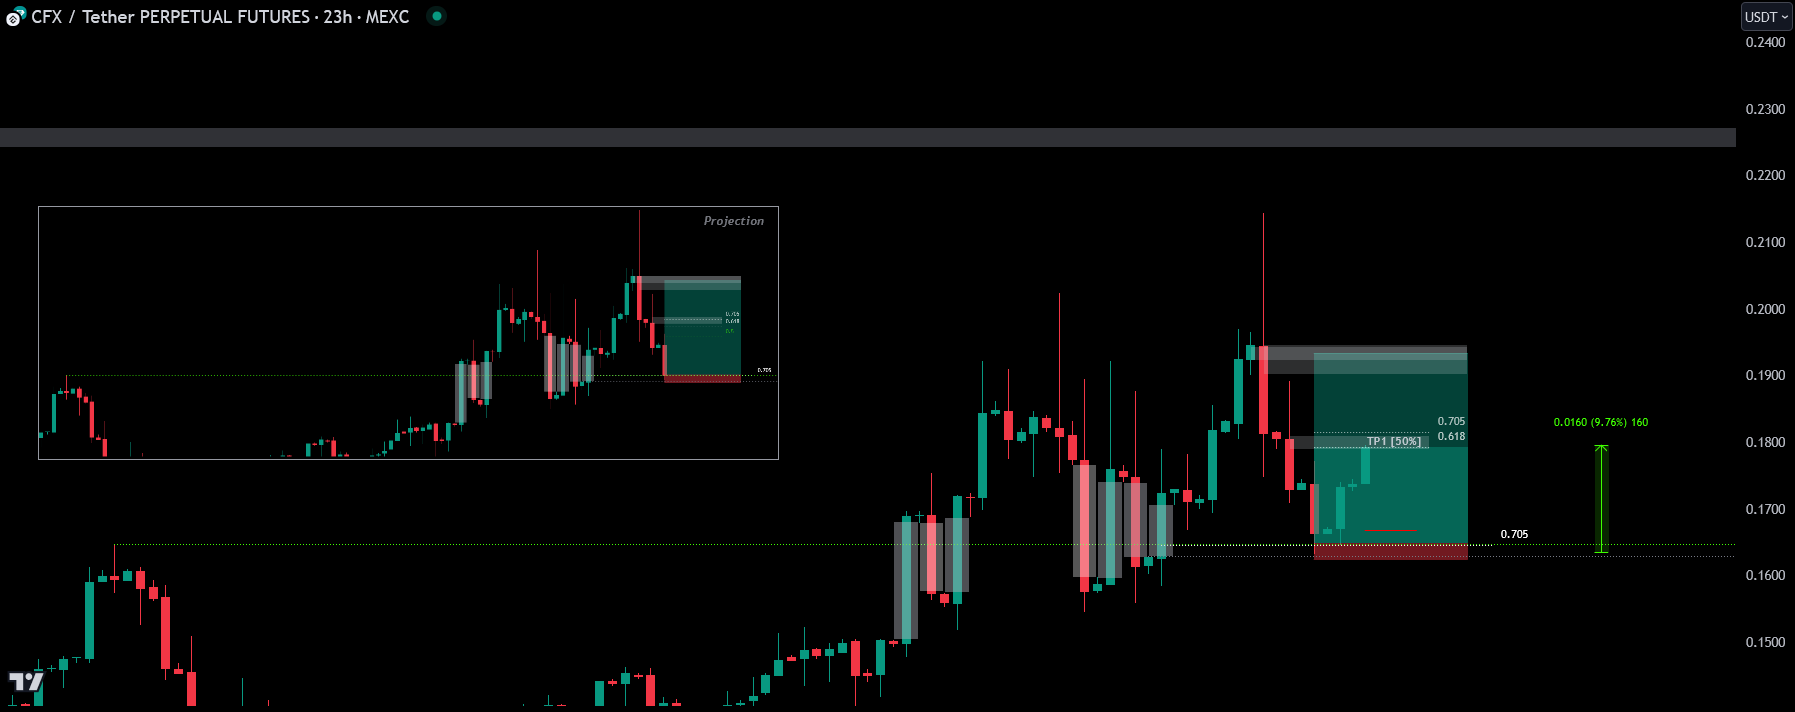
On which of the FVGs did you place your stop loss? And why was it not respected until it got to the 7th FVG?
Below the last FVG. Fibs confluence, 3 drives into a big pump taking daily BB perfectly, then the typical search for fuel before bullish continuation. (🔷H&S and 3 Drives)
One more Q — you searched for FVGs on 23 Hr. Now there are 24 hours, 7 days, weeks, months, 15–45 minutes. Are there favorites or more probable timeframes you prefer?
I keep searching until I find.
With experience do you know to recognize the developing structure (3 drives) in advance, decide in real time, or attempt the trade since SL is tight?
It doesn't look good enough until I see PA like CFX's, with 3 drives into BB before taking the key level I longed at. I don't try every single FVG. It needs to make sense. (Previous example: UNFI)
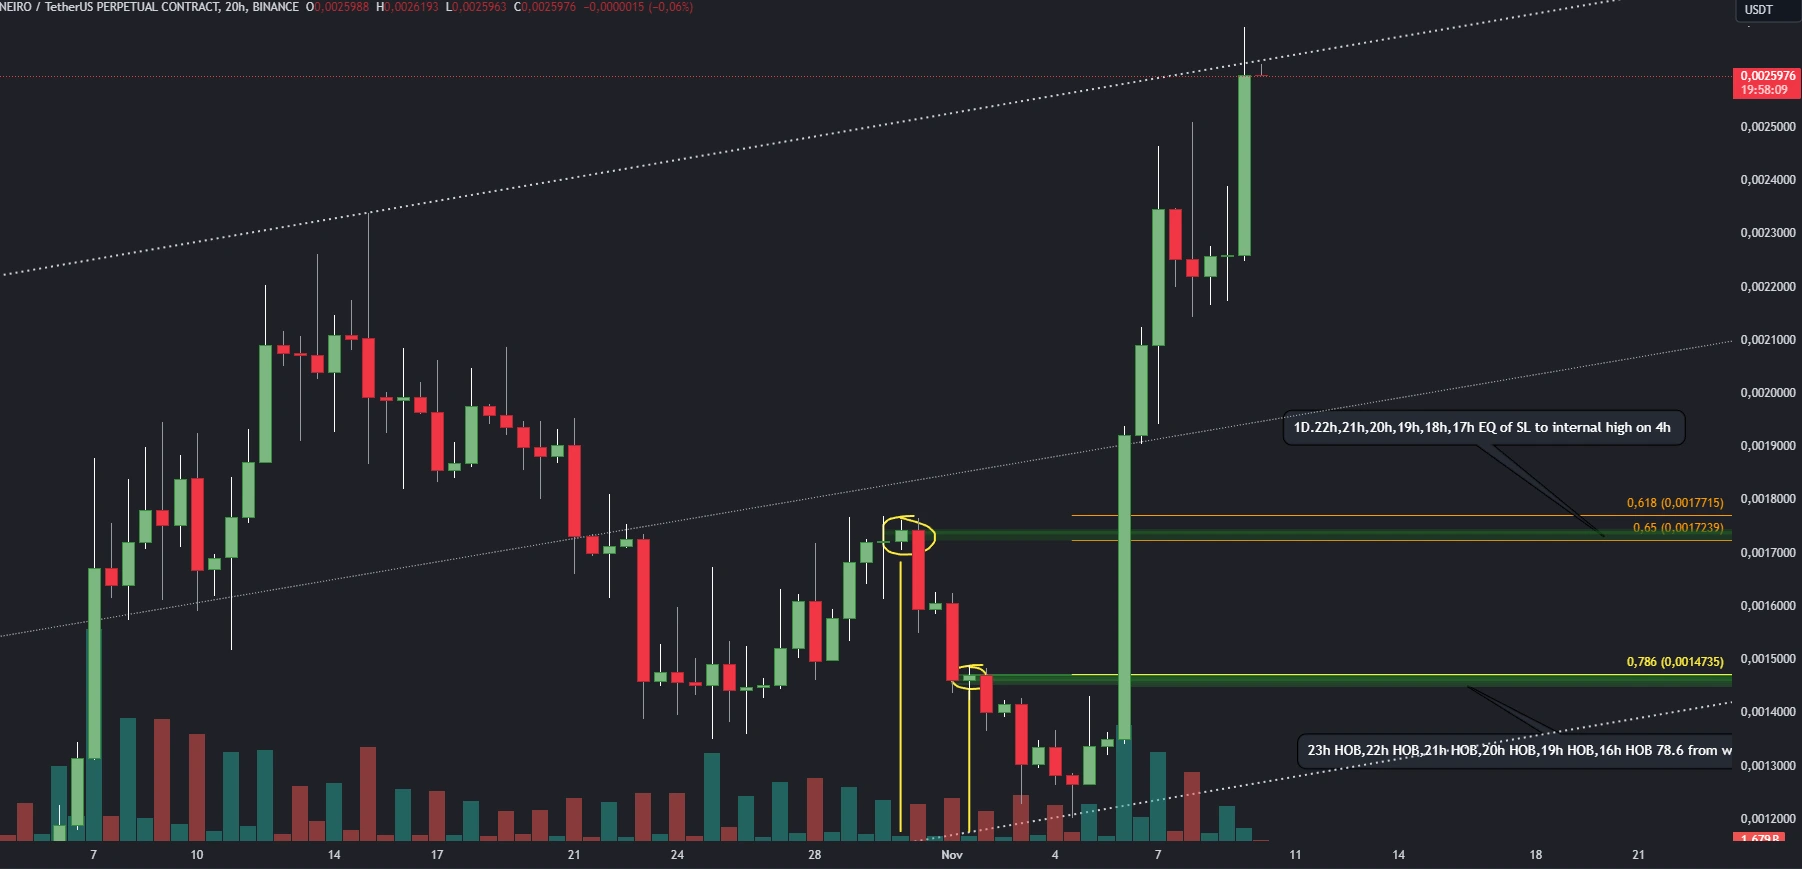
[Jan 17, 2025] TAO [update]:
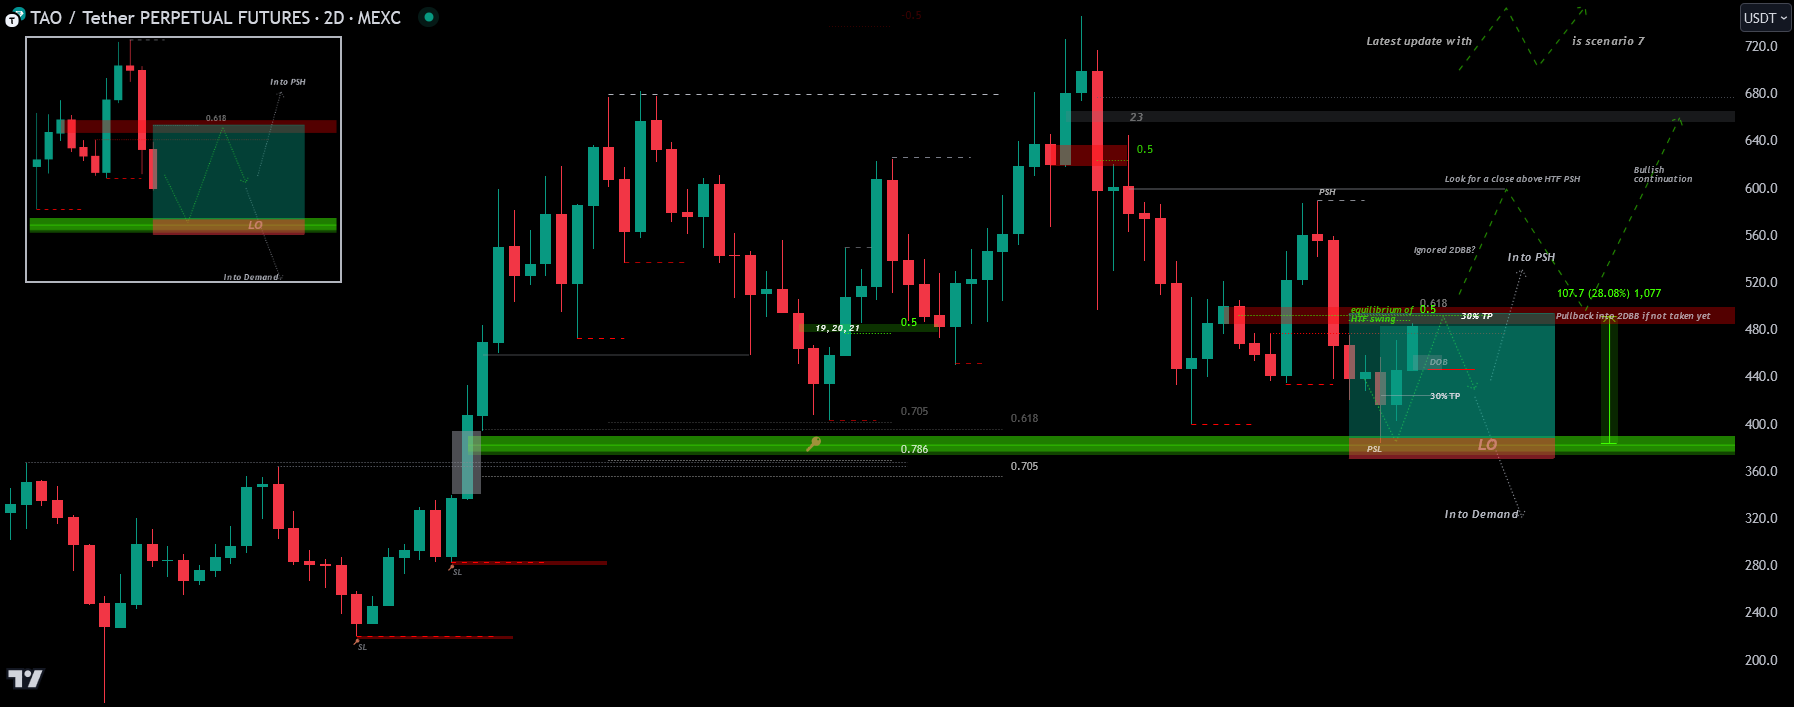
I noticed you mark a lot more of those "odd timeframe" BBs. I would think they're weaker because they're unequal, but on this chart you only marked the 23h BB and not the 1h BB inside the 2D OB (which I thought is stronger). Which do you value more? My guess is fib confluence on higher TF — both blocks sit on its 0.618, but the daily fib confluence (matching 23h swing) has higher value than a 1h untested fib. And 23h → more hidden → more powerful?
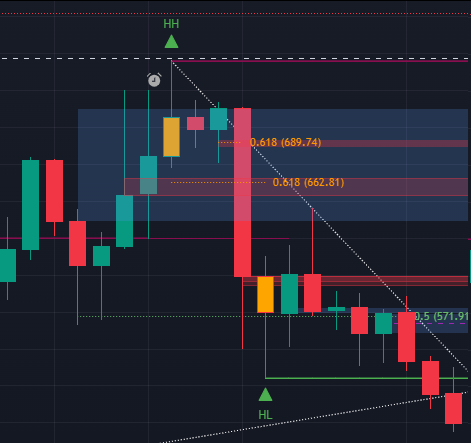
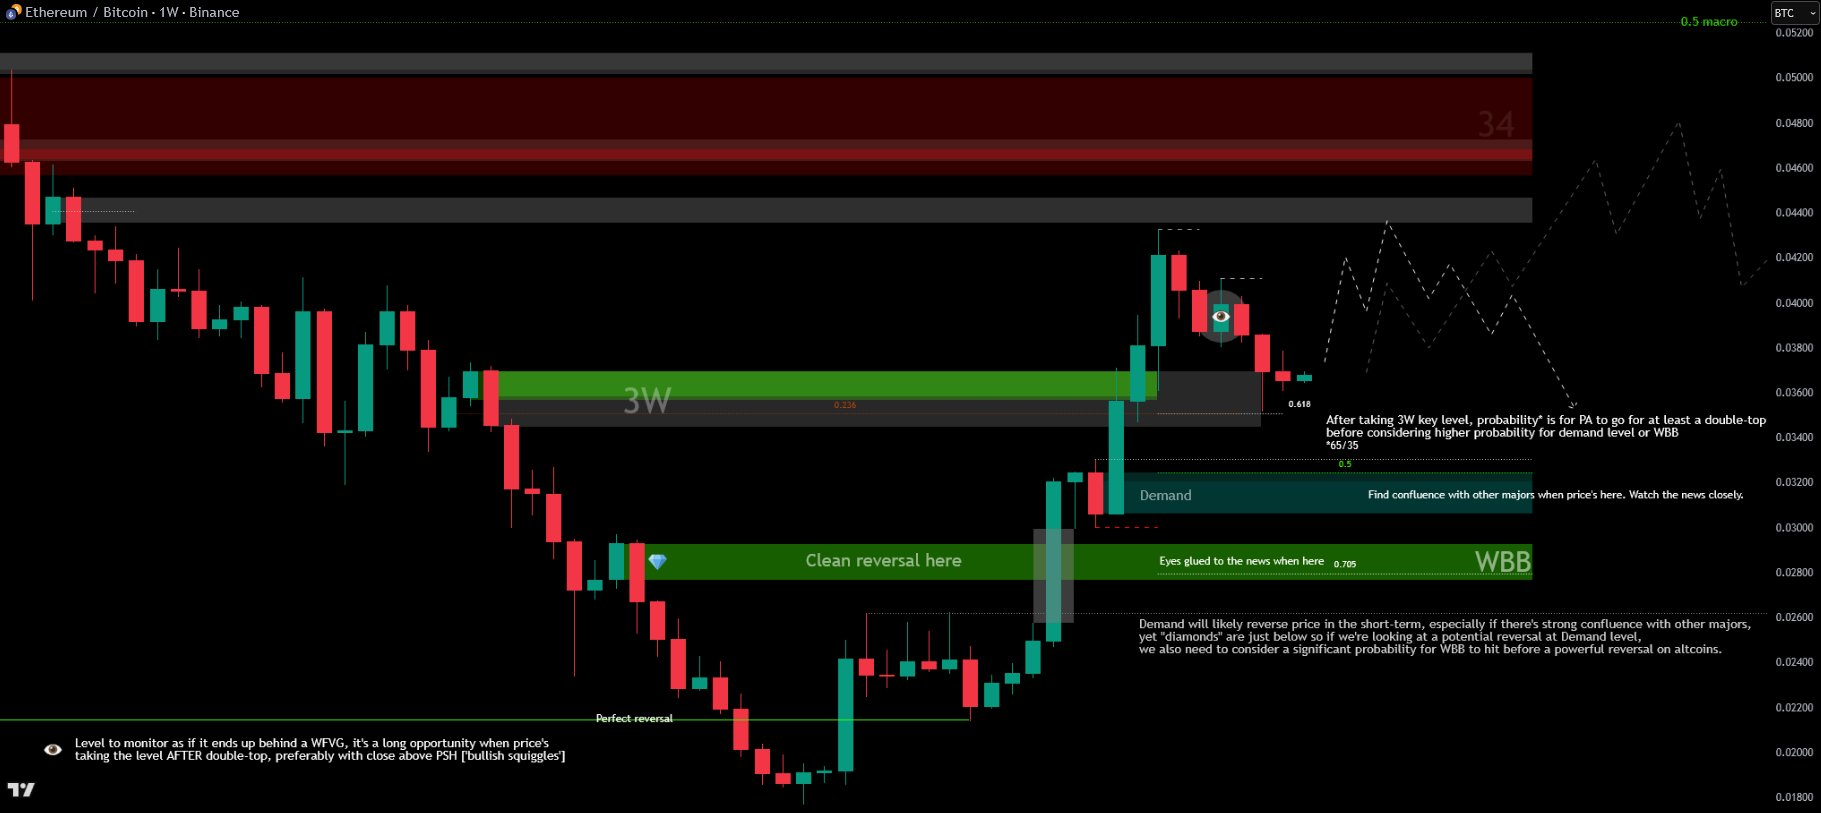
[Oct 6, 2025] ETH/BTC, 34D TF:
Secrets with odd timeframes
Some of the odd TFs I rely on most are part of a set my students have called "secret weapons."
Do you use a set group of timeframes or do you go crazy and use 37D etc? I see a few people using all types of TFs.
I've loads of crazy TFs added. Some are my "secret weapons" like 288' — would have given you an epic long on BTC yesterday. 288m is 1/5 of 24h.
A breakdown of why these particular numbers matter:
- 72 minutes (20 periods/day) → midpoint between 60 and 90 min, smoother transition.
- 96 minutes (15 periods/day) → slightly longer than 90 min, useful for catching extended moves.
- 144 minutes (10 periods/day) → harmonic of 24h, aligning with institutional algo flows.
- 216 minutes (3.6 hours, 6.66 periods/day) → aligns with the Gann Wheel & 360° rotations.
- 432 minutes (7.2 hours, 3.33 periods/day) → related to Fibonacci harmonics (432 Hz theory).
🔬 Odd timeframes to test:
- 12m — same as 15m but slightly quicker confirmations, 1/5 of an hour
- 55m — same as 1h but slightly quicker confirmations
- 13m, 21m, 34m, 55m, 89m, 233m — Fibonacci & Harmonic Timeframes
- 72m, 108m, 216m, 432m — Gann & Numeric-Based Intervals
- 72m — 1/20 of 24h
- 96m — 1/15 of 24h
- 144m — 1/10 of 24h, intersection of Fibonacci and Gann
- 288m — 1/5 of 24h
Test yourself whatever works better.
🔬 For equities:
- 65m — 6 candles per day
- 130m — 3 bars per day
- 39m — 10 bars per day
- 78m — 5 bars per day
- 45m — useful to approximate the first 90 minutes (2 bars) as the initial volatility period
The honest summary of how I use all this: I rely on HTF levels and fibs mostly. When I dig through LTF or those odd ones it is to help me refine and find more precise entry. I have all the TFs you mentioned added, and at this point it's more of a flick through them to see more of what I already may have seen.
These can be useful, but they're not my favourites because they don't help me to refine. For HTF, sure — give them a go. My process at this point has evolved enough that sometimes I take one look and know where I need to look. My favorite is mid TF, and I usually have the most fun on lower timeframes, micro included (below 5 minutes down to 5 seconds).
The Micro TF: where you read reversals in real time
Below 5 minutes is its own world. Micro TF analysis is a must to thrive in this game.
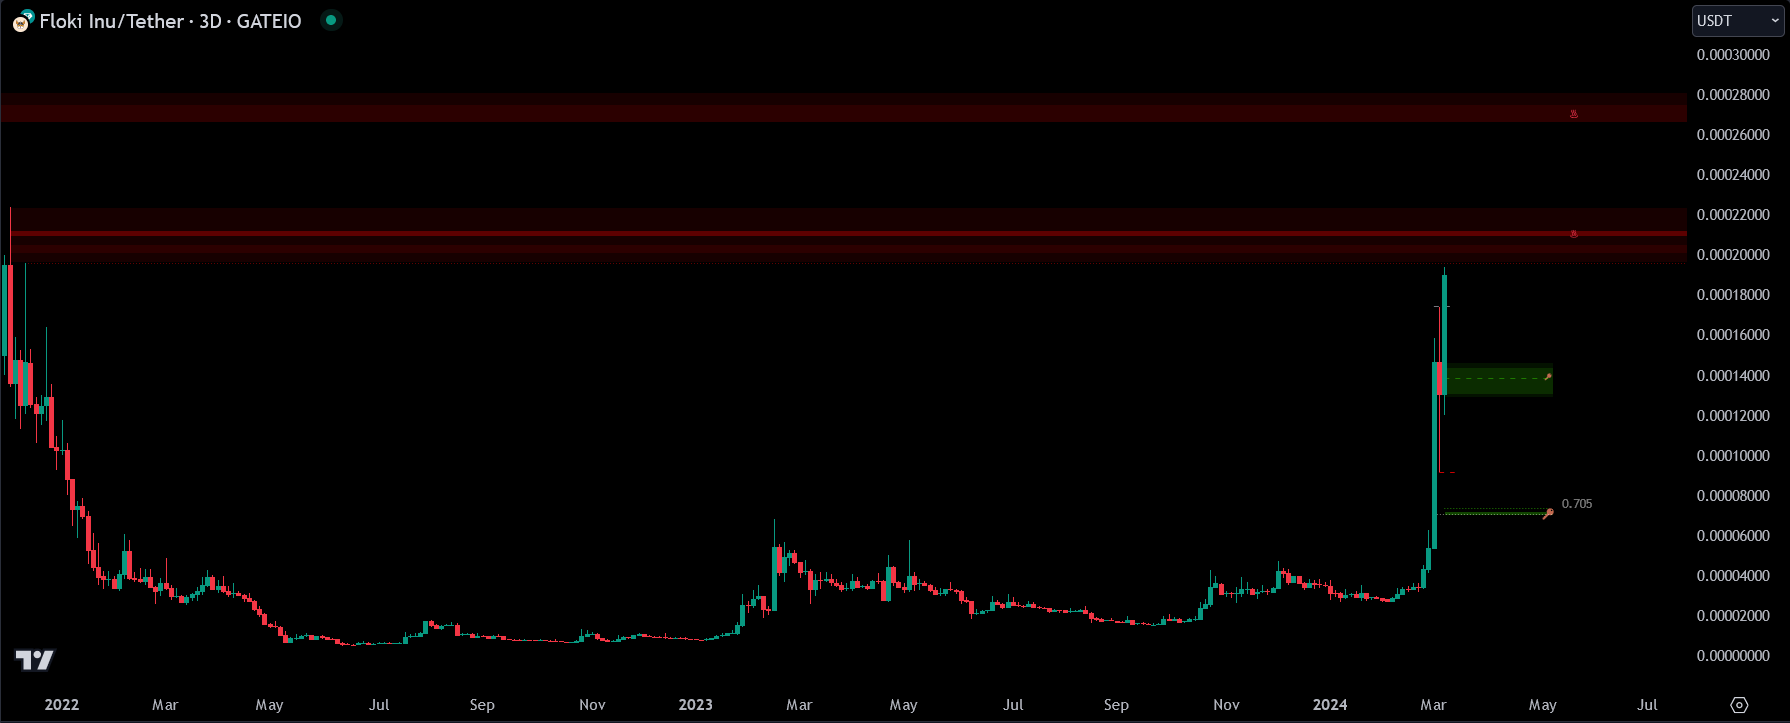
[Mar 8, 2024] FLOKI with a -12% 🔻 at the moment.
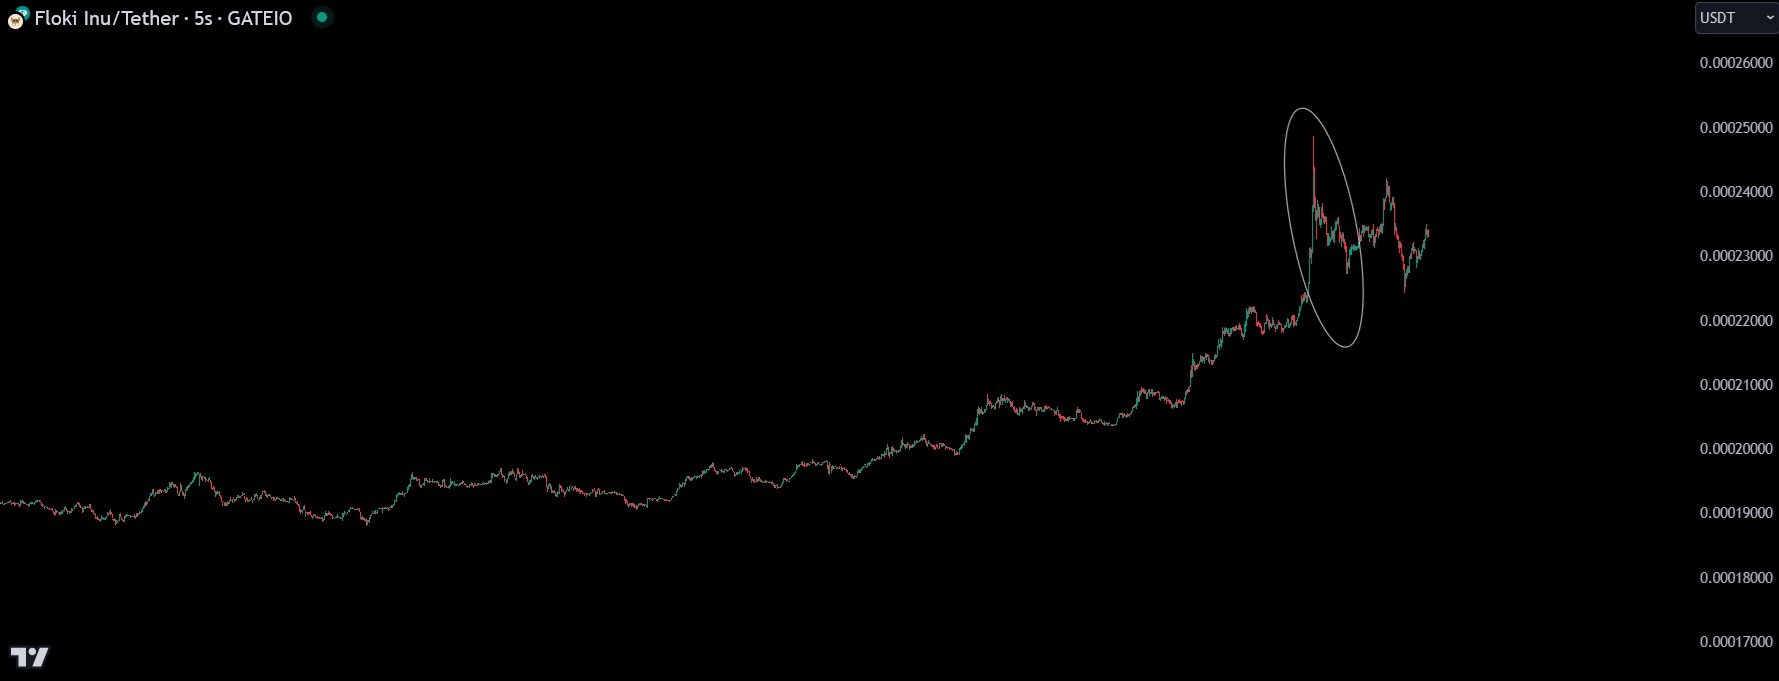
On micro TFs you can see best when price is likely to reverse, because the ⚡️ moves at key levels are a powerful hint for it. Spend some time on those TFs when price is reaching for the levels you expect a reaction at, and you'll start noticing a pattern — knowing when a reversal can actually happen versus when the reaction is too weak.
Entry must be random as the LTF level was much lower (or another a bit higher), and the "signal" is such a wick before at least an LTF/MTF reversal. Now -16%.
The "ping-pong" into key levels is similar to LTFs but harder to read because you don't see proper bodies. You just have to get used to it.
A worked Micro TF scalp short on BTC
Micro TF scalp short ♨️ level @ $71,050 on BTC.
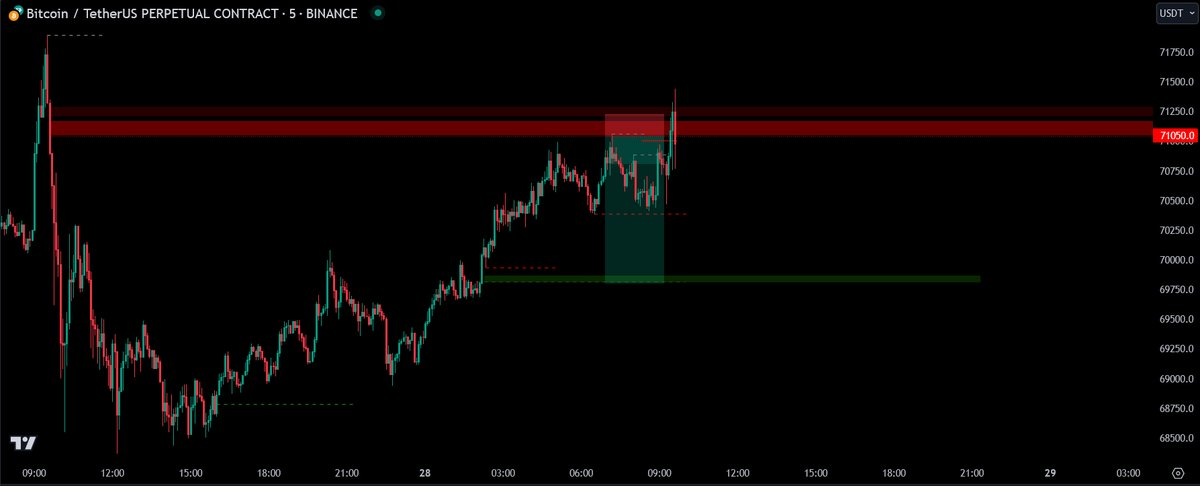
On the 1st chart, on Binance — where the largest trading volume is — price touched exactly $71,050 before dropping nearly -1%.
This can mean one of two things for experienced traders:
- Break-even, since it's a scalp opportunity, so SL2BE should happen shortly after expected reaction to the level.
- Profitable play, where trailing SL can begin shortly after expected reaction. Not hugely profitable, but green.
Nearly -1% generates between roughly +10% and +100% PnL on a 10x–100x short. Don't expect huge swings from scalp opportunities. Expect 0.5% to 2% on average. Fast plays — profit or loss happens fast.
Newbies who don't do (1) or (2) end up stopped, or they lose a lot of their account because they start chasing to recover the SL. Take the levels and that's it — rather than entering random trades just to make $ or recover an SL. Many people struggle with the thought of being wrong. There's no point being like that if you know what you're doing.
I have many HTF and MTF plays running on amazing profits. A -0.2% on account from a scalp won't make me enter analysis-paralysis, especially when one MTF play is on bigger profit than that.
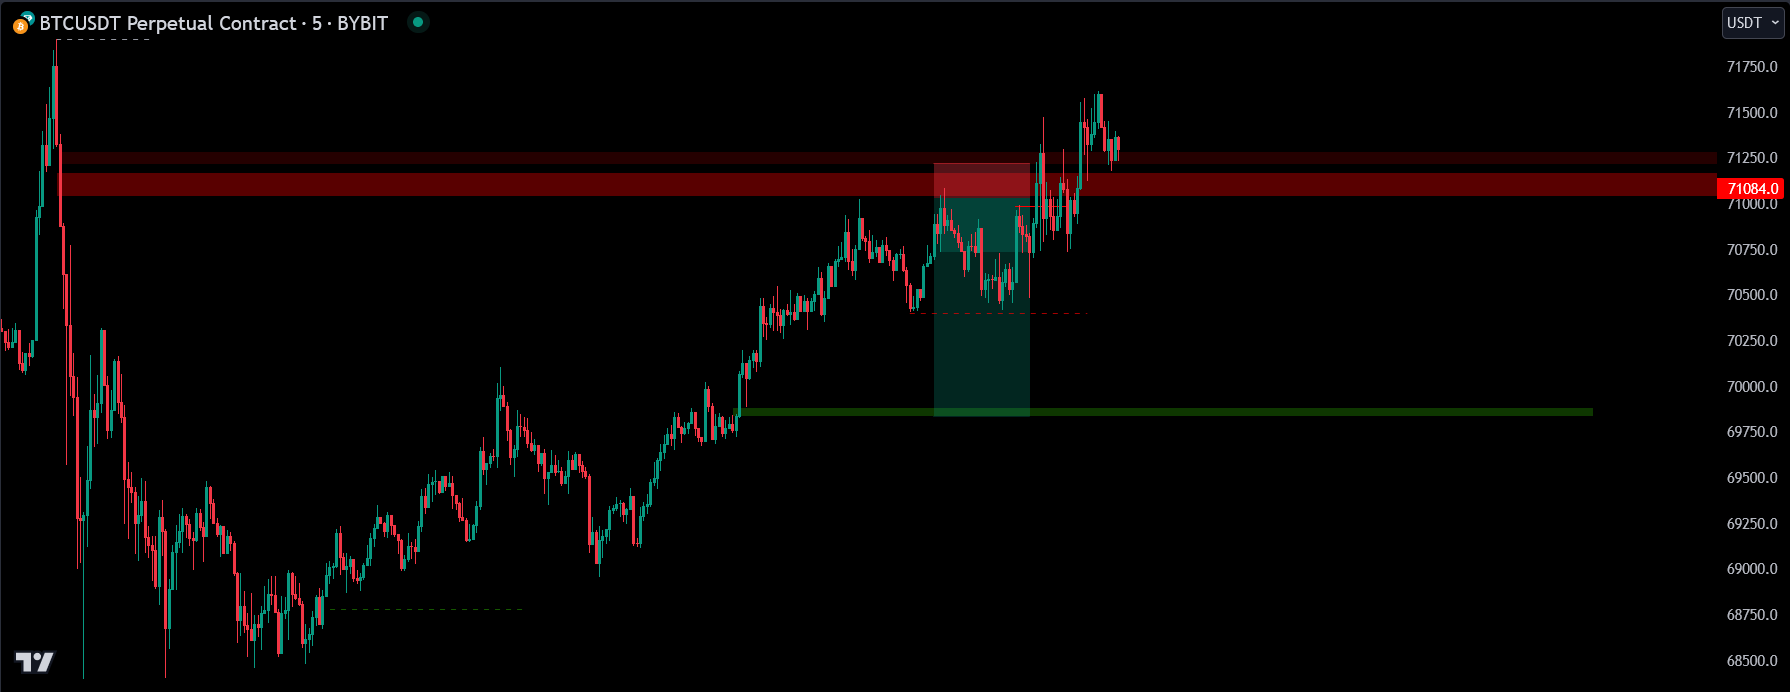
On the 2nd chart, Bybit, with significant volume, price touched $71,084 before the same kind of drop. Same setup. We're talking about micro scalps — if you're expecting a powerful -10% reversal you're not understanding how this works. Even -5% on BTC from a level found on micro TFs without confluence from at least MTFs is unrealistic. Expect those drops or pumps from levels found on HTF and refined into MTF and LTFs.
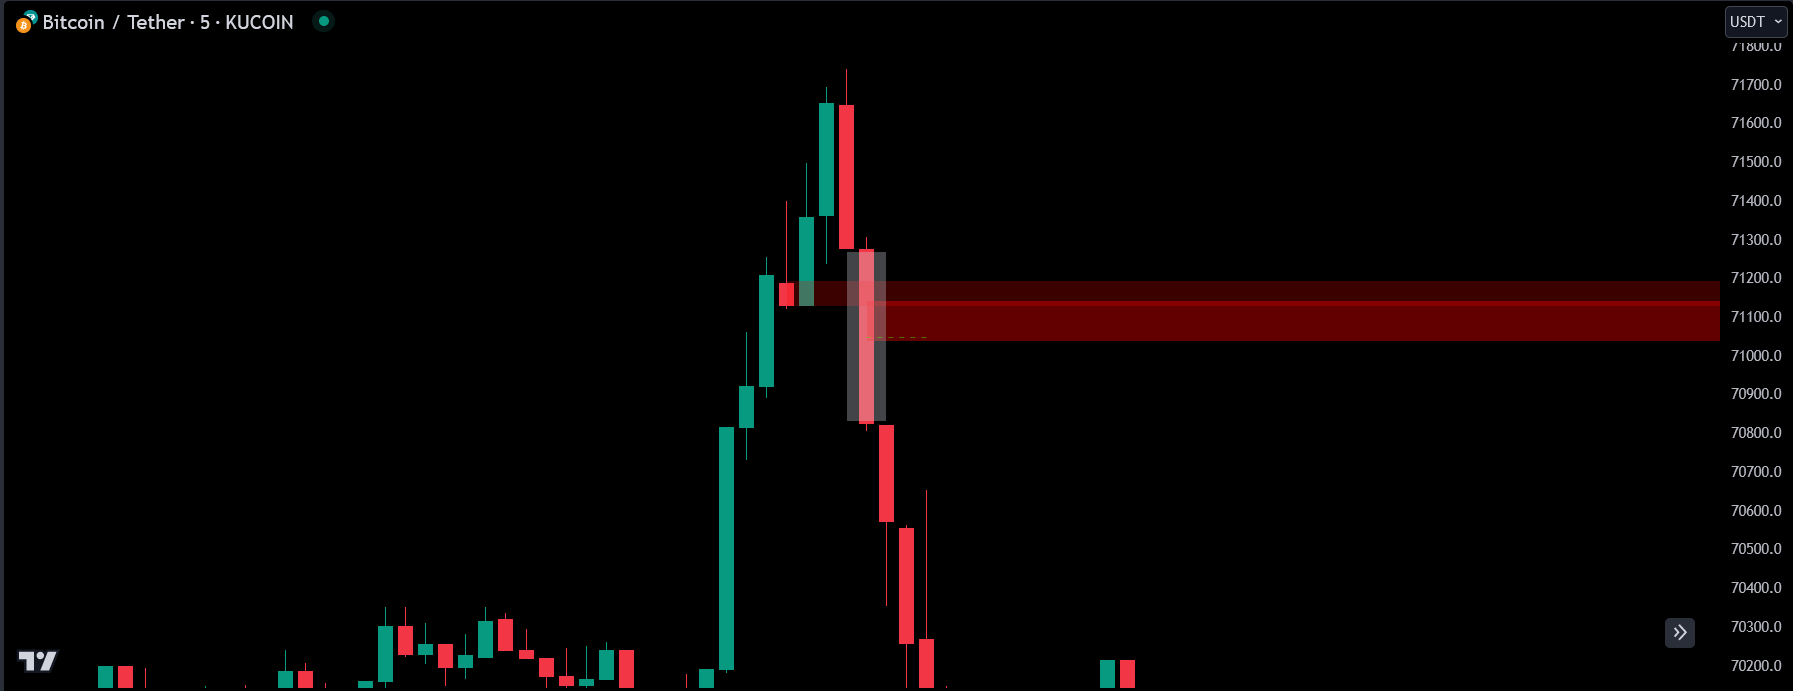
The 3rd chart shows the level found. Whoever had a larger SL than 71,210 is not a profitable trader, regardless of whether they avoided being stopped by widening the SL. The fear of very tight SLs is just confirmation that you have no idea where price might find reversal pressure — bad news if you want to be profitable. You must understand why on everything you do in this game. This was a play for <0.5% SL and if stopped, that's it, you move on. You just need to get one good trade on such amazing R: R and you can be stopped 10 times next and still be profitable.
📄 On micro scalps, one touch is enough. Don't hold the position for a 2nd and 3rd touch. This isn't MTFs or HTFs where you can often expect more than one touch on the same level due to liquidity. Once a level is taken on Binance, don't expect a smaller exchange like MexC to give you the reaction — unless Binance's price hasn't passed your level yet.
A student's plan for the same setup:
Size 0.5%, Leverage 20x, SL ~1% above recent SH, TP1 @ '21 ATH, target 0.5 fib of FVG on 3D/12H/8H/4H/3H + 0.705 fib + PSH confluence around 68,200ish. No Plan B.
- Size ✅
- Leverage can be higher if SL is up to 1%. With 20x you risk -20% on position; if your max allowed loss is -35%, you can go up to 35x. My SL is smaller than that, so I can go higher leverage if I'm willing to risk up to -35% of the 0.5% account risk.
- TP plan here is trailing along rather than TP early.
- Plan B is a must. When you think 3+ plays ahead, you win. If you only plan for one shot you won't make it. Look at snooker — they're thinking 10 shots ahead. Tennis — 3+ shots ahead. It's not really a "Plan B," it's preparing the next move if stopped, just like you prepare for TP.
Reading the reversal in seconds
FLOKI short example:
How did you manage this short? You knew it would fall but waited first for a liquidation wick?
It began touching ♨️, but if you see my chart it had another ♨️ a bit higher, so it was in between — and neither was heavy ♨️, so size is lower vs an HTF ♨️ level.
Micro TF aggressive ⚡️ moves are often a signal of trend change on LTFs, which can then propagate to MTFs (not yet on FLOKI here), then HTFs, and you just trail along. Worst case scenario you're stopped on profit, but aggressive bullish moves like FLOKI's usually end on ⚡️ wicks.
ROSE [Mar 9, 2024] — ROSE is trying but no powerful reaction just yet:
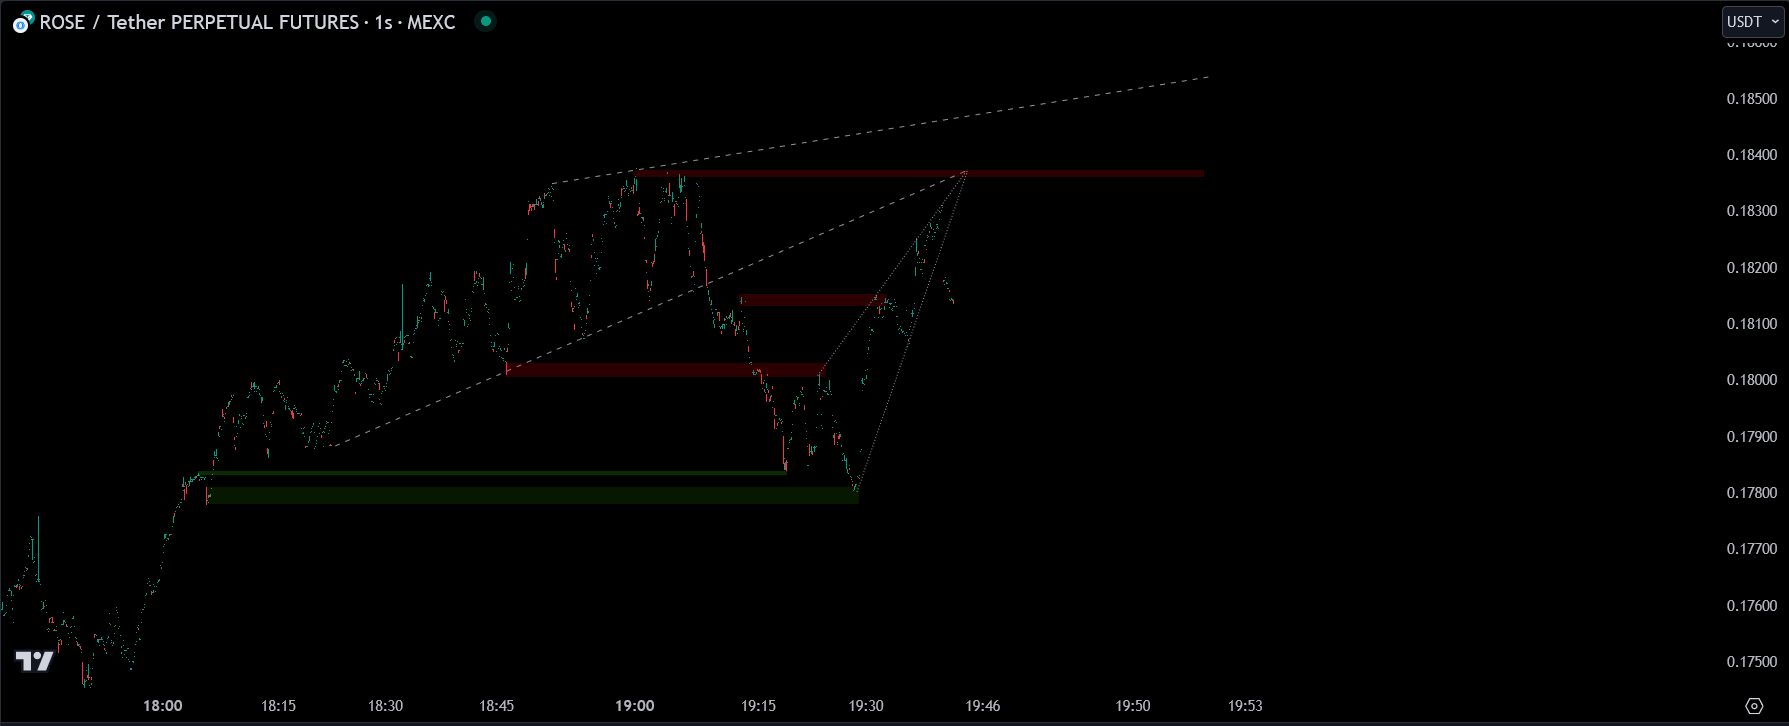
Shorted with 0.5% on tight SL. Might add size depending on what bots are up to.
What confirmations were you looking for here?
Same principle — on micro TFs you see best when price is likely to reverse, because the ⚡️ at key levels is a powerful hint.
Bitcoin 1min — Supply & Demand. Liquidity games. The game is perfect. See what others cannot see and earn what others will never earn. (🎁Supply & Demand / Supply / Demand)
POPCAT:
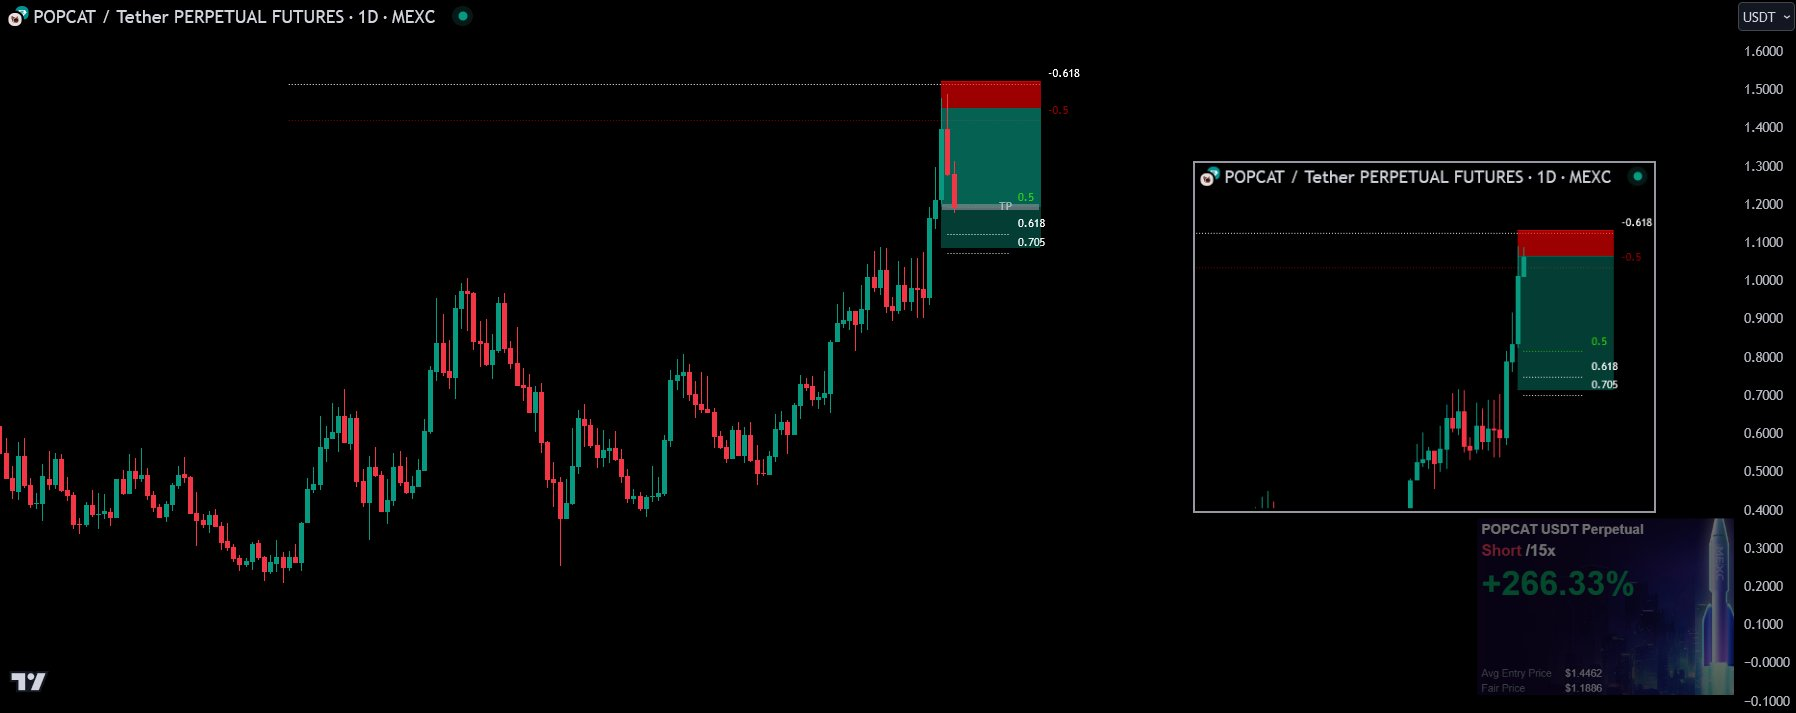
Are you entering based on LTF PA, for example after an LTF BOS, or do you just enter when you see negative fibs being reached? Also I assume you don't enter with full size?
I enter at fibs and 👁️ reaction on micro TFs. I take 0.2 or 0.3% size on such plays. If it's a good hit into an aggressive drop I can add 1 or even 2% to my account from this trade alone — guaranteed at least +0.5% here.
[Dec 20, 2023] Got you again 😌 — expecting very short-term bounce (scalp opportunity) at that OB before more 🩸:
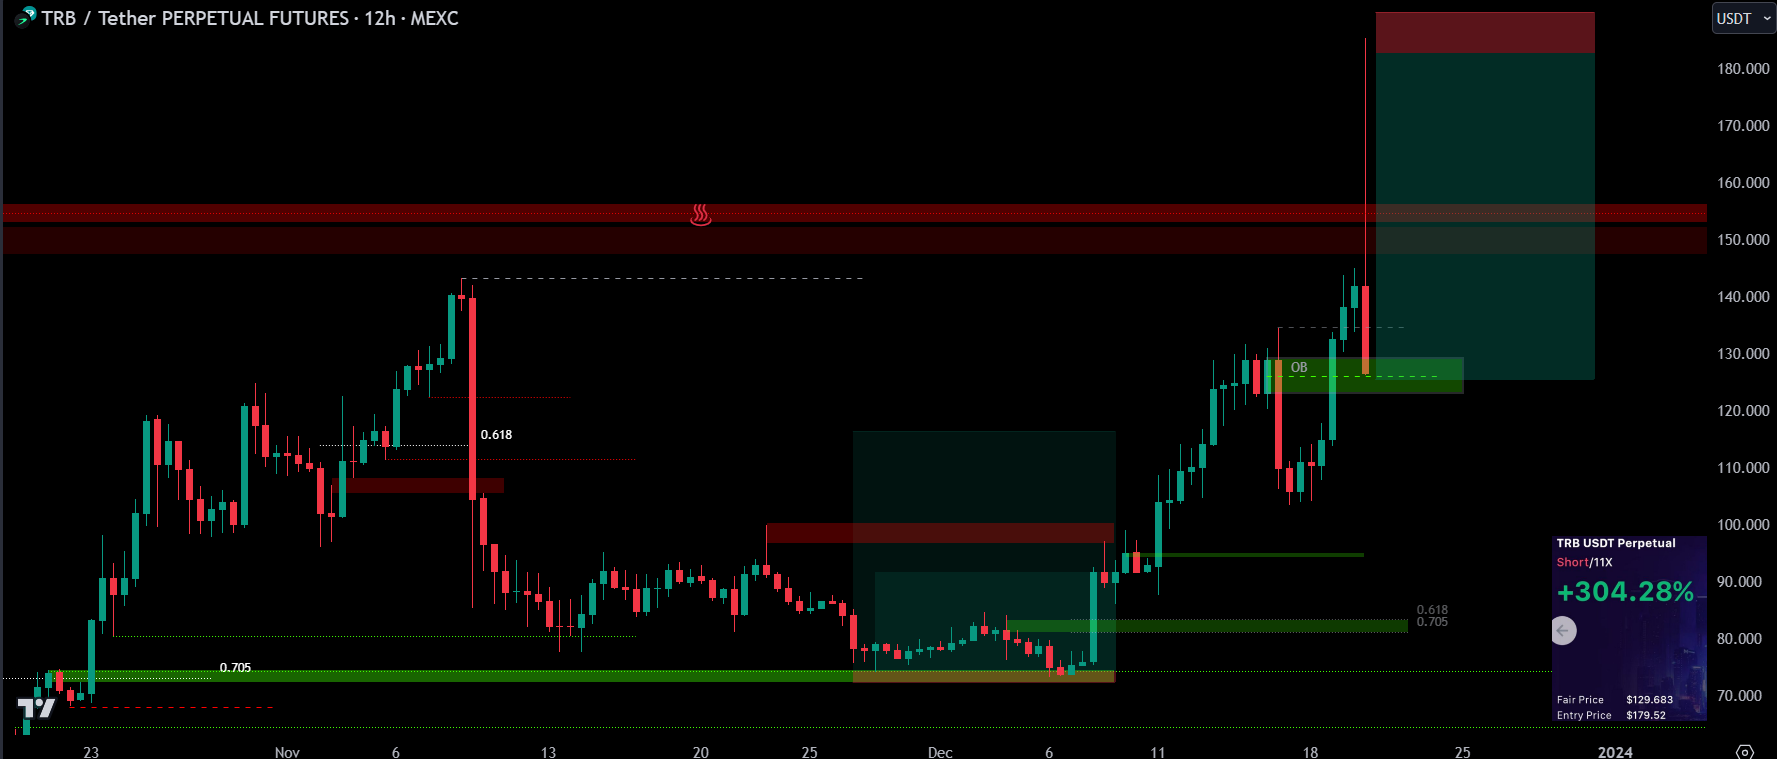
What tool do you use to enter? It pumped 30% in 2 minutes. Can you know your entry in advance, or only watching live PA in seconds?
Micro TFs (no tool). Price was there for 1min+ so I had time to enter. Filled 55% only — I don't enter large positions on such plays. Timing and the move happening while you're on the charts is a must.
Micro TF tips
🚨The Worst Mistakes — "move SL to entry as soon as in profit." Indeed, I move SL faster when scalping. The play is faster anyway.
When the LTF beats the HTF — and when it doesn't
A clarifying exchange on a key level question:
Is that the 🗝?
Yes, but LTF, thus weaker, thus much less risk vs if you had caught the 4D OB, which has much more reversal pressure vs a 1H level. And is this 1H level going to reverse price on the way up, or blast through it and reverse on a future downswing? 👁
That question — will this level reverse now, or get blown through to reverse later from the other side — is the question you can only answer well when you've confirmed the level across multiple TFs.
The order of operations
A few last operational rules to leave you with:
Best to start looking from the highest timeframes to the lowest. (UNI)
I haven't found the confirmation on the lowest levels though.
If you find on HTF, you don't need LTF. More powerful if you do, though.
The highest probability to succeed patterns are on HTF. Wicks can indeed be SL hunting, holding no liquidity on LTFs because there wasn't any PA going on there. But a wick can hold liquidity if there's "hidden" liquidity on an HTF wick showing up on LTFs — something most retail can't see or understand. (🎁Hidden Liquidity Levels)
The HTF local bottom will be confirmed when exchanges freeze after a ⚡️ Move. (Signs of Bottom) I don't make the rules.
RUNE — Daily+ TF are where you'll find the highest probability to win your trades.
FTM — 3-Day chart helps a lot in planning and execution as a newbie. Can take longer to play out, but the likelihood to succeed is VERY high.
IOTA — That was a big 🗝️ on IOTA.
BVOL24H [Jun 11, 2024] — It simply does not fail once at support. Once you know higher volatility is about to kick in, your job is to understand the direction with the highest probability. Measure the distance between CMP and your entry levels, while measuring the potential % downswing for Bitcoin — knowing alts move more % points vs BTC. You don't trade alts on LTFs against BTC's LTF/MTF trend.
[Oct 5, 2023] Bitcoin update:
What is the lowest TF you use when validating PA for bottoms of moves like this?
Up to whatever TF is showing more liquidity levels.
[Jan 15, 2025] Remember TSLA HTF bullish reversal? Similar here, but at an HTF supply level instead of demand. You won't encounter these every day, but they appear. Plan ahead. You don't need to chase. The market has thousands of instruments.
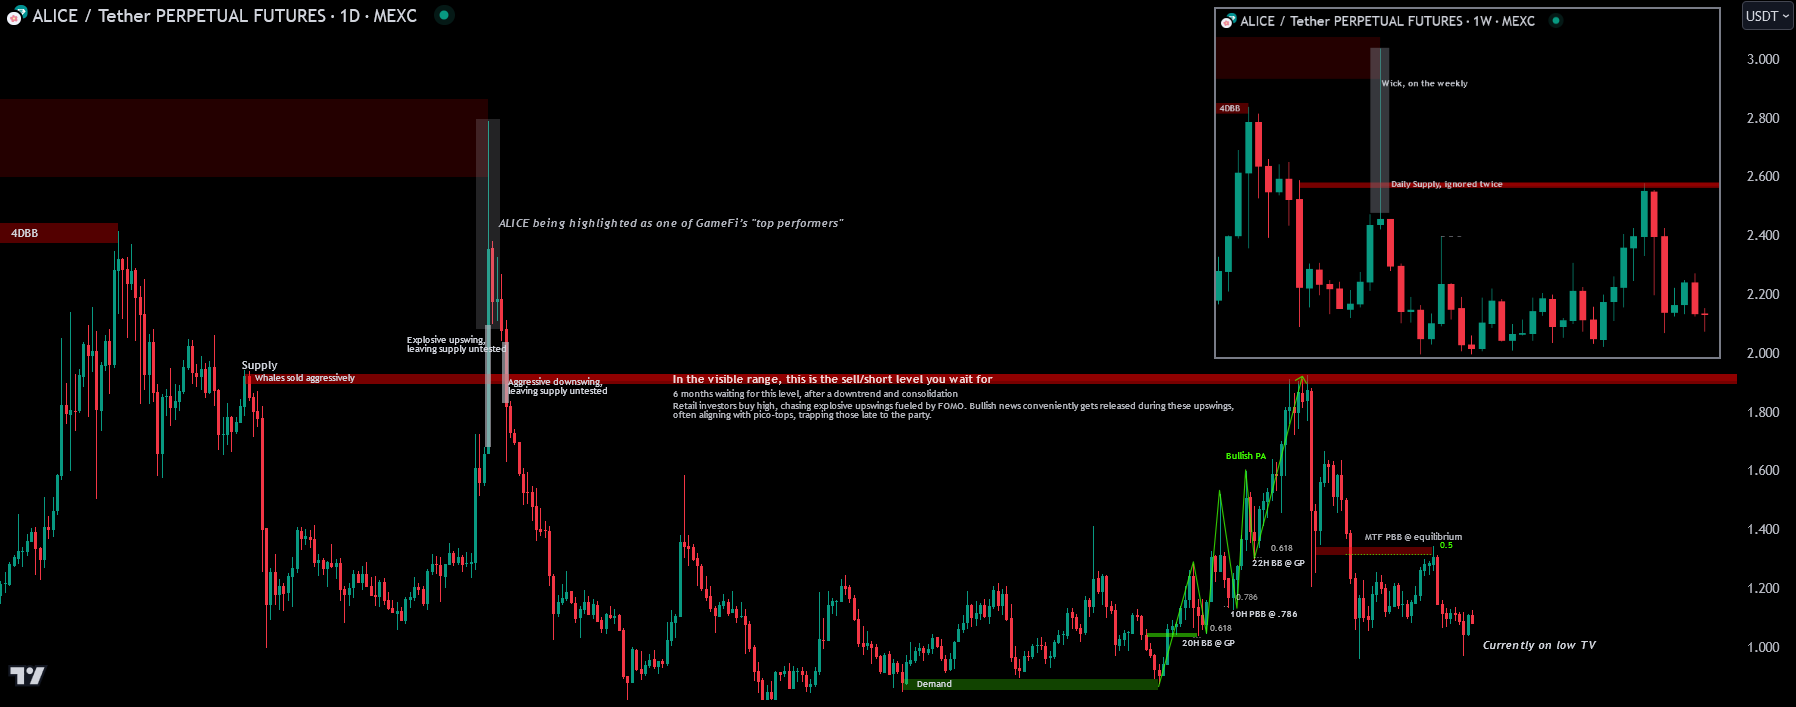
In the visible range, this is the sell/short level you wait for — 6 months waiting for it after a downtrend and consolidation. Retail buys high, chasing explosive upswings fueled by FOMO. Bullish news conveniently gets released during these upswings, often aligning with pico-tops, trapping those late to the party.
A final reminder on the structure of news and tops:
Tops have only FOMO news. Bottoms have only FUD news. If you see a "mix," the HTF move isn't done.
That's the taxonomy. Four bands, with a known liquidity gradient. Balanced TFs first, unbalanced TFs as refinement. HTF for size, MTF for the body of your trades, LTF and Micro for refinement and scalps once you've already mastered the slower game. Dig until you find — but don't dig forever. The more confirmations across TFs, the more powerful the level. The higher the TF, the bigger the dollars and the fewer the fakeouts.
If you didn't understand some conepts here such as:
- How exactly do I get that supply and demand?
- How did you draw your fibs like that?
- How can I micro-scalp like this?
This was only covering different timeframes. All of those questions will be answered in topic-dedicated future lessons 👁️