The Trading Dictionary: Acronyms You Must Know
Welcome to the Momentum Mentorship. Everything contained in this course is verified info by me, Tac. This contains info from both myself and reconstructed from people I have learned from, my mentors. There is very little you need outside of this course to go from 4 figures to 8 in a few years. It is simply up to you if you decide to take this seriously and put in the work.
Do not share this info without asking please, I would want to clarify exactly what you are sharing.
All the text surrounded by a blue bubble is a linked note in the wiki. For now, that wiki is disabled. The reason is I want you to read the course as expected without the source material first. Everything is structured in the correct manner and I don't want you skipping ahead learning in-depth about a concept that introduces more "advanced" concepts without learning the basics in order.
When you read my charts and posts, you'll see shorthand everywhere. This lesson is the reference. Bookmark it. Come back to it whenever a term shows up that you haven't internalized yet. The goal isn't to memorize a list — it's to recognize each acronym instantly so the chart reads like a sentence rather than a puzzle.
I've grouped the terms by what they describe: market structure, liquidity, the different kinds of order blocks, gaps and fibs, timeframes, and the trade-execution shorthand. At the end I'll cover a few extra abbreviations you'll see in the course (CT, HFT, HODL) so nothing trips you up.
Price Action and Market Structure
Start with the umbrella terms. Everything else hangs off these.
PA — Price Action. The movement of price plotted over time. You analyze patterns and formations in price action to make trading decisions without relying on indicators.
If you're asking what tool I use to find these charts: I don't use indicators. I rely on PA and can read it like if it was my native language. Ditch whatever retail is using, or 95% of it at least. That's not it. They're taught the losing way, regardless of some claiming to have decades in the game or thousands to millions of followers. Smoke & mirrors. Retail TA Patterns
It's not about quantity, but quality. 📈Price Action Rules
The real craft is hard to find around here.
For the most accurate PA data, change to the futures chart. CSPR
For most of the coins I trade, I follow PA on the exchange I trade on plus the highest trading volume exchanges charts on the same coin. ⭐Trading Coins Rules
Monthly PA is very powerful and with the highest probability to succeed.
PA is clear. Learn to read it, and smart money concepts will help you as well, plus liquidity and algos. Learn to spot whales footprints. When you do all these, you will be playing alongside whales and market makers, and not alongside retail. Forget indicators. They will keep you stuck in a "world" where you won't become a consistently profitable trader long-term. They're weak. They lag. They keep you confused. There are a couple of leading indicators, but they're still far from how powerful price action understanding is.
The problem is that newbies are learning it all wrong while thinking they found the Holy Grail because some dumb indicator made them do well in a couple trades and some random anon with 100,000+ followers claims to be the real deal. That's the beginning of the end for the vast majority of new traders. The most important thing to thrive in life is to find the right knowledge early. Choose your sources wisely.
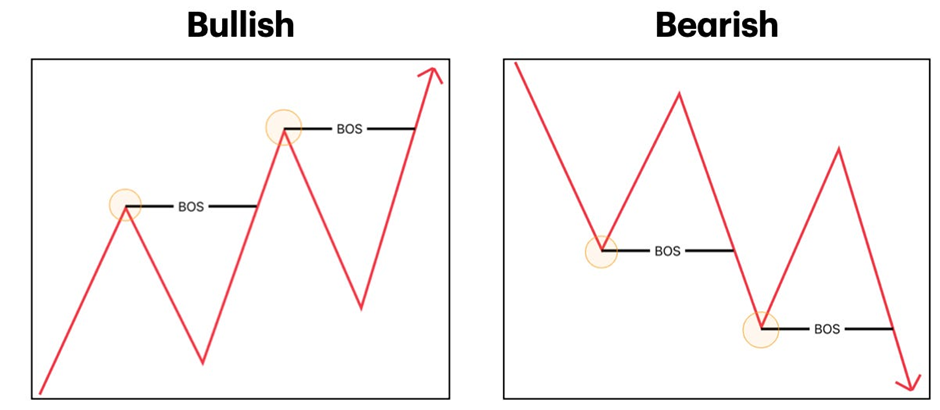
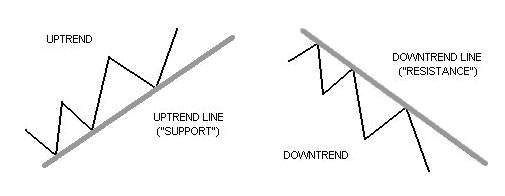
MS — Market Structure. The pattern of highs and lows in the market that defines the current trend. You analyze market structure to determine whether the market is trending upwards, downwards, or moving sideways. See MARKET STRUCTURE and Market Structure (Intro).
The four building blocks of structure:
- HH — Higher High
- HL — Higher Low
- LH — Lower High
- LL — Lower Low
BOS — Break of Structure. Occurs when the price breaks through a key support or resistance level, indicating a possible trend change. It confirms that a new trend may be starting, prompting traders to enter or exit positions. See 🔷Break of Structure.
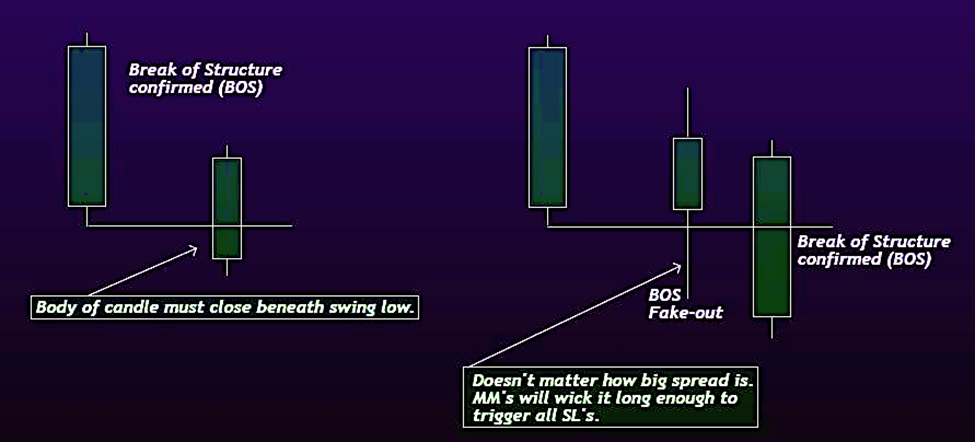
BOMS — Break of Market Structure. The point where price breaks through a previous high or low, indicating a change in the trend. A bullish BOS occurs when price breaks a previous swing high, while a bearish BOS happens when price breaks a previous swing low.
When students ask what confirmations I'm looking for in order to short — FVG, GP at the fibs, trendlines? — the answer is HTF body close above/below previous HTF swing high/low. That's BOMS.
You'll also see MSB (Market Structure Break) and MSS (Market Structure Shift) — same family of ideas. And CHoCH — Change of Character. See Break Of Structure & Change Of Character.
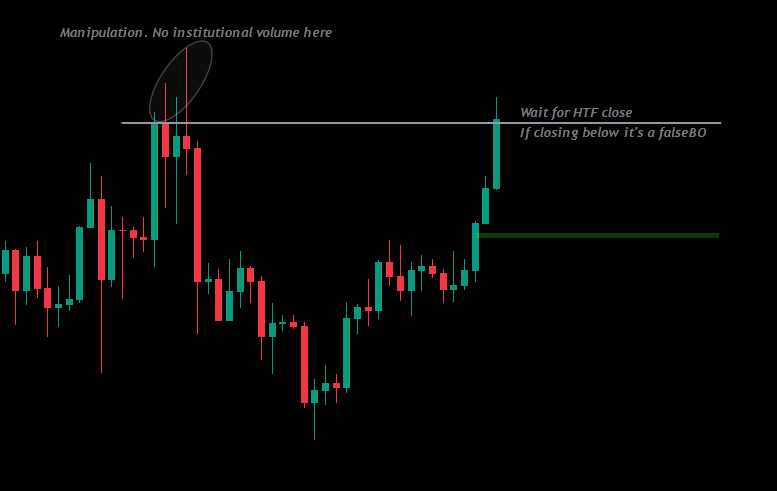
BO — Break Out. Related to BOS, but watch out for the False Breakout. Remember to never chase BOs if you want the highest probability opportunities. TAO
Notice how REKT all the break-out and bullish engulfing crypto bros got? Their success rate is minimal. Just enough for them to claim they've been right a couple of times, out of one hundred forecasts. Chasers are losers. Find > Wait > Enter > Win. ⚠️ Never Chase.
Retail Fail Charts — how to REKT break-out traders 101:
Your entry? On the pullbacks, at key levels, while retail traders get REKT.
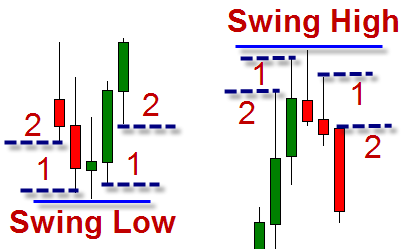
SH — Swing High. SL (in the swing context) — Swing Low. These are the actual pivot points on the chart. Don't confuse SL the swing low with SL the stop loss; both abbreviations exist and context tells you which.
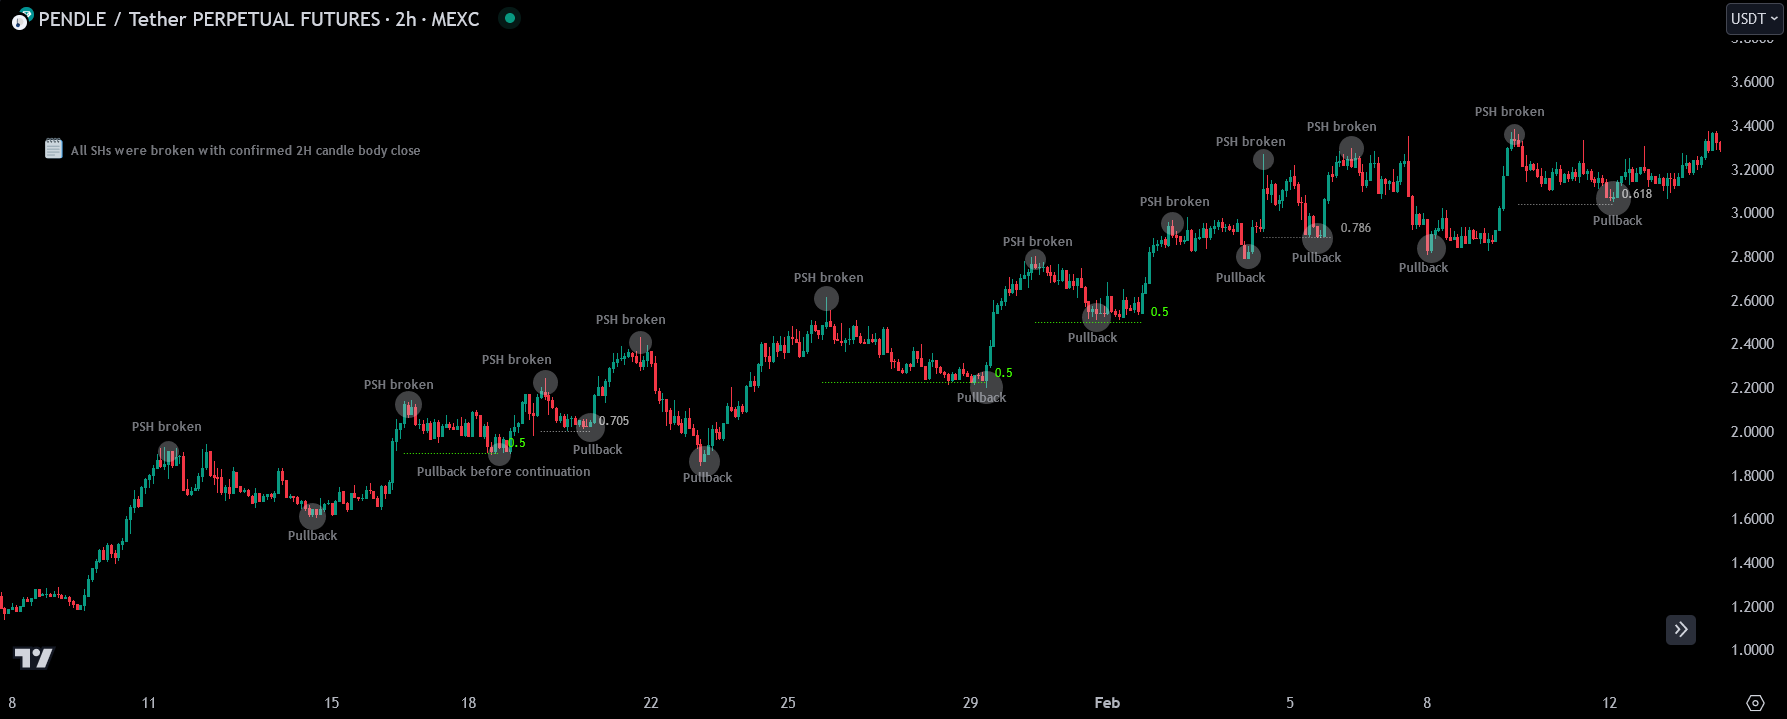
PSH — Previous Swing High. The last significant high point before a downward move. The highest point of a price swing in a past uptrend. Used as potential resistance or a target for taking profits.

PSL — Previous Swing Low. The last significant low point before an upward move. The lowest point of a price swing in a past downtrend. Acts as potential support or an entry point for buying.
EQH — Equal Highs. When the market reaches the same high price level multiple times. Forms a resistance level. Equal highs attract liquidity, as traders place stop-losses above these levels, making it a target for price manipulation before a potential reversal. See also EQL.
EQL — Equal Lows. When the market reaches the same low price level multiple times. Forms a support level. Equal lows act as liquidity pools, as stop-losses below this level may be targeted by institutional players before a potential bullish reversal. See also EQH.
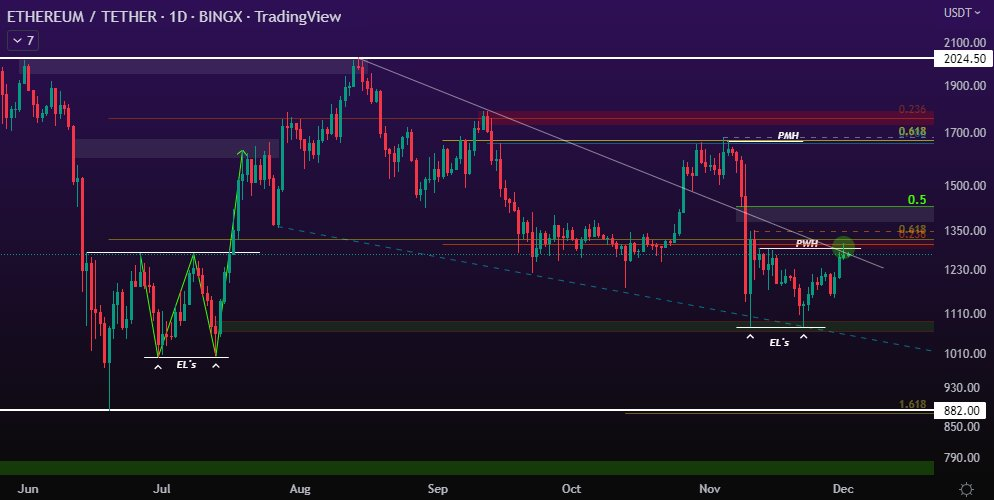
[Dec 1, 2022] ETH 🎯
RH — Range High. The highest price level within a trading range, acting as a resistance zone. Traders watch the range high for potential breakouts or to identify points where the market may reverse back towards the range low. See Ranges.
RL — Range Low. The lowest price level within a trading range, serving as a support zone. Range lows are watched for potential breakdowns or reversals as price oscillates between this and the range high.
SOS — Signs of Strength. A pattern or price behavior that indicates the market or asset is gaining bullish momentum. It suggests buyers are in control, often leading to further upward movement. Signs of strength can include higher volume on upward moves, successful breakouts above resistance, or strong bullish candles that push through key levels of supply. A convincing breakout out of range with significant volume.
In Wyckoff Accumulation, SOS is a price advance on increasing spread and relatively higher volume. Often an SOS takes place after a spring, validating the analyst's interpretation of that prior action.
SOW — Signs of Weakness. A pattern or price movement that indicates the market is losing strength and is likely to reverse to the downside. Signs of weakness can include failed breakouts, decreasing volume on up moves, or a failure to hold key levels.
In Wyckoff Distribution, SOW is observable as a down-move to (or slightly past) the lower boundary of the trading range, usually occurring on increased spread and volume. Supply is now dominant.
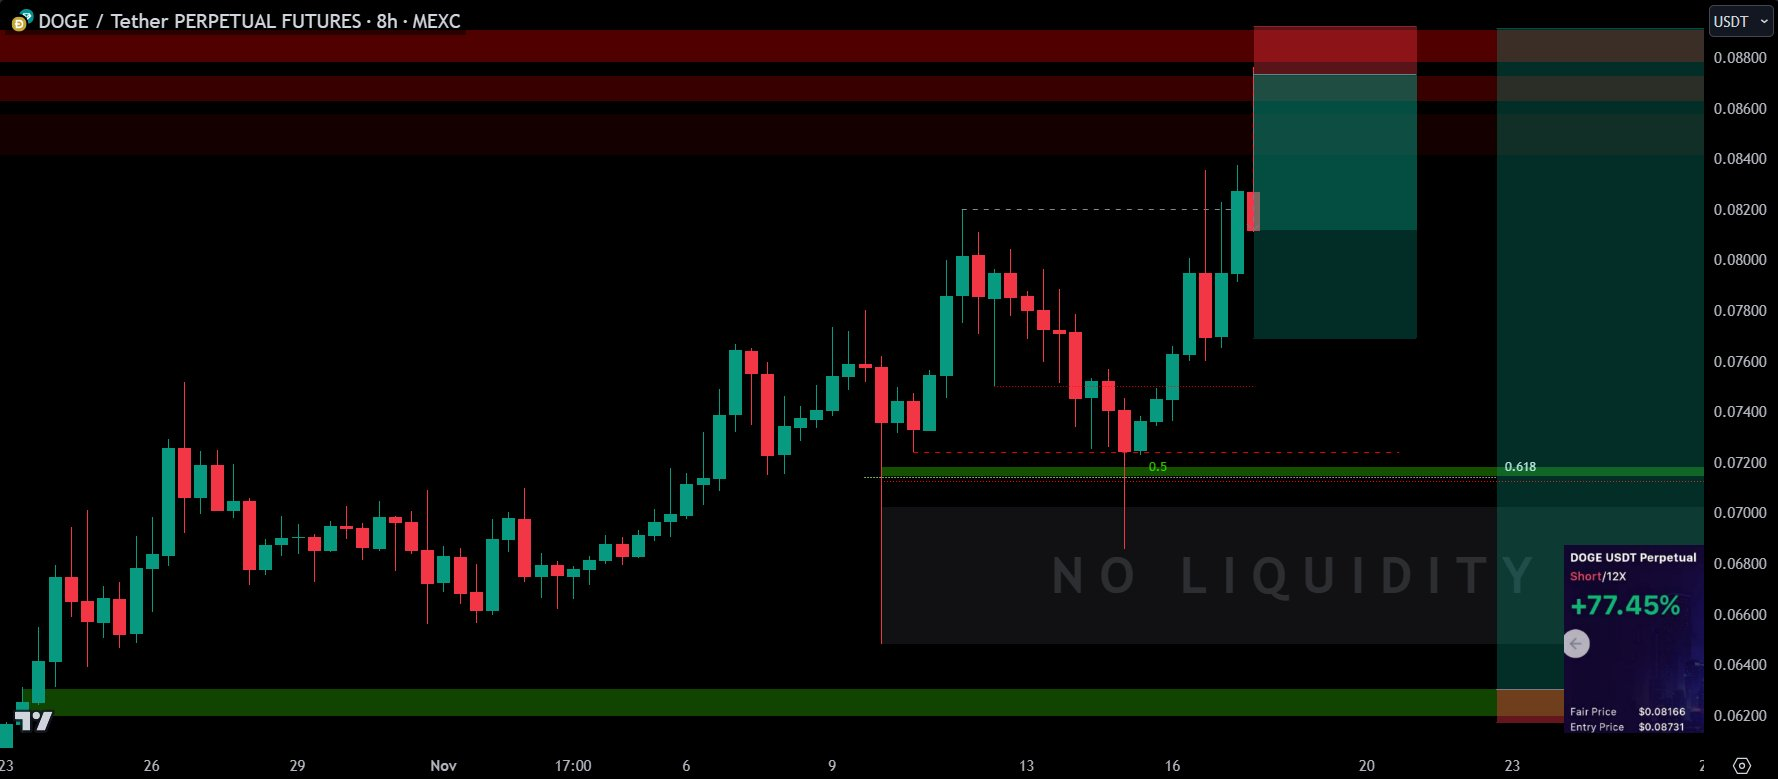
Examples — [Nov 13, 2023] $DOGE: just about to touch entry, but I scrapped this very tight long opportunity due to LTF SOW. There was no point to enter with a wider SL as there was no liquidity to hold price anywhere below $0.071ish. If entering a "no liquidity" area with a 2H+ body, it can ⚡️ down up to -10%.
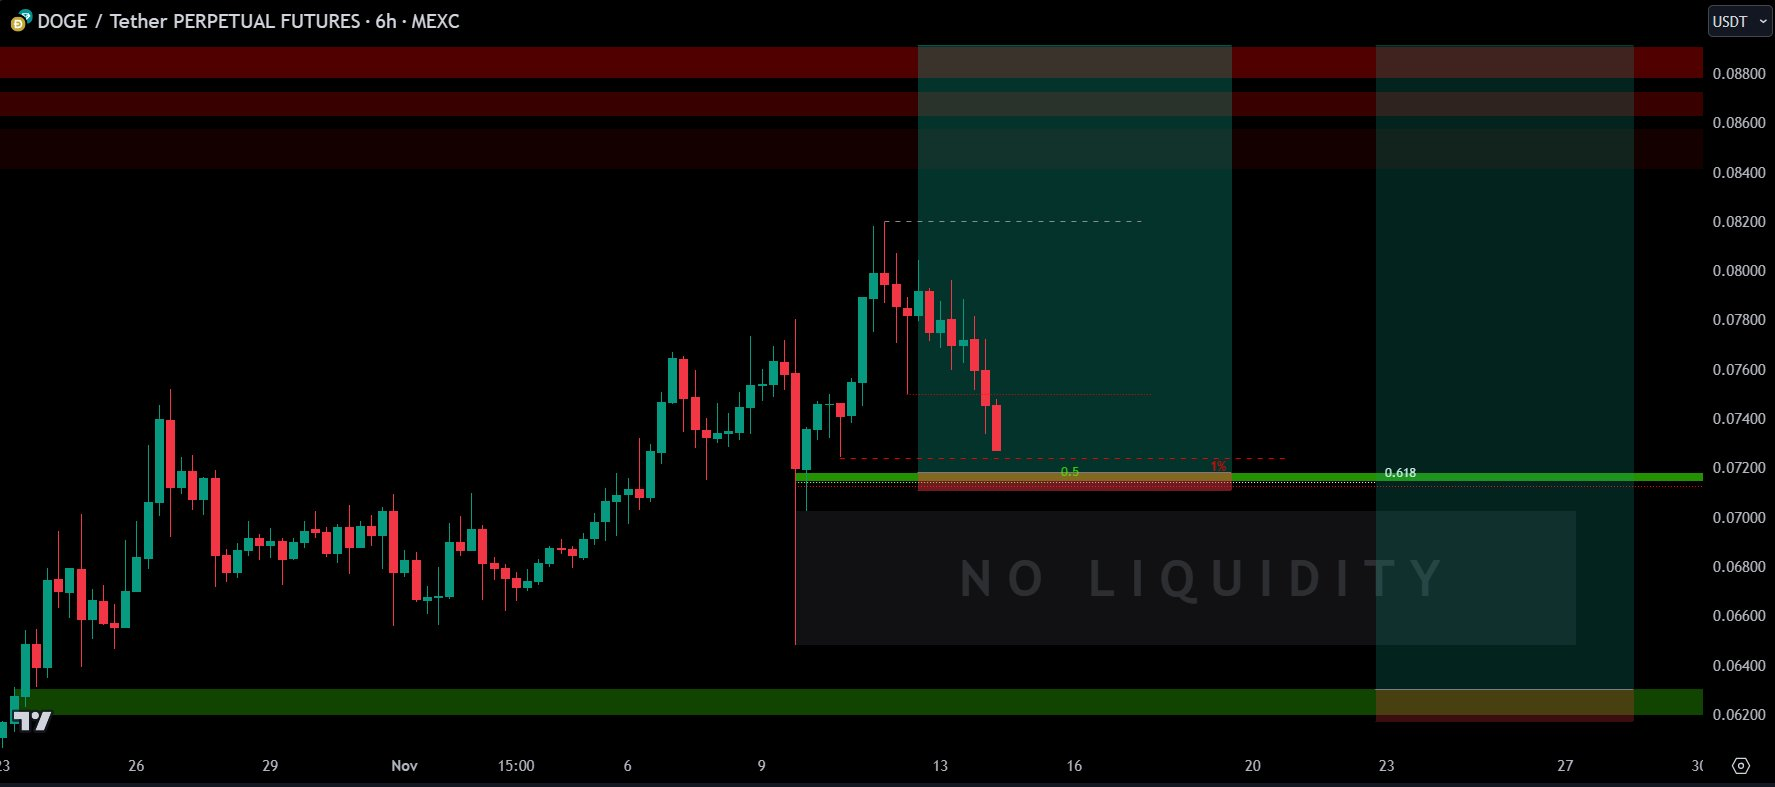
A student asked: Why is there no liquidity under that line? — Bodies hold liquidity. Wicks, it depends. This one didn't.
[Nov 17, 2023] $DOGE perfectly avoided entering long when a scam wick was loading, then shorted at the level mentioned earlier on red bands.
TL — Trendline. A line drawn over pivot highs or under pivot lows to show the prevailing direction of price. Connects higher lows in an uptrend or lower highs in a downtrend. Trendlines help you visualize the direction of the trend and can act as dynamic support or resistance levels. See Retail TA Patterns.
Liquidity
Liquidity is what makes markets move. Every term in this section is about where the orders are and who's getting hunted.
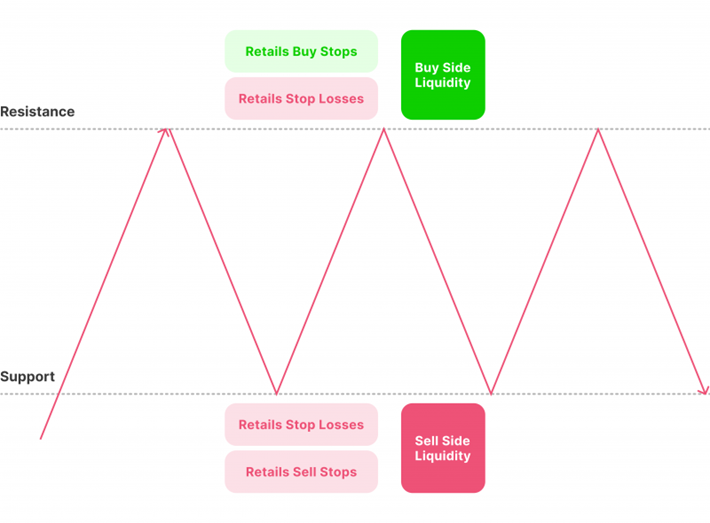
BSL — Buy Side Liquidity. Areas in the market where buy orders are clustered, often above recent highs. A pool of buy orders and stop-losses resting above resistance levels. Market makers and large players often push the price upwards to trigger these orders before reversing the market, as these liquidity zones represent areas of interest for them.

Buy-side liquidity represents a level on the chart where short sellers will have their stops positioned.
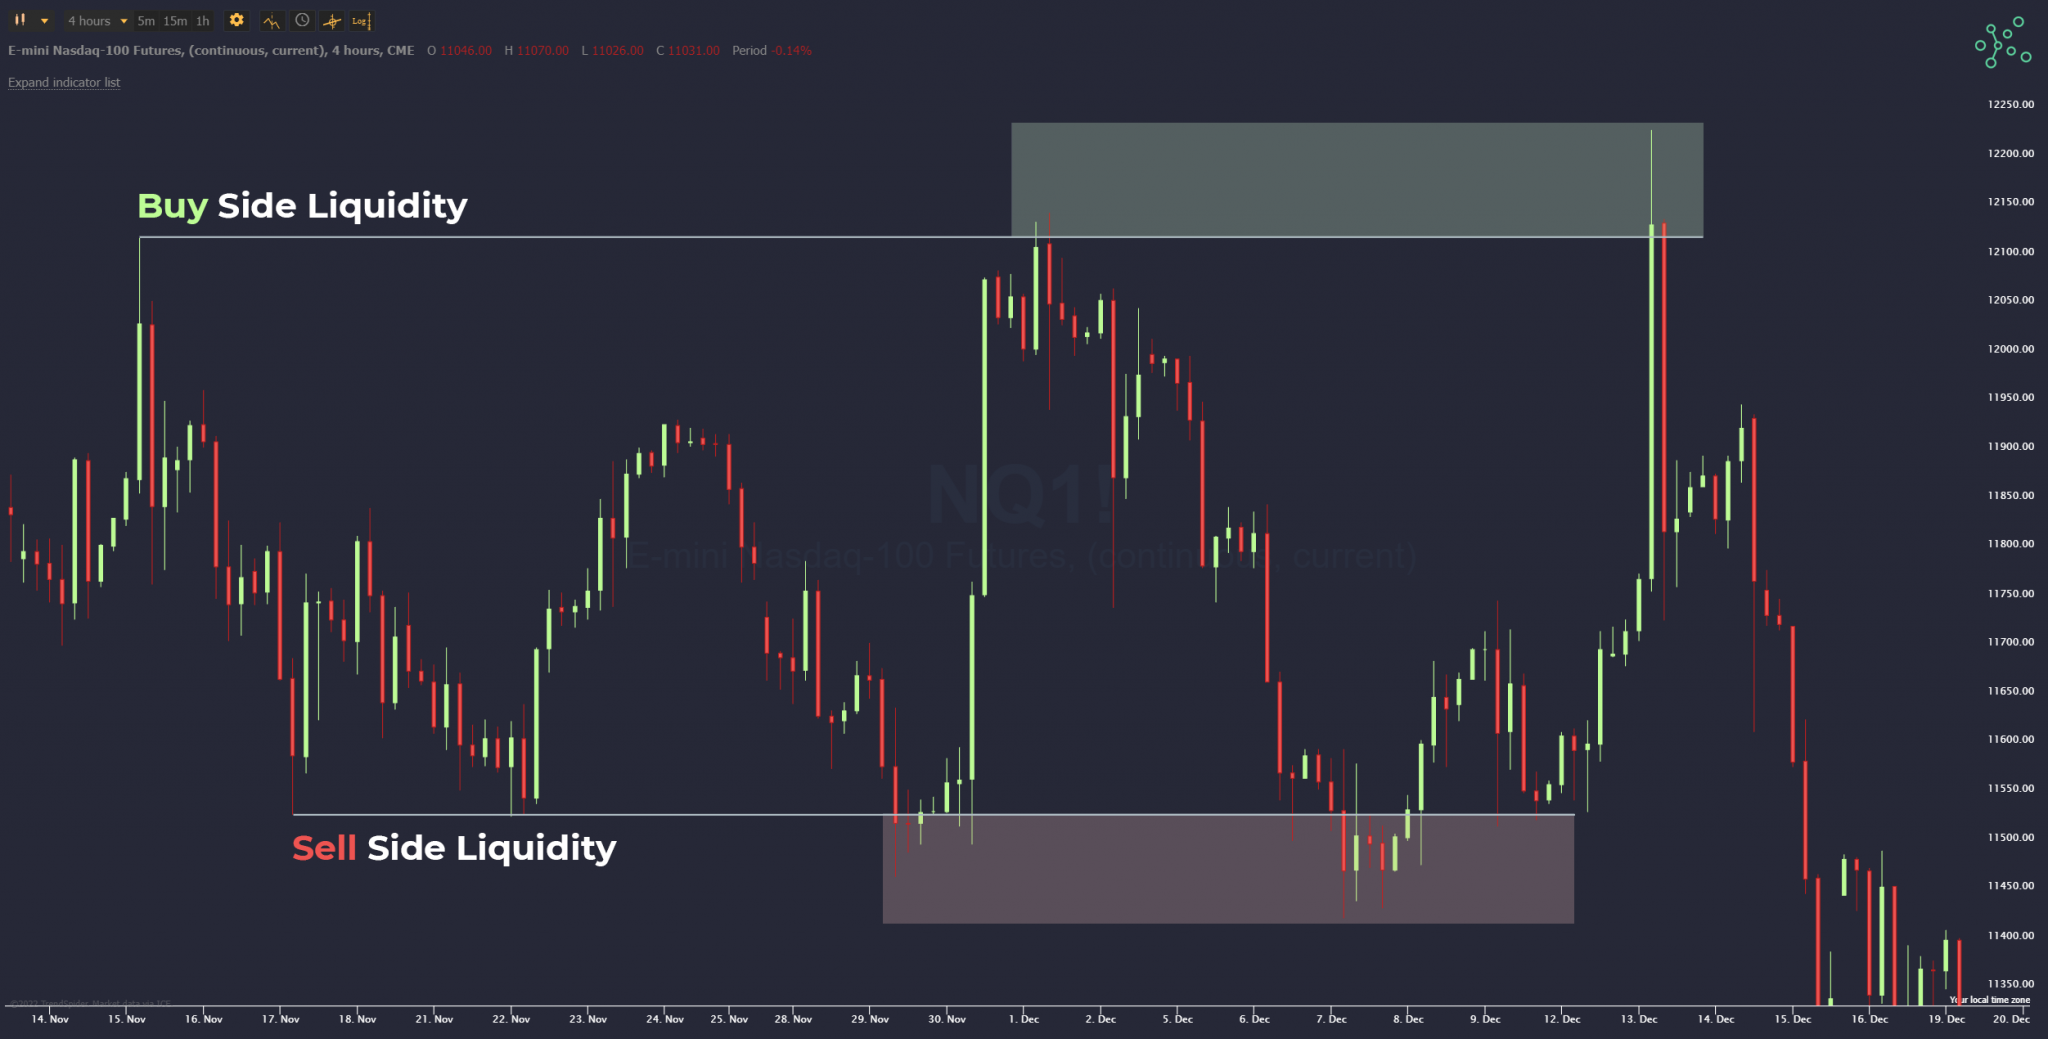
SSL — Sell Side Liquidity. Areas where sell orders are clustered, often below recent lows. A pool of sell orders resting below support levels. These orders are often targeted by institutional traders or market makers before reversing the price back upwards, as they represent liquidity needed to fill larger orders.
A nuance worth knowing. A student once asked: When you long a position based on OBs, aren't you worried about wicks sending the price below that OB to take out the sell side liquidity? My answer: "Sell side liquidity" is bullshit. Unlearn and relearn. No, not worried at all.
What I mean is that the textbook idea that price has to sweep below an OB to grab "sell side liquidity" before reversing — that framing is retail noise. The OB itself is the liquidity. See 4 Liquidity.
SFP — Swing Failure Pattern. Tied directly to liquidity sweeps. See 4 Liquidity.
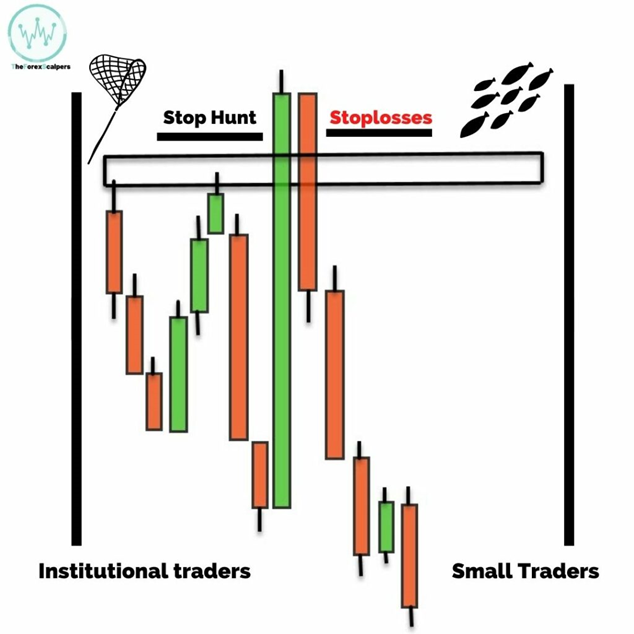
SLH — Stop-Loss Hunting. When the price moves to trigger stop-loss orders before reversing direction. A market manipulation tactic where price is deliberately pushed to trigger stop-losses placed by retail traders. Once these stop-losses are triggered, liquidity is created, and larger players can enter positions more easily. Place your stops strategically to avoid common stop-hunting zones.
Order Blocks: OB, BB, HOB, NOB, and the Partials
Order blocks are levels. The naming gets dense, but the structure is simple: there's an OB, and depending on whether it's hidden, naked, or partially mitigated, you give it a different label.
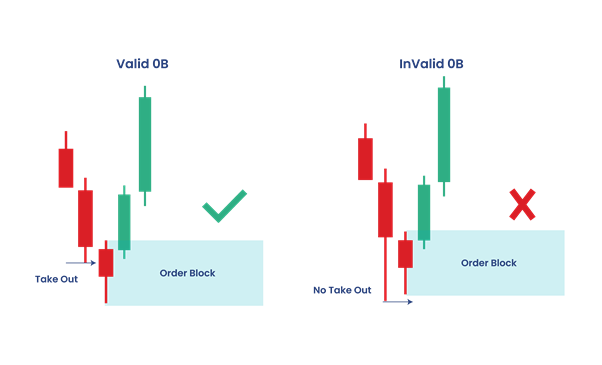
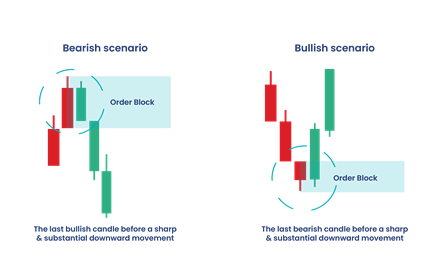
OB — Order Block. A consolidation area where large institutional orders are placed, acting as significant support or resistance. A price area where institutional buying or selling occurred. These blocks often serve as key support or resistance zones, as large players may return to these levels to defend their positions.
Wicks may not be used for OB.
For deeper reading: Order Blocks, Partial Order Blocks, Hidden Order Blocks. Beginner guide: Order Blocks Guide. Decoding Group: Order Block Intro.
Order Blocks ARE liquidity that is being created.
BOB — Bearish Order Block. A key price area where large institutional selling occurred. It represents strong resistance where sellers are likely to re-enter the market, signaling potential bearish price movements when the price returns to this level. See Order Blocks.
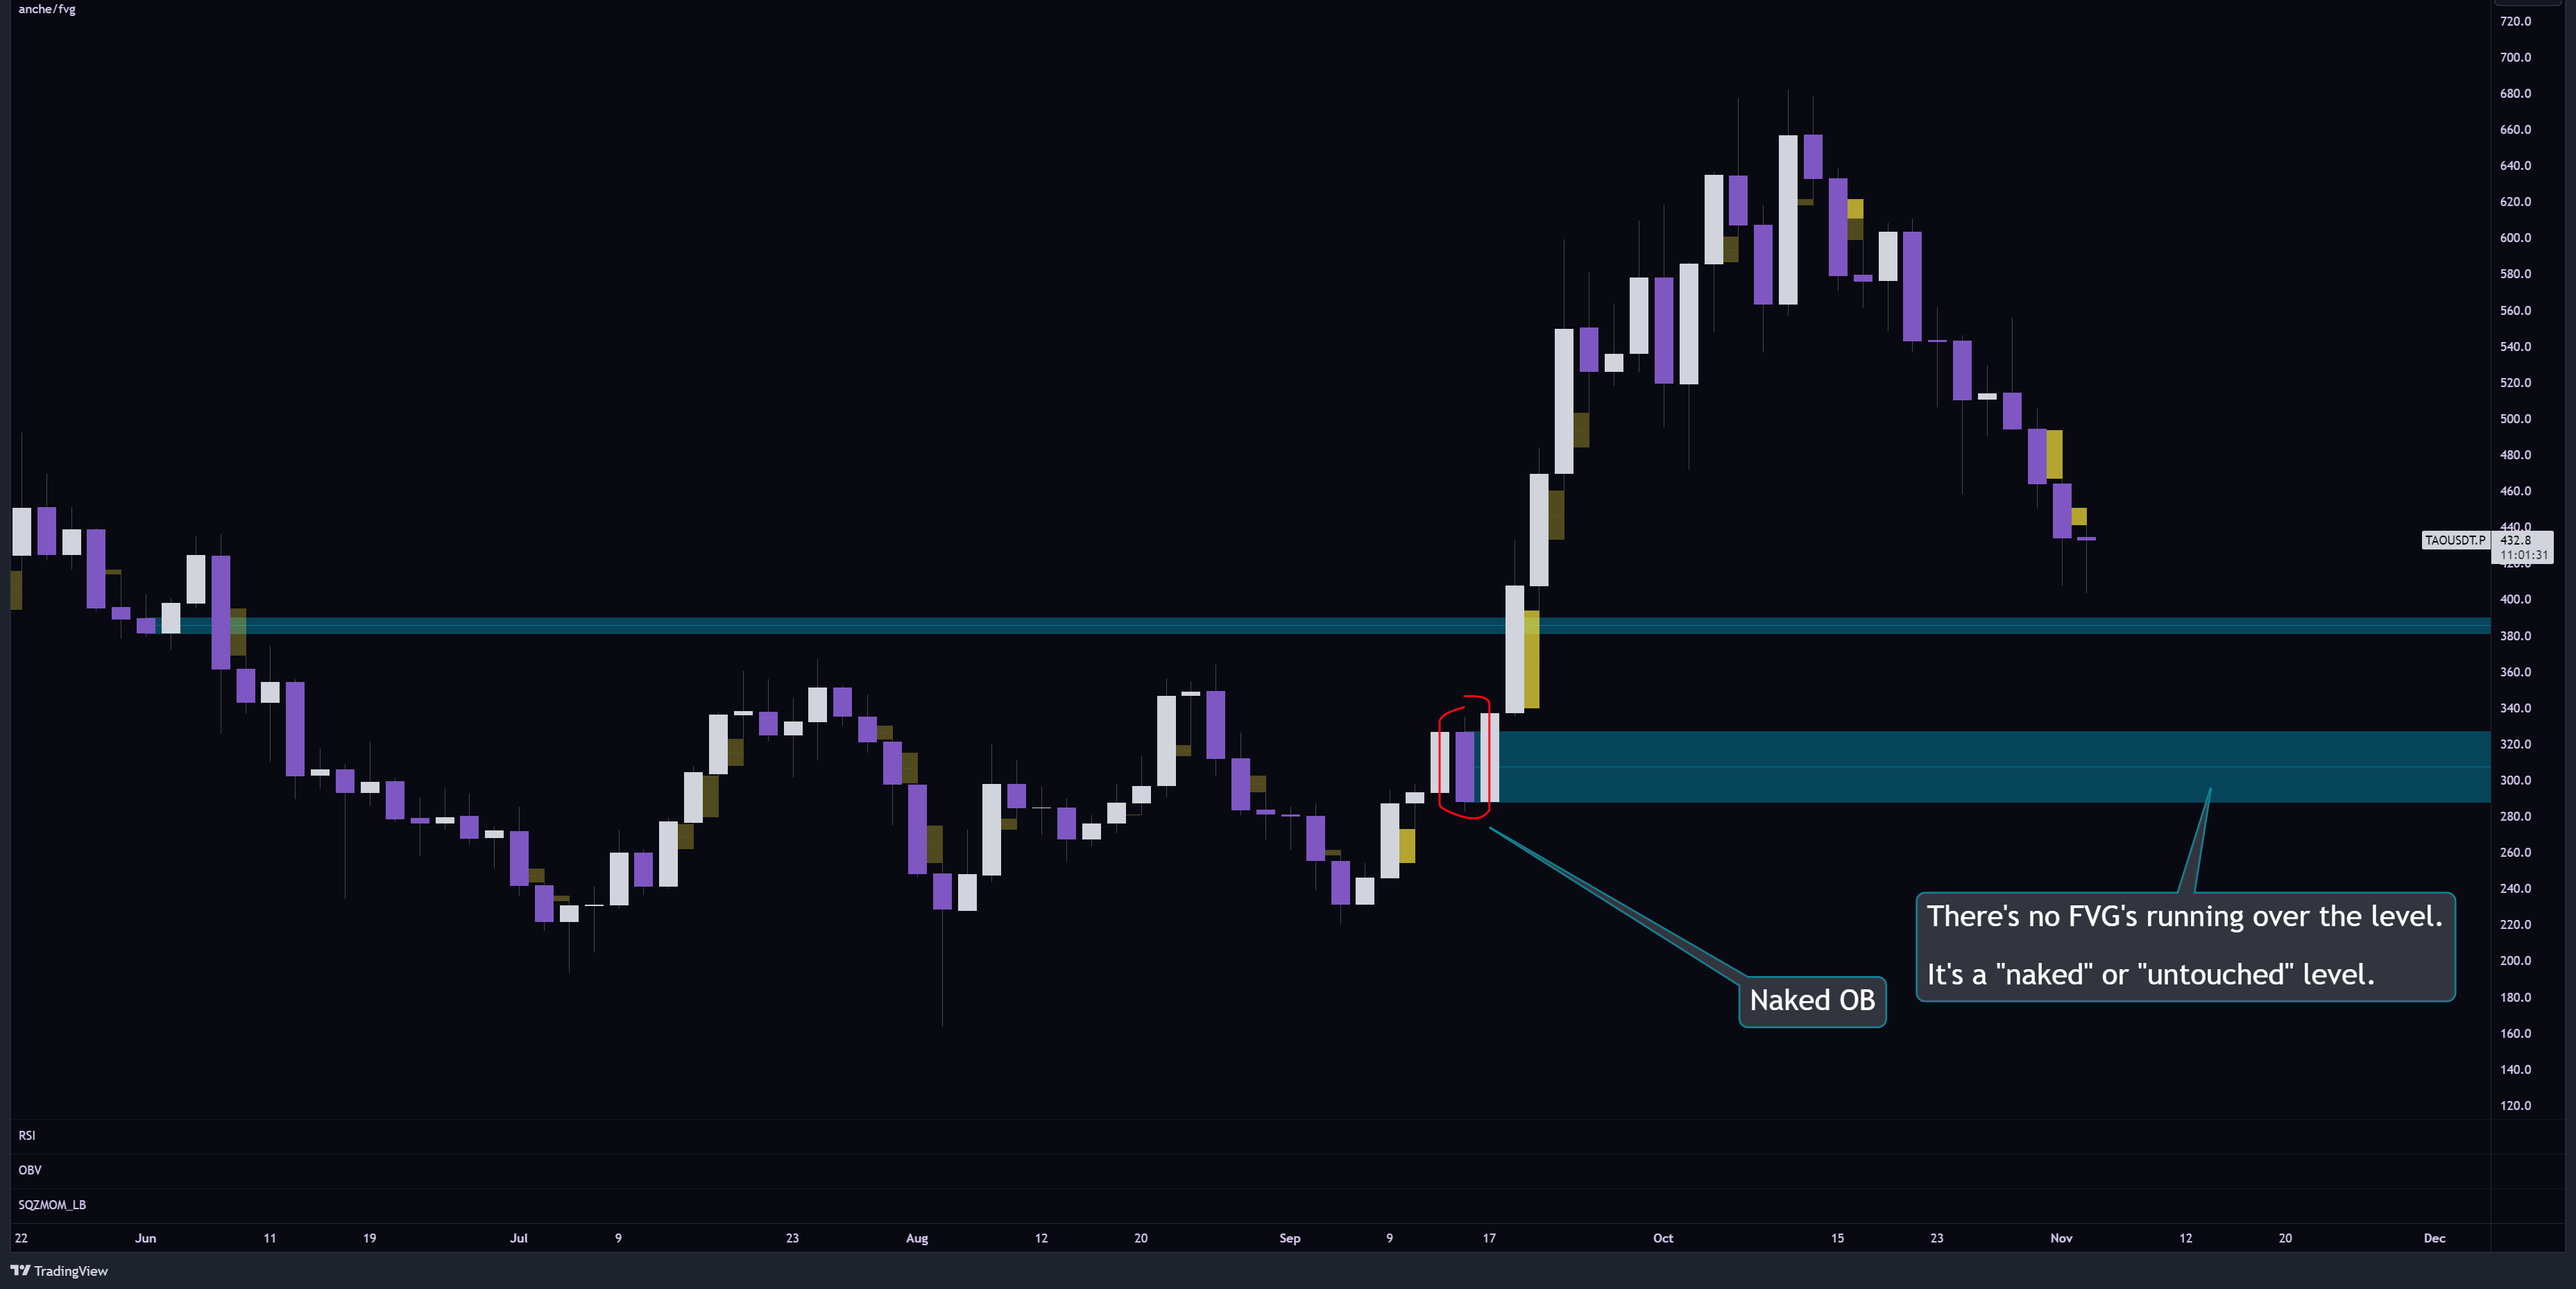
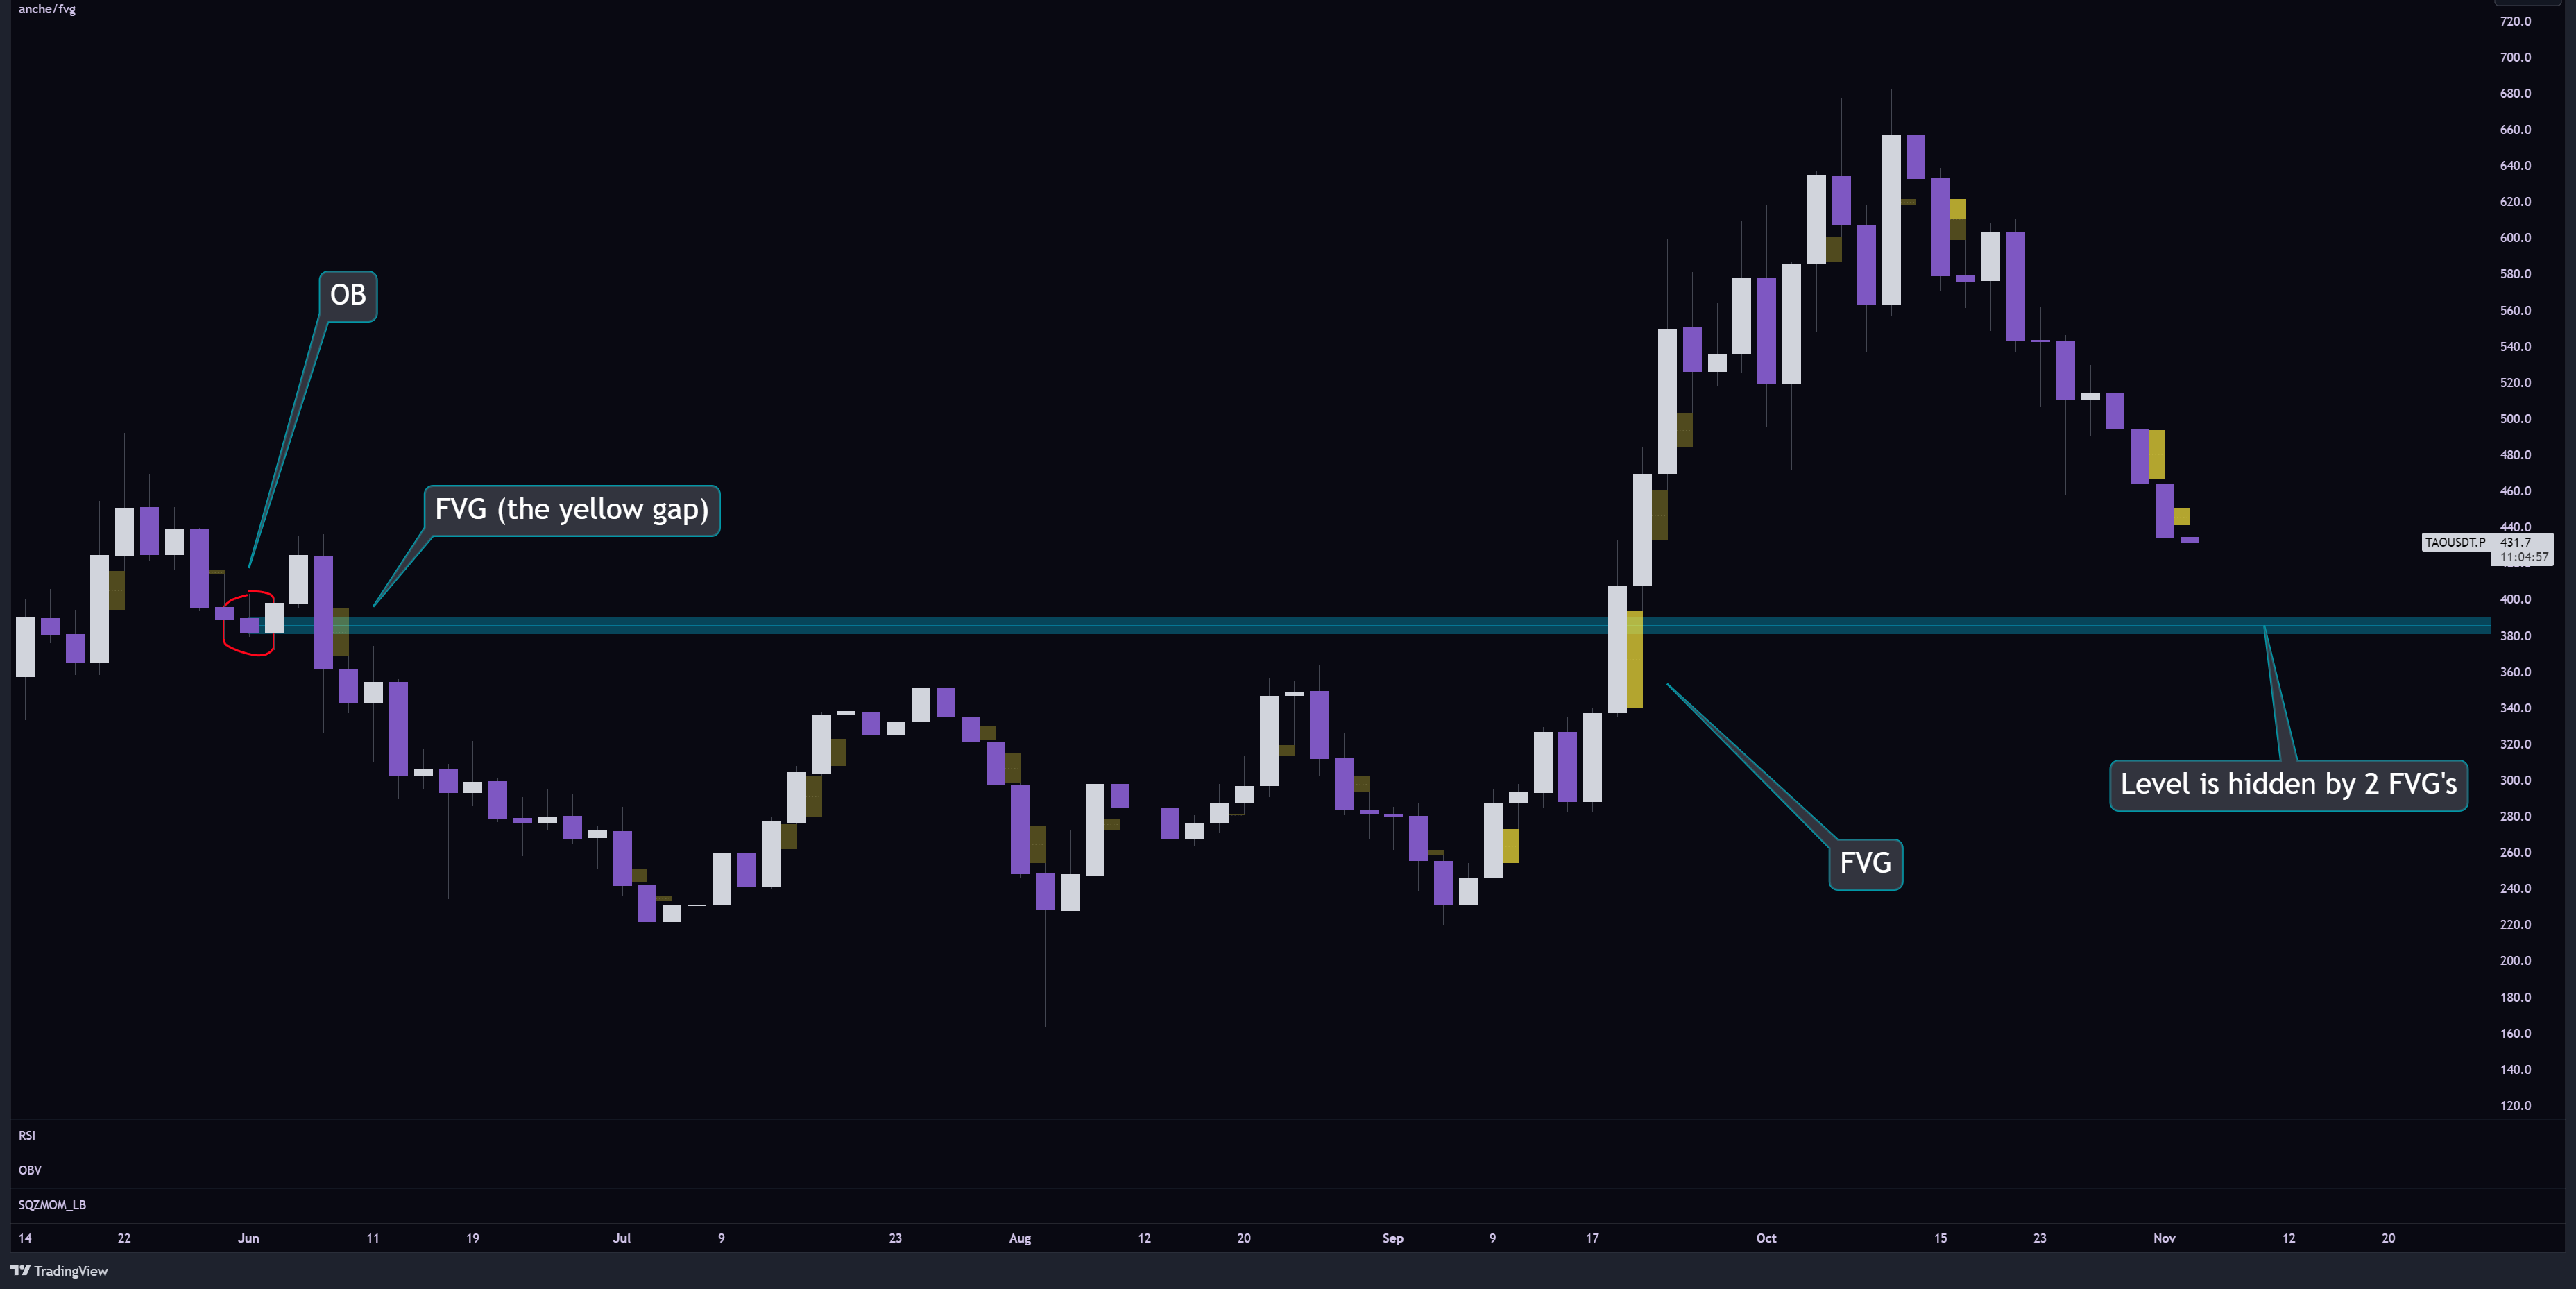
NOB — Naked Order Block. Retail can see these blocks because there are no FVGs running over the OB level (which would hide it). If the order block is open for everyone to see, it's a naked order block (naked = seeable).
Example of NOB:
Example of HOB (for contrast):
HOBs are more powerful, more optimal, more likely to have a reversal. It's one of the most important things to internalize.
More NOB examples:
[Nov 13, 2023]
[May 14, 2024]
HOB — Hidden Order Block. Same as a BB. Hidden meaning that FVG's are running over the OB level (which would make retail think that the level is "touched" already and therefore lost its reversal power).
A Breaker Block that used to be a bullish or bearish order block but failed, causing a shift in market direction. It can now act as a key level of support or resistance, depending on whether the market has turned bullish or bearish.
Example of NOB:
Example of HOB:
BB — Breaker Block. A price zone where the market breaks through a previous support or resistance level and then retests it before continuing in the original direction. You use Breaker Blocks to identify potential reversal or continuation points. When the price revisits this zone, it may present an opportunity to enter a trade in the direction of the original break. See Breaker Block.
A BB is an order block that has failed to hold its position, resulting in a reversal of market direction. For example, a bullish order block may fail, leading to a bearish reversal. When this happens, the order block becomes a "breaker," and it can act as future resistance or support in the opposite direction. Essentially, a BB marks a shift in market sentiment where a previously strong area becomes a turning point for price.
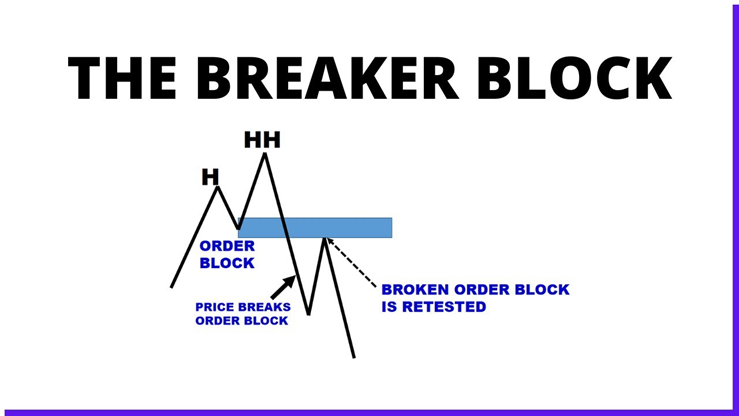
Now, the relationship between HOB and BB. Most people would call that HOB a BB (breaker block), but personally I just call them HOBs. Either label would be technically correct. They're not exactly the same thing, but the labels are interchangeable, because in order to be a BB it has to be hidden to some degree. So HOB is inherently implied in a BB. And an HOB level can't have any FVGs running over it unless it's a BB. So all HOBs are BBs (not OBs).
Don't worry if that doesn't fully click yet. Just know to associate BB with HOB:
- HOB = BB
- NOB = OB
The partials, for completeness:
POB — Partial Order Block. See Partial Order Blocks.
PBB — Partial Breaker Block. Same definition as PHOB (partial hidden order block).
PHOB — Partial Hidden Order Block. A BB that has been slightly wicked into (the rest may still be valid). Same definition as PBB. A Breaker Block or Hidden Order Blocks that has been partially wicked into by price but not fully mitigated or tested. The price has entered this area but hasn't fully moved through it, leaving part of the order block untested. These areas can act as potential support or resistance, as the market may revisit the untouched portion of the order block in the future for full mitigation. See Partial Order Blocks and HOB.
DBB — Daily BB. WBB — Weekly BB.
FW — Fresh Wick. I came up with the name "fresh wick" for ease of labeling, as the name "supply" is a bit broad for me. See SUPPLY & DEMAND SELECTION AND REFINING.
A fresh wick is simply the part of the wick that is still fresh in a supply zone. We only use it in the absence of HTF BBs / HOBs. A supply zone can be refined into the fresh wick if the supply is large and needs refining. The fresh wick can also be refined into lower TFs' fresh wicks and/or OBs or simply wicks (for a no-body supply). HTF FWs very close to each other can also be joined, just like how we do with OBs or BBs/HOBs.
Gaps and Fibs
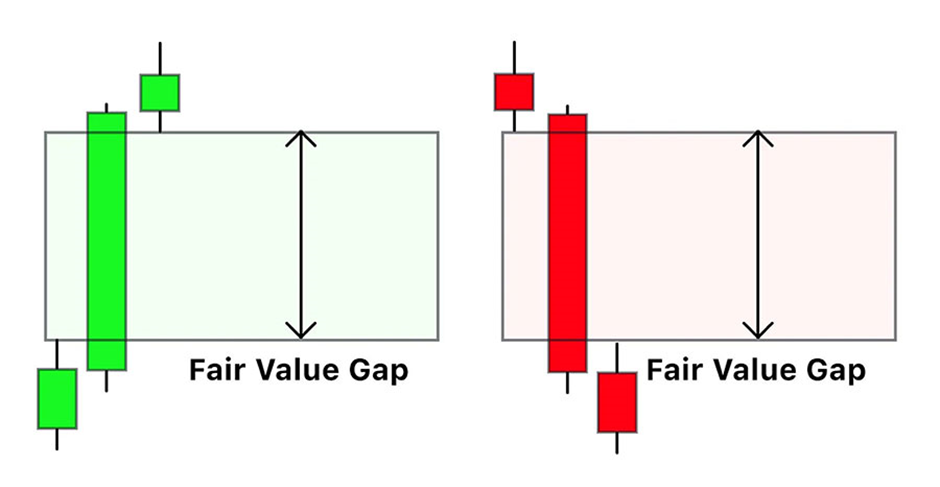
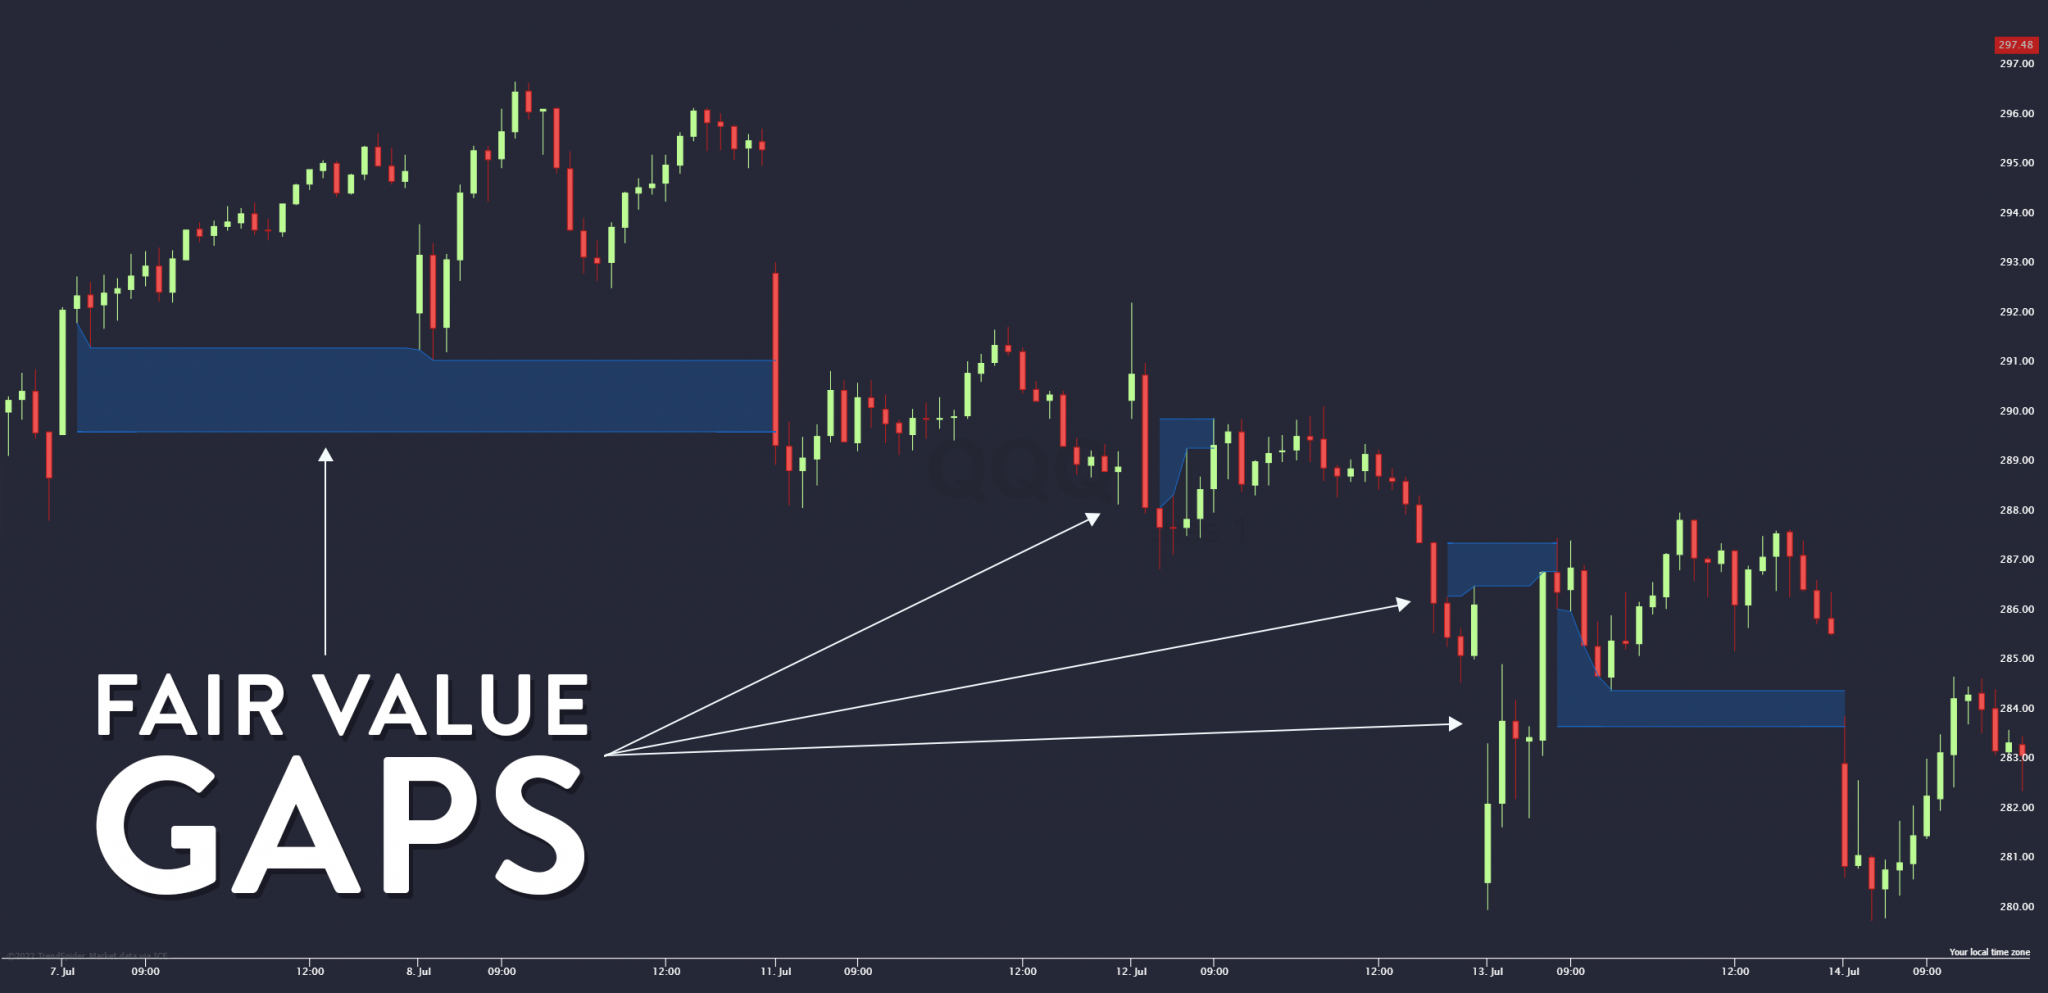
FVG — Fair Value Gap. A gap on the price chart where little to no trading has occurred, often due to rapid price movements. You expect the price to retrace to these gaps to "fill" them, providing trading opportunities.
A price gap where one side of the market (either buyers or sellers) is more aggressive, causing an imbalance. This gap can act as a magnet for price to return and "fill" the imbalance, as the market seeks to achieve equilibrium between buyers and sellers. See 🔷Fair Value Gaps.
Understanding Fair Value Gap:
🔷Fair Value Gaps are most commonly used amongst price action traders and are defined as instances in which there are inefficiencies, or imbalances, in the market. These imbalances simply suggest that buying and selling are not equal.
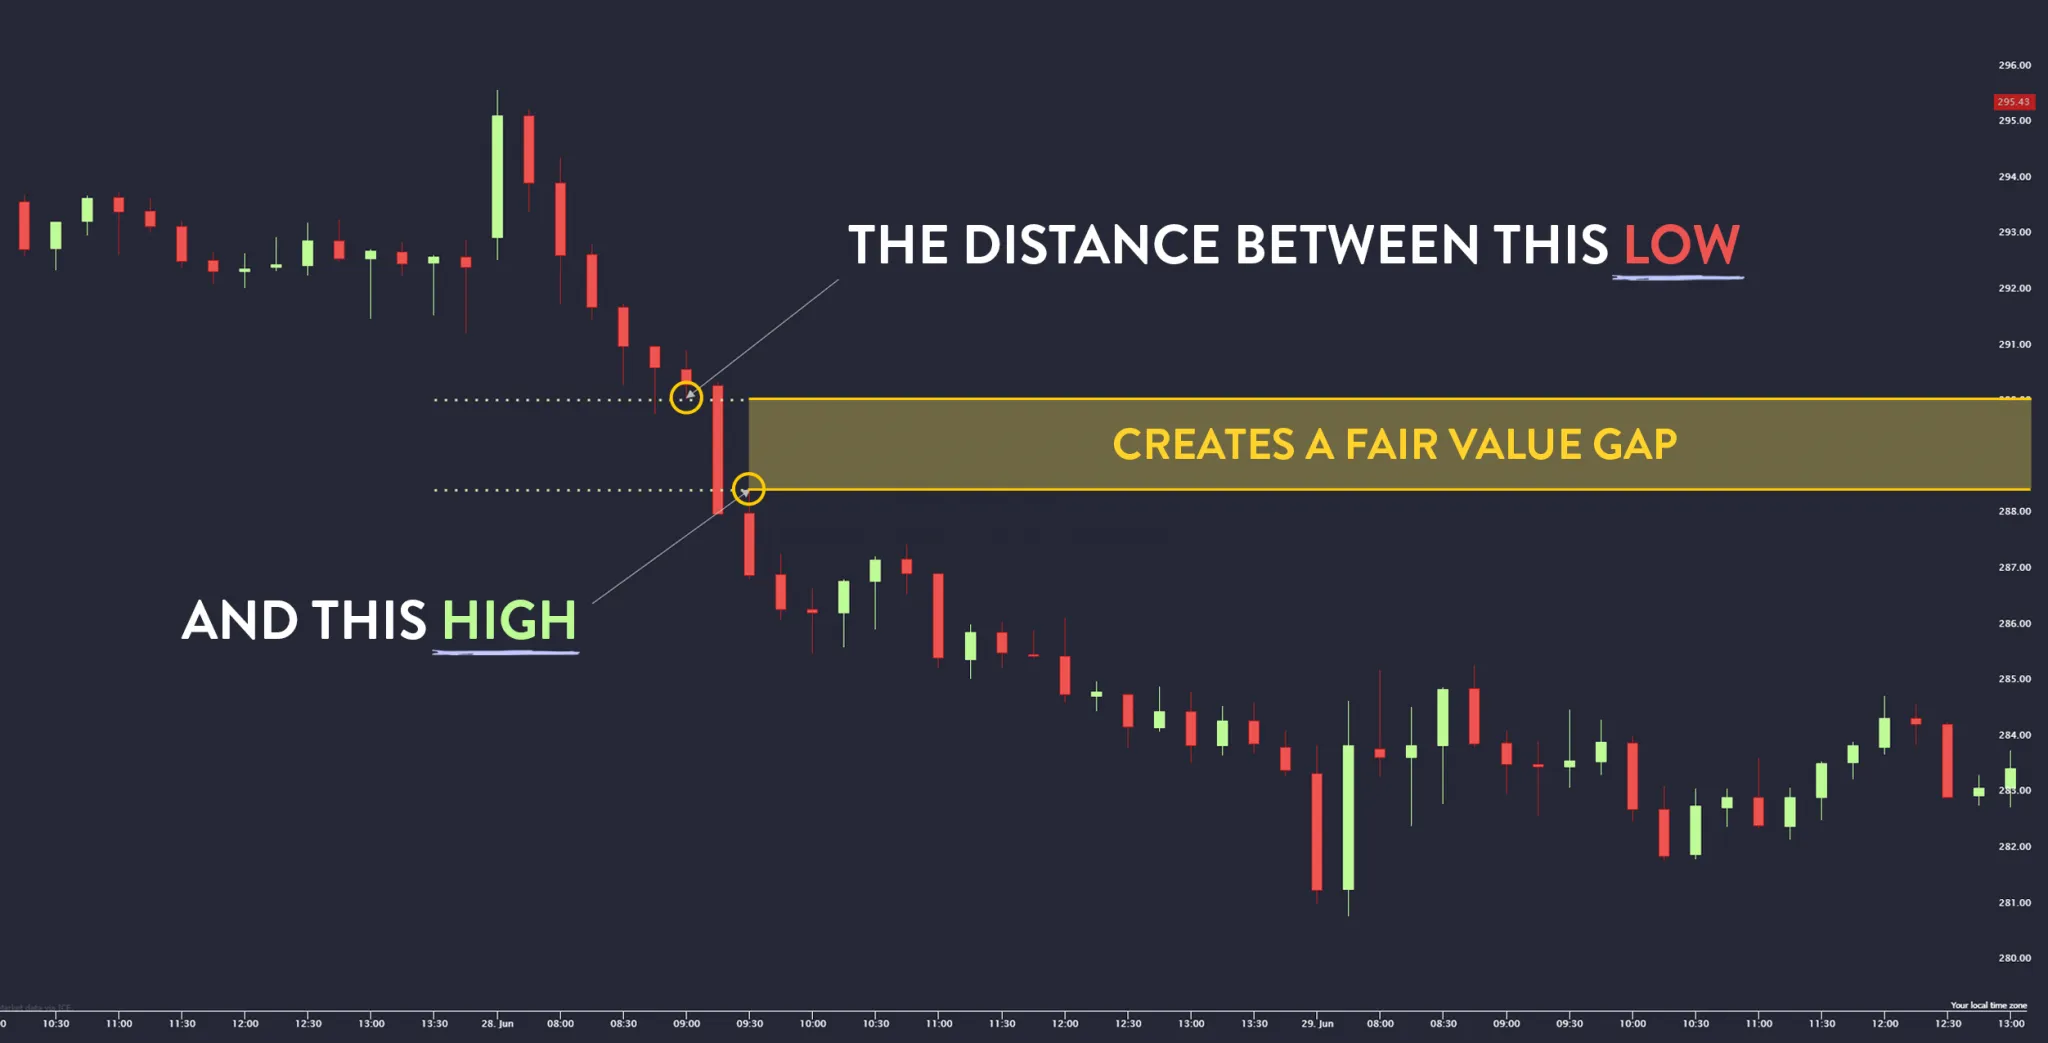
Fair Value Gaps are created within a three-candle sequence and are commonly visualized on the chart as a large candle whose neighboring candles' upper and lower wicks do not fully overlap the large candle.
The reason a trader might be interested in where these FVGs occur is that the imbalance created by them can become a magnet for price in the future.
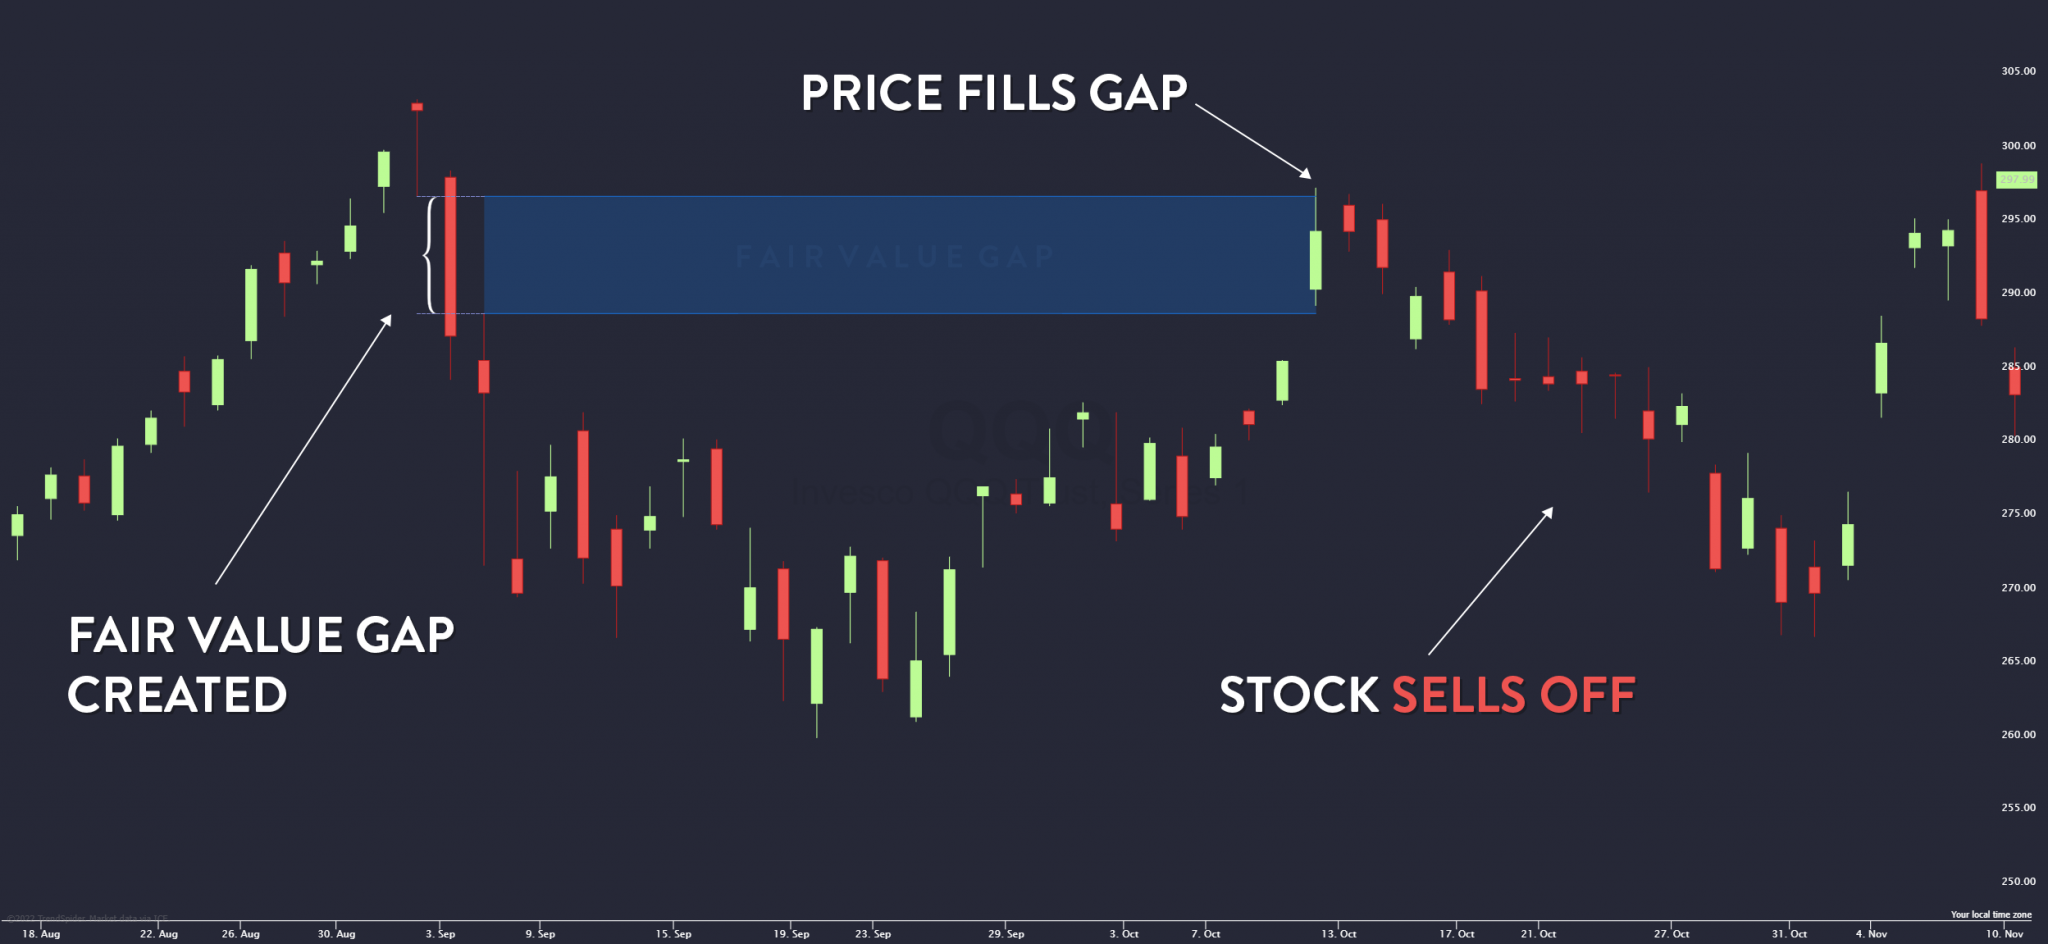
Trading a Fair Value Gap. In the example below, we see a high made that is then followed by a strong sell-off. The first large red candle after the high is where the FVG is created. Price trades down, begins to make a bottom, and then climbs back up to test the previous high. As soon as the FVG is filled, price sells off again. This is price filling to the upside in order to clear out the imbalance made from the FVG. Once the gap is filled, there is no longer an imbalance and price can continue in the direction it was headed previously.
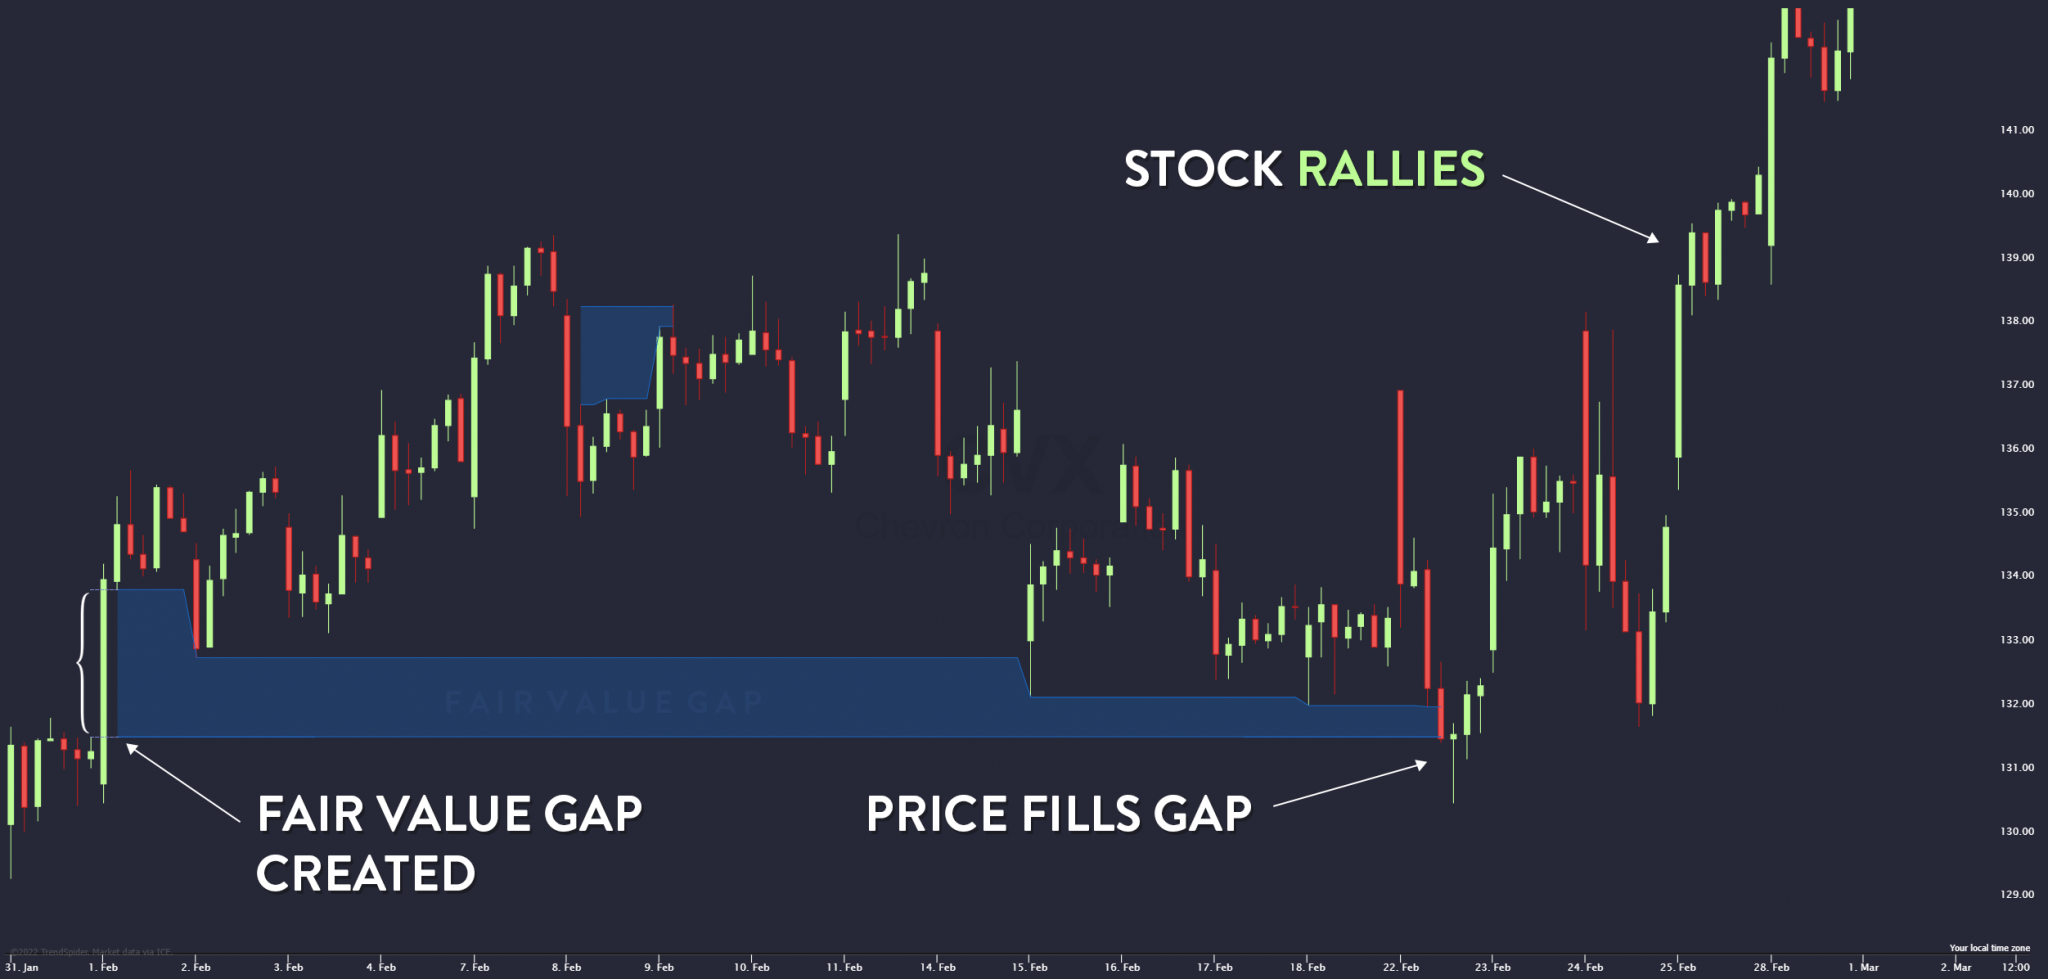
The opposite case — an FVG created by strong buying pressure. Price trades up, begins to top out, and then pulls back into the FVG. This clears out the imbalance, and almost immediately after the gap is filled, price is able to continue quite higher.
For combined FVG and OB examples, see Order Blocks Examples.
A student asked: For this FVG example, is it still valid even when there is this circled wick? Or would it shrink now?
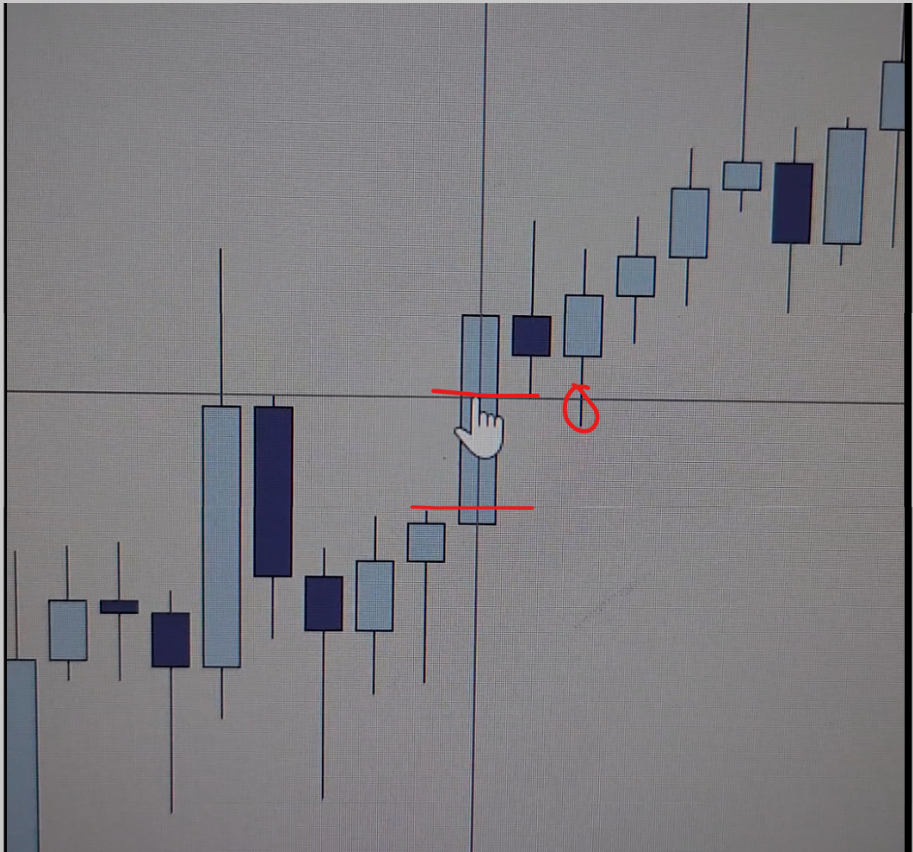
The circled wick is irrelevant. The FVG has already been officially printed. It doesn't matter what the candles do from there on. FVG is defined by the 3 candles — the long middle one and the 2 on either side with short wicks. The student then said, I see, maybe I'm thinking of mitigated order blocks. — Yep. OBs are a level, FVG is a candle pattern.
DFVG — Daily FVG.
GP — Golden Pocket. See 🔷Fibonacci Levels.
For an example from MUBI: "Add fibs to the LTF/MTF swing, and you'll find GP. Look at 2/3H timeframes."
A student asked: The higher the time frame fib retracement from untested fib levels, the more powerful, I imagine? — The higher the TF, the more powerful for everything. And you can mix different TF liquidity with different TF Fibs.
Fibs — Fibonacci Levels. See 🔷Fibonacci Levels.
Multi-billion dollar trading bots run the markets. 80%+ of all trading volume is generated by bots. Whale Manipulation🐋 Retail is just deploying $ and losing it as bots will consistently be 10 steps ahead of them. Bots are programmed with certain fibs, and they begin reversing price at them IF paired with more strong confluence, mostly on HTFs, where all liquidity is at (candlesticks and imbalances). This confluence is not lagging indicators on Trading View. Those indicators were created to keep retail blind to the real craft.
In short: Institutional trading bots are programmed with fibs, so mastering them is a must, but definitely not how retail is using them.
"What indicators do you use the most?"
A student asked about logarithmic-scale fibs:
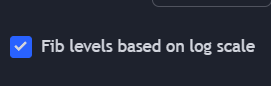
If your chart is in log mode, use log scale. If it's not, then don't.
Timeframes
TF — Timeframe. The higher the TF, the more powerful everything is. See 👑Timeframe Rules.
In general:
- Micro TF — 5min and lower
- LTF (Low Timeframe) — 15min to 2H
- MTF (Medium Timeframe) — 2H to 12H
- HTF (High Timeframe) — 12H to Monthly+
MTF' — Micro Time Frame.
From RUNE: Daily+ TF are where you'll find the highest probability to win your trades. The higher the TF, the more powerful for everything. You need to measure probability depending on how many confirmations at that level through different TFs you can find. The more confirmations, the more powerful.
To even consider that one day you can be close to being an elite trader, you need to scan through 14–18 timeframes (sometimes more) on the coin you want to long/buy or short/sell any financial instrument on investment markets.
A student said: Not if your HTF — D, W, M is all I need for confirmation. Fuck the noise. — You can't refine or ultra-refine on those, thus unable to find huge R:R plays. I'm talking about elite level. 🔷Risk Reward
Have you realized that the traders/investors who claim they only look at 1 or 2 timeframes cannot show any significant and consistent positive results? Must 👁️ ALL timeframes:
- M > 2W > 1W > 5D > 3D > 1D > 12H
- Refining: 8H > 4H > 2H > 1H
- Ultra-refining in order to find 30R+ opportunities: 1H > 30min > 15min
[Feb 9, 2024]
Student: HTF is 12h minimum? — Best to be Daily if Bitcoin and ETH.
Trade Execution: BE, CMP, SL, TP, RR, MO, LO
BE — Break Even. Breaking even means a trade results in neither a profit nor a loss; the exit price equals the entry price. You move your stop-loss to the entry price once the trade is in profit to eliminate risk, ensuring you don't lose money on that trade.
When a trade neither makes a profit nor incurs a loss because the price returns to the entry point after some movement in the desired direction, traders often move their stop-loss to break-even to eliminate the risk of loss while keeping the trade open.
A reality check on what BE actually means in real terms: "Oh, my God! I finally BE on my Bitcoin investment because I bought near ATH @ $62,000 back in 2021!" Erm, no. You did not. Basic math. $62,000 in 2024 has quite less purchasing power vs. $62,000 in late 2021. Cost of living is on a never-ending bull.
CMP — Current Market Price.
SL — Stop Loss. An order to close a trade at a predetermined price to limit potential losses. A crucial risk management tool to protect trading capital. See 🔷Stop Loss.
An SL is a key risk management tool that automatically closes a position once the price hits a predetermined level. (Note: SL also stands for Swing Low — context tells you which.)
How does any so-called "trader" have the audacity to post long "opportunities" with 15–20% stop losses? Even worse, how does anyone actually assume these people are traders? A real trader will execute precise plays with controlled risk. If your SL is 15–20% you're not trading — you're praying.
TP — Take Profit. An order to close a trade at a predetermined profit level. Automatically locks in profits when the price reaches the desired level. See 🔷Taking Profit.
On trailing stops — see Trail Your SL. A student asked: Once you find the area you want to trail from, is there a specific % you like to use? — If I'm trailing, whole position. As it goes, I choose TP levels and trail remaining.
RR — Risk/Reward. The ratio comparing potential profit to potential loss in a trade. A favorable Risk/Reward ratio allows you to take on trades that can yield larger profits than your potential losses. See 🔷Risk Reward.
MO — Market Order. See 🔷Entry of Trades.
MOs — Market Orders.
LO — Limit Order.
Examples: TRB partial LO. When it is such an HTF with further confirmations through TF you can allow more than just the 1st hit to the level and still long/buy.
From 🔷Entry of Trades: Some plays can require live trading and with alerts. If the market is at extreme premium, isn't wise to be on LOs and going to sleep, as most newbies do.
ATH, ATL, BCS
ATH — All Time High. See Selling Tops and Price Discovery.
Student: How do you define the targets for new ATHs and in general? — Whales spoofing levels, sentiment, market structure, HTF [-] fibs, all-time log chart for BTC.
[Jun 25, 2025]
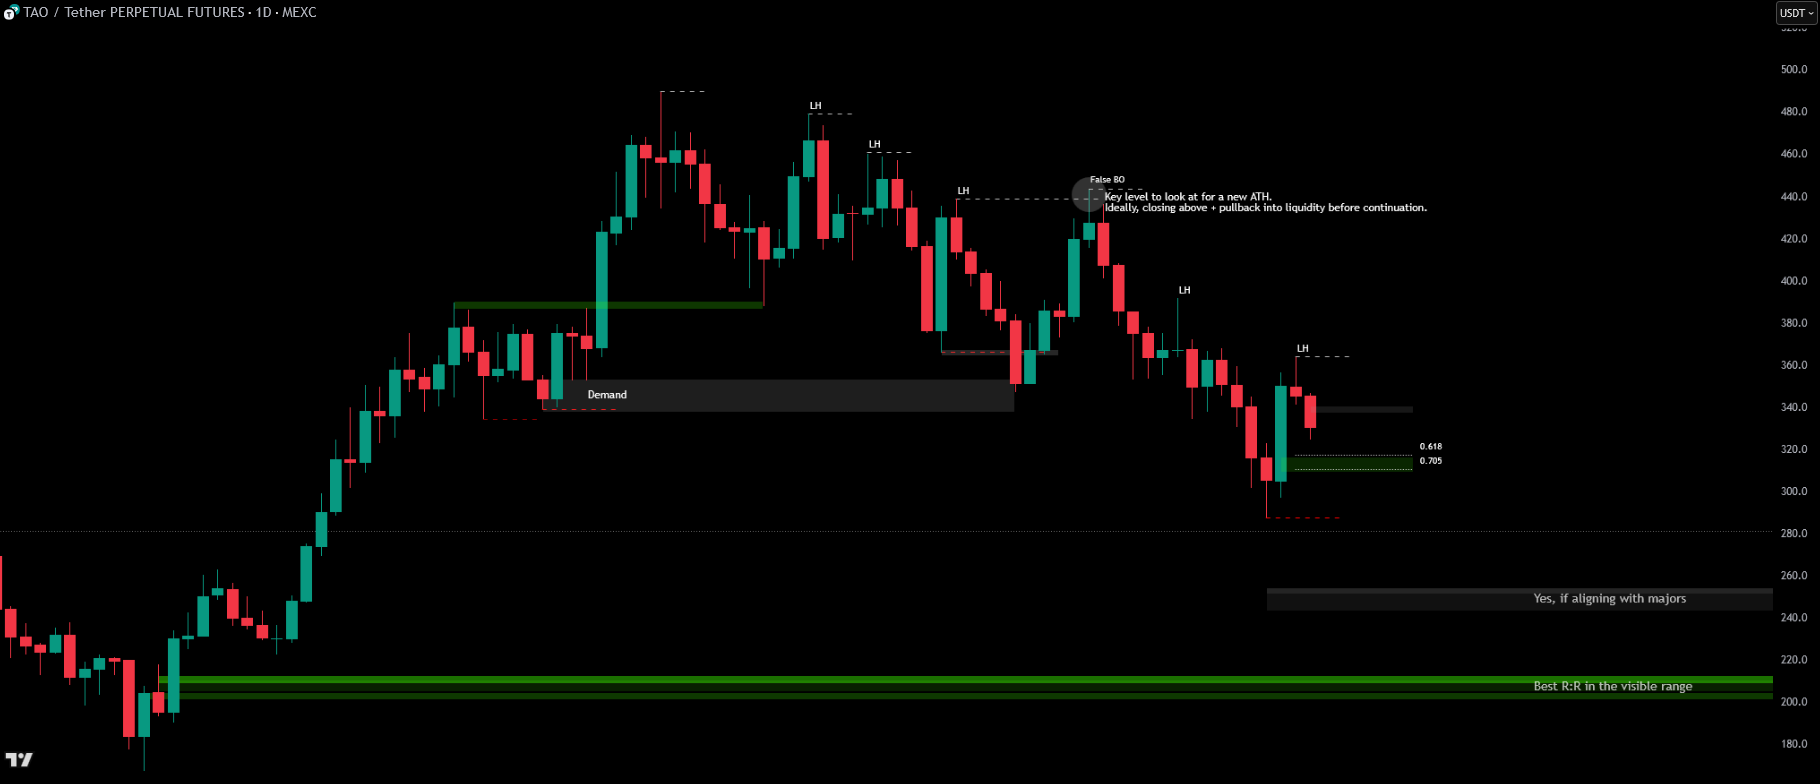
Key level to look at for a new ATH. Ideally, closing above + pullback into liquidity before continuation.
ATL — All Time Low.
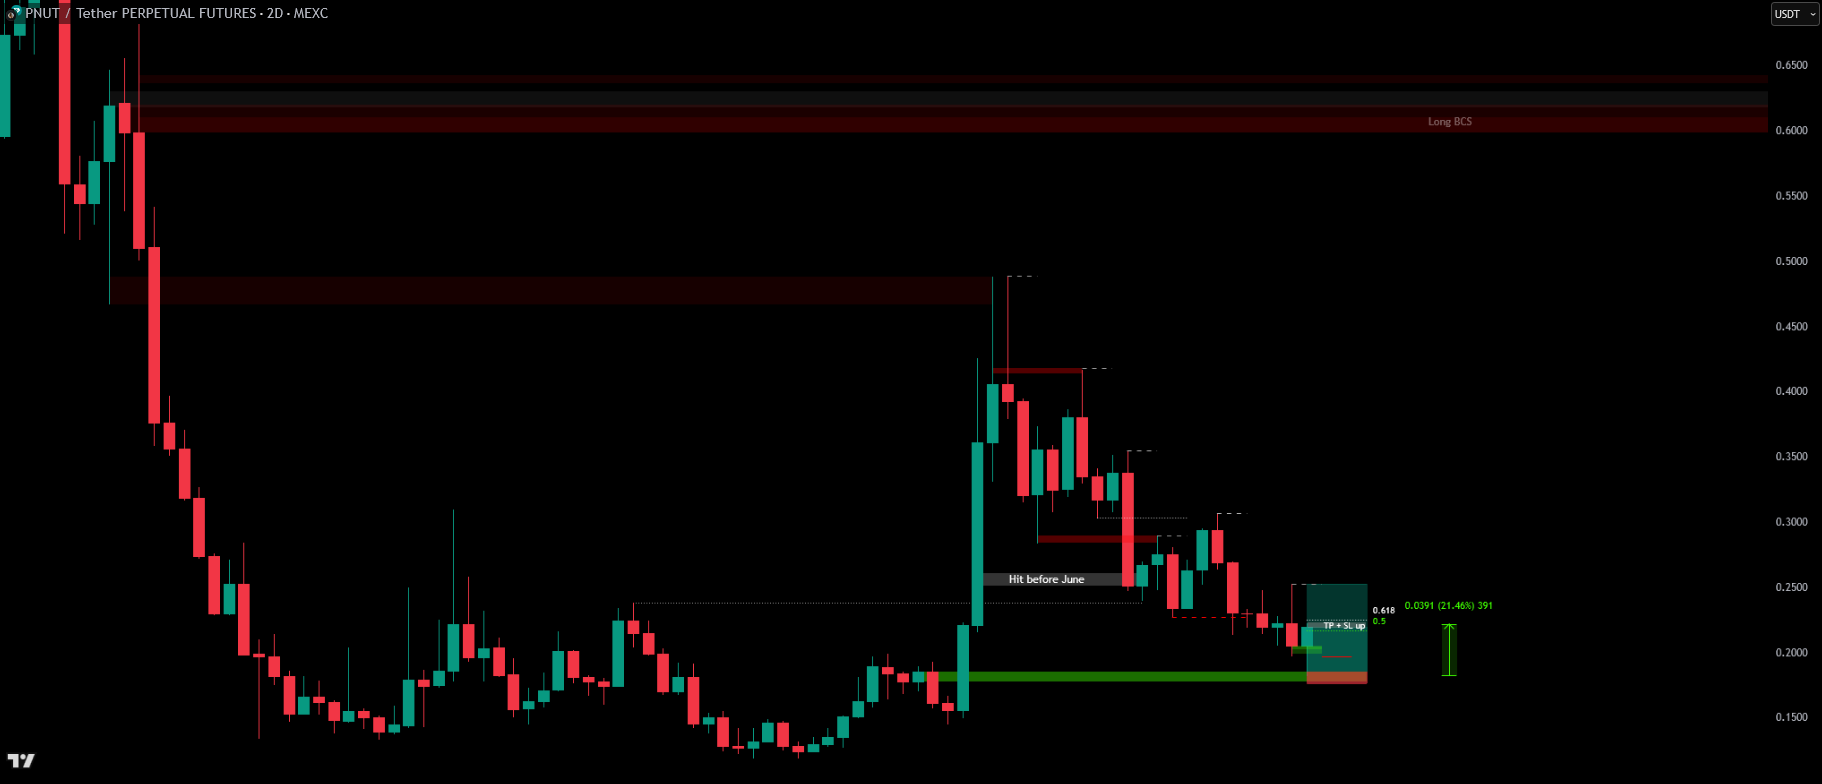
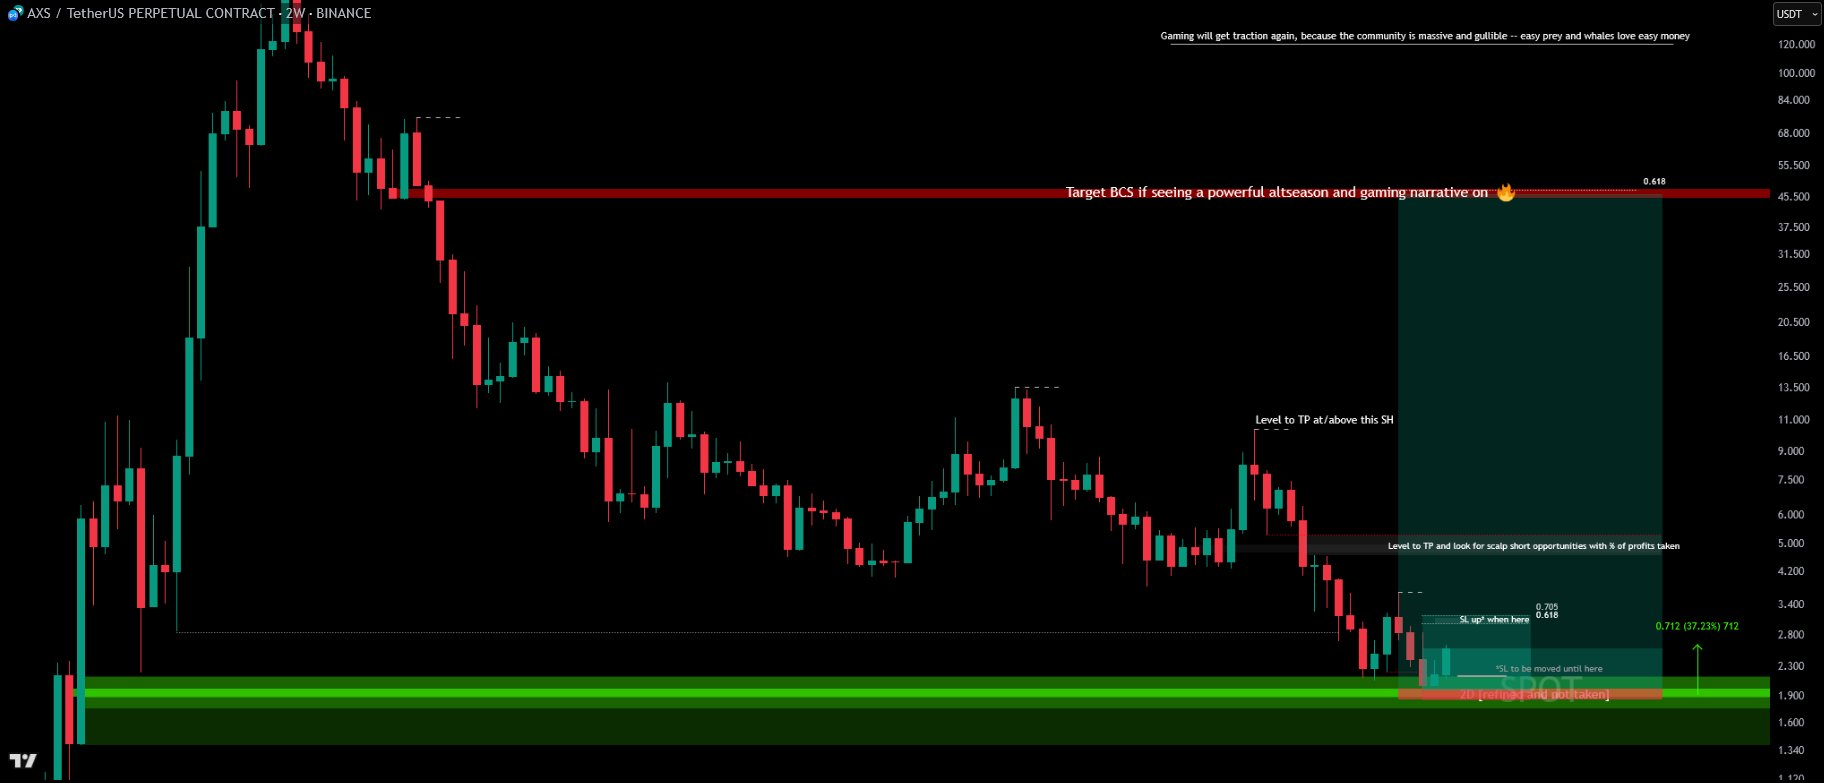
BCS — Best Case Scenario.
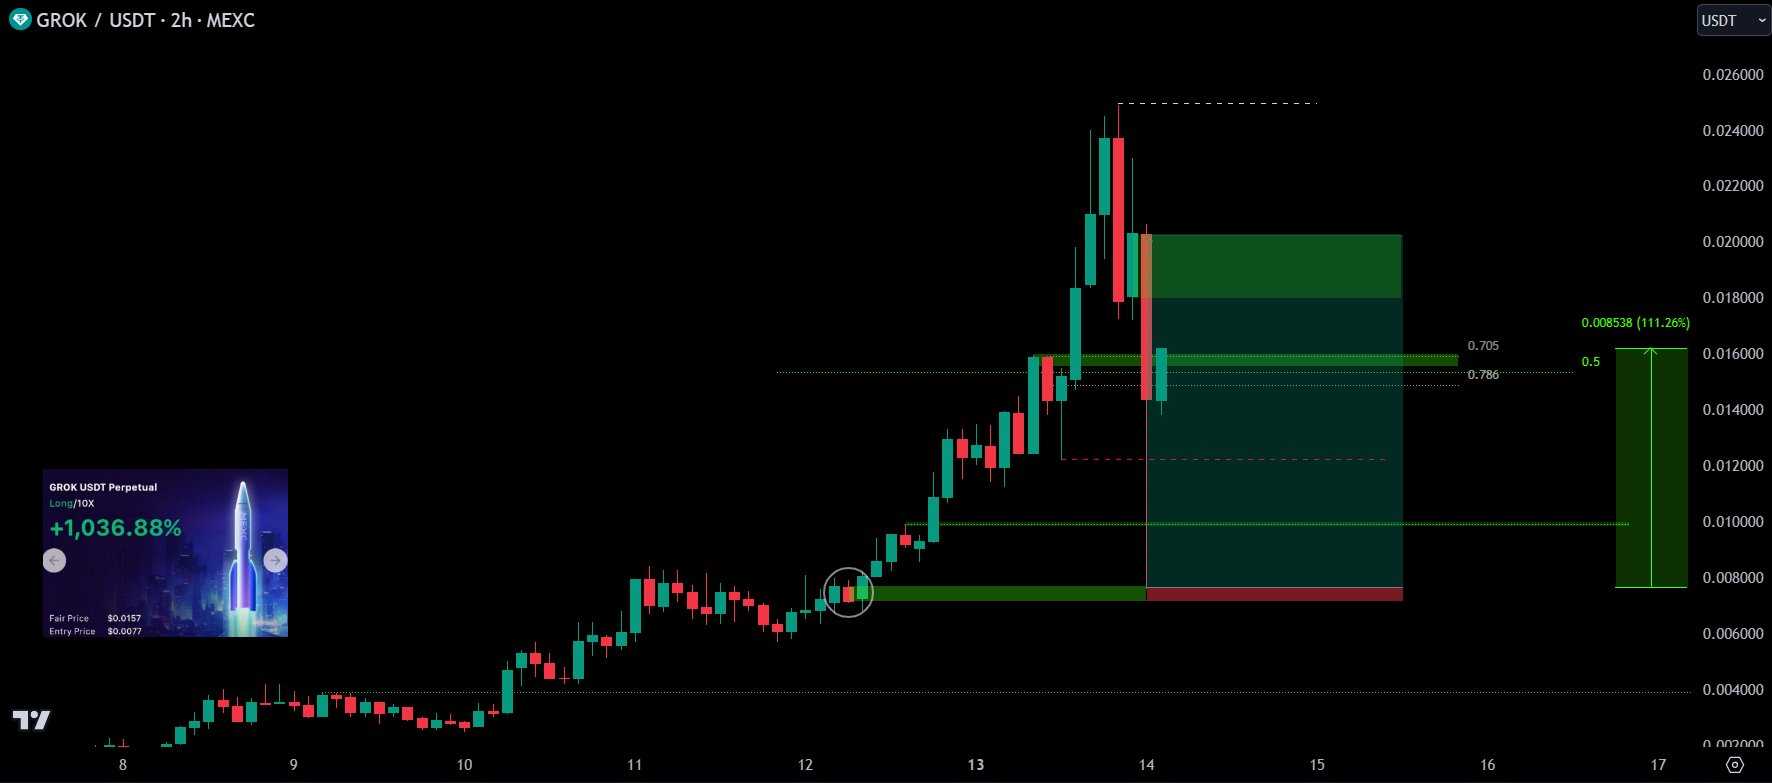
I find my levels and ride the move. If it wants to give the whole move, great. I don't care if it doesn't, as I can extract a lot of $ as I ride it and trail my stop losses. This is why many times you see "BCS" on my charts, which is the best case scenario rather than bringing 100% of the position until that level. More like up to 35% of the position, as TPs will happen along the move, and sometimes I can add size with the already realized profit if I can find a newly printed 🗝️ or ♨️ level inside the range I'm trading on.
From ⭐Starting Analysis: It's not about expecting a 50% move and it's trading common sense that a 50% move is unlikely if everything else isn't BO and the HBAR setup isn't in play, as 🗝 SH wasn't taken. The top of the positions on my charts are always a BCS for the setup idea.
[Jun 23, 2025]
[Jun 23, 2025] In on spot and longs. Tighter SL and 15% TP on longs.
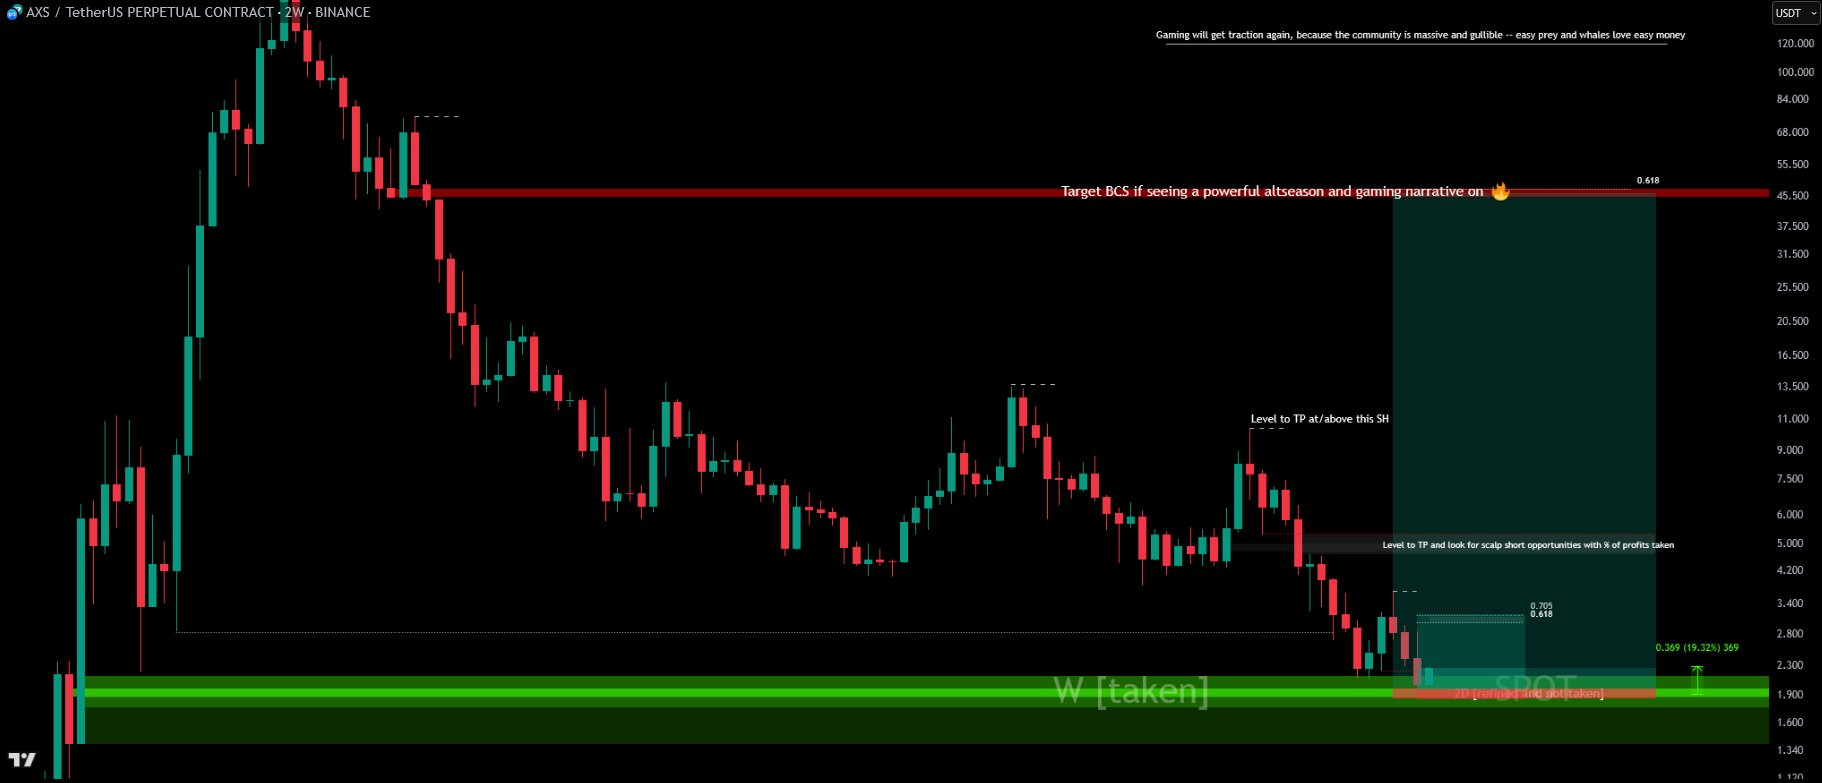
Gaming will get traction again, because the community is massive and gullible — easy prey, and whales love easy money.
[Jul 15, 2025]
Levels: Bullish 🗝️ and Bearish ♨️
Bearish Level♨️ and Bullish Level🗝️ — the most powerful levels will show on 12H+ charts, and the bigger the emoji I add, the higher the probability for reversal. I've shared dozens of charts throughout the year with such levels, on a very high hit rate.
For both, you must monitor Bitcoin and ETH's behavior on MTF and use it as +1 leading confirmation. The levels can be invalidated if there's any HTF change of MS. I usually mention when the MS structure is confirmed — for example, when I say the levels where MS will change if confirming close above/below on HTF — so you can invalidate those ideas yourself.
Green levels / Red levels are LTF and MTF potential reversal levels. If they don't have ♨️/🗝️ they're not as powerful as the levels that do have these emojis. There's NO OPTIMAL trade on anything < HTF. Those are the most powerful and unlikely to fail, thus bigger size, and can be left running overnight if properly managed. See 👑Risk Management.
Fibs are placed on MTF and HTF swing high > low and/or swing low > high, on different TFs (the higher the TF, the more powerful everything is). Swings that haven't been tested are valid for future reversal levels, so I place fibs there as well.
As you've seen on most of my charts, I forecast future moves — thinking moves ahead rather than what happened yesterday or what's happening at the moment. I simulate by placing them from the start of the move to where I believe it can reverse, as if the candlesticks were already there, and this can help plan future trades by finding enough confirmations in advance. Then I just need to add alerts near the levels and I can take "snap" decisions when the levels are hit.
Remember: Find > Wait > Enter > Win. Never chase.
PS: High volatility will always kick in for Bitcoin when BVOL24H is at support.
Quick reference: emoticons on charts
From the terminology section, here are the chart emoticons you'll see — they exist alongside the acronyms and intensify the signal:
- S = Supply
- D = Demand
- 💧 = Liquidity
- 🩸 = Blood expected
- 🦘 = Bounce expected
- 🔑 = Key area
- 👁️ = Area to monitor
- 💀 = Lose level and it's game over
Multiple emoticons on the same level strengthen the area.
Other shorthand you'll see in this course
These don't sit on charts, but they show up in commentary and you should recognize them on sight.
SMC — Smart Money Concepts. See the Beginner Tips folder.
AMT — Auction Market Theory. See Auction Market Theory (Imbalances, Fair Value, Volume Profiles).
DD — Due Diligence.
CT — Crypto Twitter. See Narratives.
"Tether is going to collapse!" — CT. Everything depegged but Tether. Whoever's taking decisions based on what they read from 99% of CT sources is no more than sending all their $ into smart players' wallets. I doubt there is 1 legitimate successful entrepreneur/investor following shit like Bitboy, MMCrypto, Banter, and all that. They don't make $ investing. They make $ by misguiding newbies into losing all their $ + YouTube revenue.
CX — Crypto X (Twitter). Everyone on CX wants to time the market while claiming no one can time the market. Mind-bending.
DM — Dumb Money. Or Direct Message.
MMs — Market Makers. The big players. See 🐋Whale TA Analysis and Whale Manipulation🐋.
HFT — High-Frequency Trading. Some of the most profitable trading strategies are algorithmic or high-frequency trading, which are executed by sophisticated computer programs. These trades are often conducted by firms that operate in private, and their success is not measured by public leaderboards.
NGMI — Not Gonna Make It.
HODL — Hold On for Dear Life. See HODL is a Trap, Spot, Holding Spot.
I HODL too, but I'm out when it's time to be out (before crashes), and in before it moons. If the swings happen fast, then I'm in and out fast. If they take 1+ years to play out, I ride the bag for 1+ years.
The problem for 99% of investors is not holding for higher % gains. Their problem is always wanting more, and their targets are very unrealistic from the moment they buy. This is on top of not being able to identify tops and bottoms, so they're chopped up often and now need a huge bullrun just to break even (many), and they will not get it.
Instead of buying all the way down, holders can nowadays buy at Demand if they believe it can recover. It won't moon if the market's bleeding though.
I HODL too as I increase spot bags at HTF 🗝 demand levels to then sell at HTF 🗝 supply levels. I don't buy & hodl for 5+ years. I go with the HTF swings, selling tops and buying bottoms. No one can predict the future. It's all a dream, and since it's a dream on financial games vs the most ruthless/greedy people in the world, I don't believe it will play out as retail's expecting.
I increase my HODL bags from profits. Not just buying and holding/hoping for whales to do whatever they want, whenever they want. It's not charity here, and if I can make $1m+ in months there's no point to wait years to achieve such, and is uncertain anyway. Life's too short for that, and our prime-time is even shorter. Short, mid, long term bags. Snowball effect.
I can still make at least a 10x per year on the portfolio regardless of market conditions as I'm trading the volatility, and crypto's volatility is a blessing that most investors see as a curse. I HODL too, but I increase the weight of those bags by DCA'ing with some of my trading profits, which are re-invested externally, and other % of those profits goes to scale my eComm businesses.
If your strategy is solo-HODL because it's what's easy to do — buy > wait and pray — you're putting yourself at a level of risk where your odds to ever win in the investing game are very slim. This isn't fantasy-land, nor charity. Everyone's here to make $ ASAP. There are 0 coins where the biggest holders do not dump their bags on good profit. ZERO. Why are you solo-holding bags and assuming you will be rich in 5–10 years? You're making them richer while seeing your portfolio go into deep red. Then you buy more and HODL. They will dump their bags again.
What to do? Among many solutions: learn to trade shorter-term swings, and this doesn't mean you need to go into futures (which, if you know how to read these liquidity games and have a very good risk management strategy, is life-changing). Neither does it mean day-trading, but you should be able to enter/exit positions on profit more often than monthly, as this market doesn't sleep and is very fast-paced. Identify where whales buy or sell aggressively and wait for them to do it again, because they will always do so — they cannot fill all their orders in one go because of how big they are. Then you need to work on understanding the algorithms that move these markets.
If you then want to increase your HODL bags, you do so from your shorter-term profits instead of your salary. You basically buy "midair" when there's actually ♨️Key Levels🗝️ printed on the charts that will provide a much better R:R than the typical "DCA and Hodl." It's harder to learn the craft than to just click a couple of buttons, get the coins for whatever price, and pray for price to go up — but get yourself some serious weapons (skills). Easy never got anyone anywhere. If you play like the herd, you will have the same outcome as the herd, and the herd never wins.
When will holders outperform traders? Next year? In 2030? Traders can choose to hold long-term if they want, but holders typically don't trade — so realistically, there's no scenario where holders outperform traders. Plus, holders can quite literally sell many tops and buy many bottoms just by following my charts. They don't need the precision I look for on futures, as they're on Spot. But they will just do as they were brainwashed to do, which is HODL, DCA, and wait for a bull. Later they will want to go back in time to "fix" their mistakes.
24/7 market with major swings on HTFs. There's nothing like this. Yet, the wisest in my opinion is to extract $ from futures and increase HODL bags for bullish'er momentum in the future. Spot
FYI: If you're down -90% on your bag, you'll need a 900% price increase just to break even. Not profit. Break even. Let that sink in.
[Jul 9, 2025] CRV $0.50
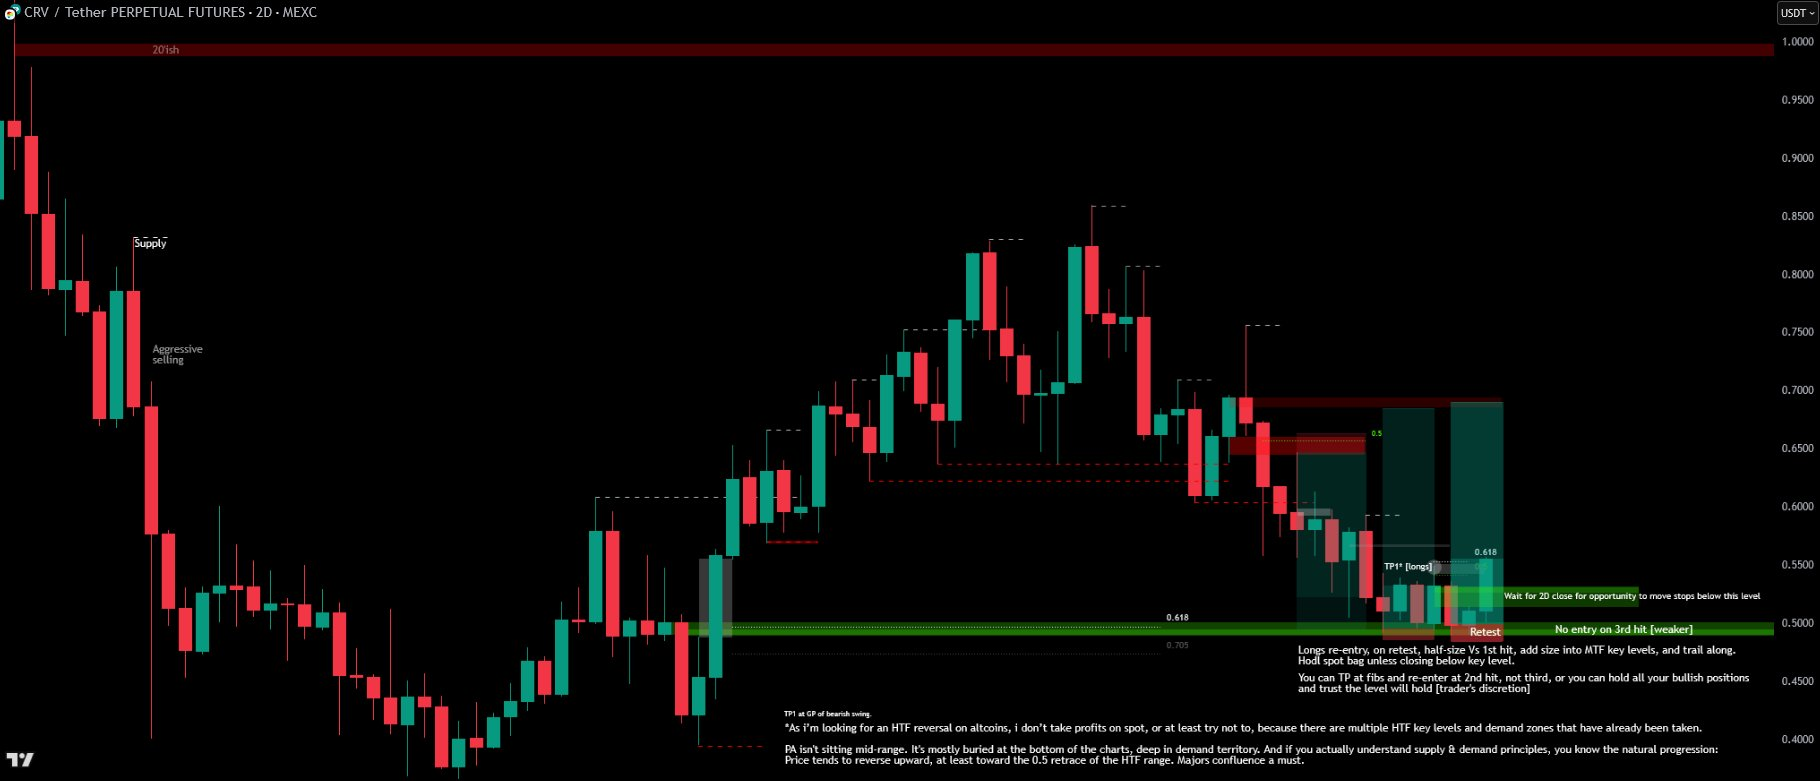
Longs re-entry, on retest, half-size vs 1st hit, add size into MTF key levels, and trail along. Hodl spot bag unless closing below key level. You can TP at fibs and re-enter at 2nd hit, not third, or you can hold all your bullish positions and trust the level will hold [trader's discretion].
As I'm looking for an HTF reversal on altcoins, I don't take profits on spot, or at least try not to, because there are multiple HTF key levels and demand zones that have already been taken. PA isn't sitting mid-range. It's mostly buried at the bottom of the charts, deep in demand territory. And if you actually understand 🎁Supply & Demand principles, you know the natural progression: price tends to reverse upward, at least toward the 0.5 retrace of the HTF range. Majors confluence a must. Basically try to hold spot at least to 0.5 of major range after major demand liquidity (including key levels) taken.
Evidence you can't handle the truth. You'd have to be willfully blind, brand-new to the game, or unaware of your own ignorance to say this after years of education and my clear pre-crash warnings.
That's the dictionary. Refer back as often as you need. The acronyms aren't the craft — they're the alphabet. Once they're automatic, you can focus on what actually matters: reading PA, mapping liquidity, and waiting for the right level.
If everything doesn't make sense now, don't worry. It will.
Be ready to learn how to truly trade, this is a multi-month commitment. This is the path to real freedom.