What to Learn (and What to Ignore)
This lesson is the map. Before you go deep into any single tool or pattern, you need to know which skills actually move the needle — and which ones are noise designed to keep you stuck. The list of what to learn is short. The list of what to throw out is much longer, because most of what's taught publicly is exactly what keeps retail as exit liquidity.
I want you to leave this lesson with two things: a clear picture of the curriculum ahead, and a much smaller chart. Fewer indicators, fewer trendlines, fewer "patterns." Cleaner thinking.
Start on the Higher Timeframes
Play on HTFs. Micro TFs, LTFs, and MTFs are too volatile and "erratic" for newbies to play on. Go gradually and start on HTFs. When you see yourself with a good % success rate, you look for faster plays.
I always recommend focusing mostly on HTF plays as those are the most powerful ones with the highest % success. It's where the shorts will pay the most because the drops will be bigger, and longs will pay the most because the pumps will be bigger. Plus we can always sell on spot at local tops before large corrections, and buy back at local bottoms before another multiple-month bullish swing.
I personally play all TFs and styles, risking more or less depending on how optimal what I find is.
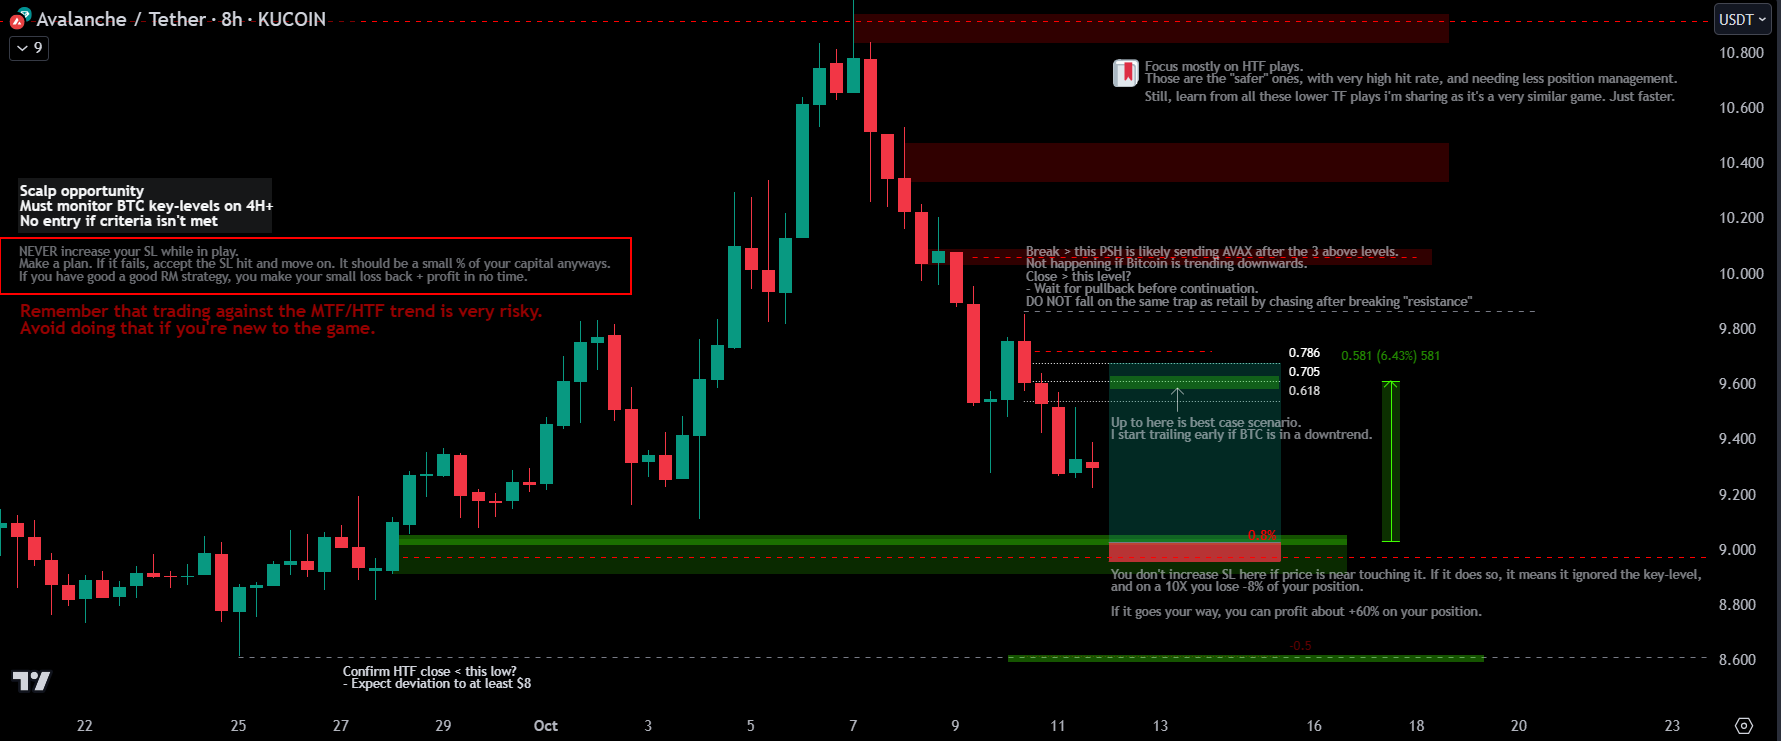
Remember that trading against the MTF/HTF trend is very risky. Avoid doing that if you're new to the game. Focus mostly on HTF plays. Those are the "safer" ones, with very high hit rate, and need less position management. Still, learn from all the lower TF plays — it's a very similar game, just faster.
And while we're on the topic of habits: ⚠️ Never Chase. That rule sits above everything else in this curriculum.
The Curriculum (What You Actually Learn)
Here's the short list. Master these and you have a real chance in this game.
Learn these: 💎
- Liquidity — 🌊Liquidity (+Wicks) / 🎁Hidden Liquidity Levels
- Fibs — 🔷Fibonacci Levels
- Market Structure / Ranges
- ♨️Key Levels🗝️
- FVG's / OB's — 🔷Fair Value Gaps / Order Blocks
- Distribution / Accumulation — Wyckoff Method
- Premium / Discount — 🔷Premium & Discount
Build a strong 👑Risk Management strategy and learn to control your emotions.
Why these specifically? Because algorithms use them.
Algos🐋 account for at least 75% of all trading in the market. So you study what they study: Fibs, Wyckoff Method, 🎁Supply & Demand, FVGs (imbalances), finding the Ranges, and ♨️Key Levels🗝️ with high confluence. That's the toolkit. Read 🐋Whale TA Analysis alongside it, because spotting whale footprints is what separates playing alongside them from being food for them.
The major reversal-finding skill
Trade less ▶️ Earn more. Learn to find major key-reversal levels by:
- Reading where whales buy/sell — 🐋Whale TA Analysis
- Mastering fibs as Algos🐋 use them
- Understanding 🌊Liquidity (+Wicks) and that it acts as "fuel" on the markets
- Mastering ranges and avoiding trading mid-range (if you want higher % probability)
- Understanding 🔷Fair Value Gaps (the proper way)
- Identifying breaks of market structure BOMS, especially on HTF's — 🔷Break of Structure
- Identifying 🔷H&S and 3 Drives patterns
Success in Trading is hard work and Mindset. You really must think outside the box, because the real understanding of this game will show you what our world actually is, and it's not pretty — but we must accept, adapt, and not fall on the traps the elite place in every corner.
The "most important criteria" in one paragraph
Look for fresh liquidity areas rather than already tested ones. 🎁Hidden Liquidity Levels You barely need one trendline on your charts, and definitely no need of any lagging indicator — which is useful for nothing more than understanding what retail is thinking.
Focus on 🎁Supply & Demand levels, Imbalances (FVGs), 🔷Fibonacci Levels (Fibs), 🔷H&S and 3 Drives (and inverted), identifying ranges and where price's at: Discount? Extreme Discount? Premium? Extreme Premium? Equilibrium (0.5 fib)? — see 🔷Premium & Discount.
Search for strong confluence. All on HTFs. That's where whales play and where the bigger and safer $ is at.
The three-things answer
Someone once asked me: "What would be the 3 main things of technical analysis that you would recommend to a person to understand the real market?"
- 🏅 Hidden liquidity (through different TFs)
- Untouched liquidity (HTF/MTF bodies)
- HTF Market structure
That's it. If you internalized those three and nothing else, you'd already be ahead of most "experts."
What Profitable Players Actually Do
It doesn't matter if you're a trader, investor, or a mix of both. If you want to be profitable, you must:
-
Accurately identify the most powerful reversal levels. No FA on the planet will keep coins holding levels or mooning if real TA is confirming optimal bearish reversal levels. Whoever tells you otherwise simply doesn't know how to make money in this game. Herd narratives don't override liquidity mechanics. See 🌊Liquidity (+Wicks).
-
Understand when multiple ♨️Key Levels🗝️ have the potential to hit simultaneously. This is where high-probability reversals happen. When one level hits, it can create a reaction. When several optimal key levels align, it can trigger a major shift — see Optimal Plays. Liquidity, momentum, and positioning all converge at these moments. Miss them, and you're just chasing after what's already gone.
-
Assess the probability of a reversal based on the dots you're connecting. It's not about guessing — it's about reading the clues the market leaves behind. How many key levels align? What liquidity has been taken? Are whales positioned for a move? The more confirmations you stack, the higher the probability of catching the reversal. Those who connect the dots win, and those who don't become liquidity.
-
Ignore ALL herd-like metrics, lagging indicators, and especially their consensus. Because when it truly matters, they will be wrong every single time. Don't Be the Herd🐑
Why Supply & Demand Beats Support / Resistance
This advice is valid for both Spot traders (or holders) and day-traders.
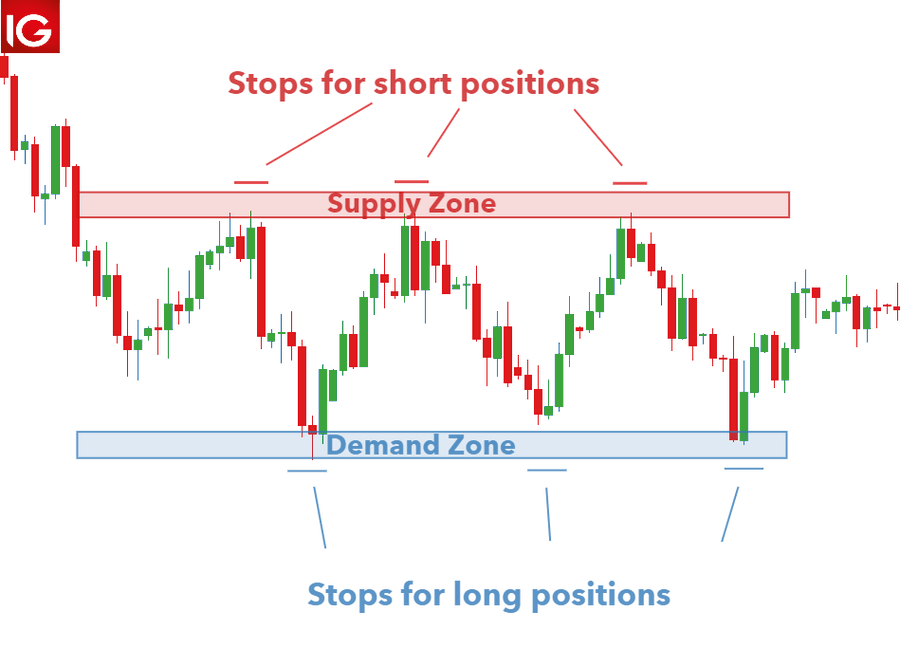
One reason to master 💎Supply & Demand Trading style is that, unlike S/R levels — which typically require at least two tests to be confirmed — S/D zones offer a more proactive approach to trading. With S/D zones, you only need a zone to be established in order to plan a potential trade, making it a leading concept in trading strategies, while typical indicators are lagging and your % of success drops 🔻 dramatically.
Your trading game will go to a whole other level by simply changing from S/R to S/D trading. And this is one of many reasons to do so. In short, what you learn all over CT and YouTube is the most basic trading style — easy to understand and apply, thus most desired by newbies dreaming of living from trading. But that's not it. That's just the very beginning.
This is the hardest easiest game on the planet, where you want to play alongside the smartest and richest people there is. It's not supposed to be easy or simple.
Sir, do you mean Supply & Demand trading style as range trading? Like this on chart or some other methodology?
Good question. That will be answered in the dedicated supply and demand lesson.
XRP Example: The Pattern Repeats Across Coins
XRP Pumping — it won't change. It's happened in all TFs, and at specific times on LTFs for countless weeks in a row during certain periods of each year.
See XRP pumping significantly in the future? 👉 🚨
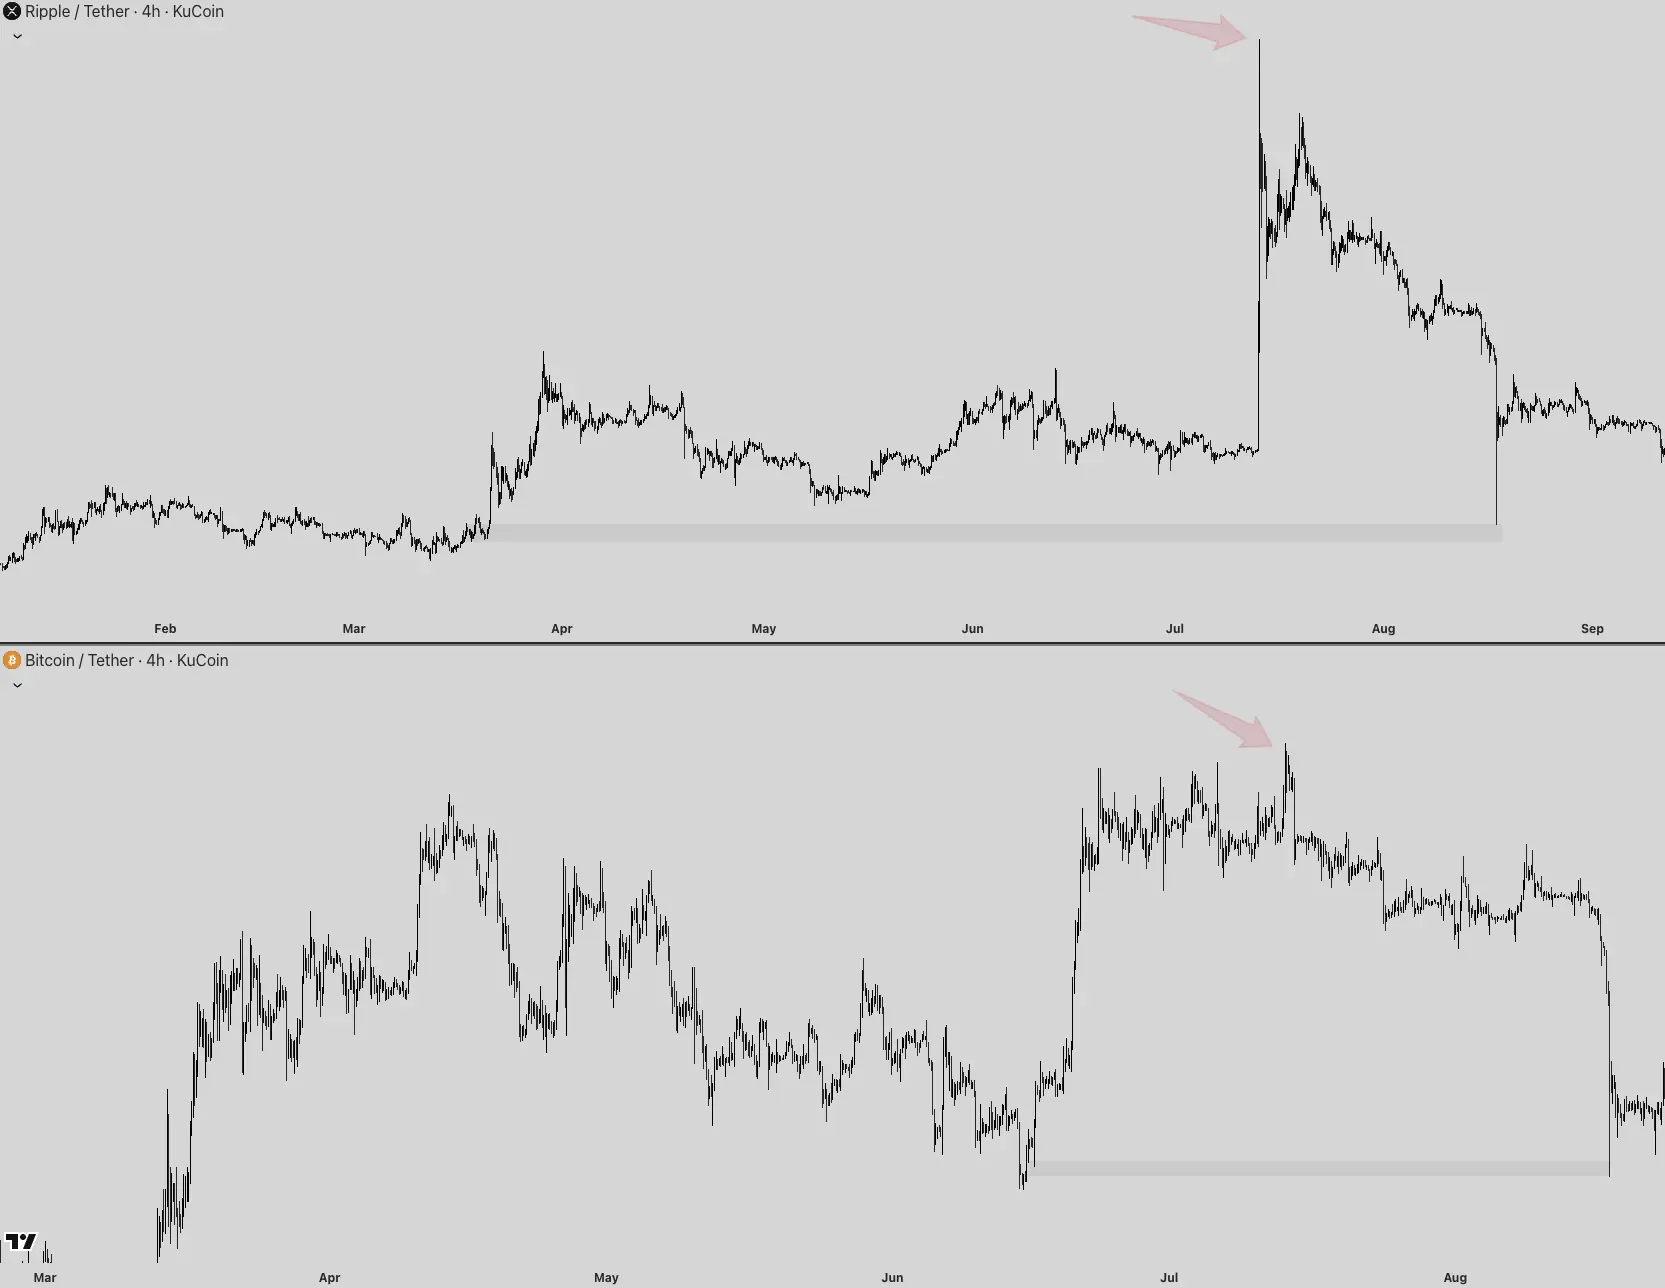
See where price reversed on both coins? That's how you catch profitable trades when looking at HTF charts where whales play 🥂
What you're reading on those charts:
- Supply / Demand — 🎁Supply & Demand
- Imbalance
- Market structure
- Fibs
- H&S (and inverted)
- Three Drives (and inverted) — 🔷H&S and 3 Drives
- Identifying ranges and where price's at: Discount? Extreme Discount? Premium? Extreme Premium? Equilibrium? — 🔷Premium & Discount
Search for strong confluence. Look for fresh areas rather than already tested ones. You barely need one TL on your charts. You don't need ANY INDICATOR.
Master PA if you want to become a successful trader/investor and change your life. Proper TA will allow investors (not traders) to buy at HTF ♨️Key Levels🗝️ rather than DCA'ing at random levels during a short or long-term bearish momentum, thus buying many more coins, which means much more profit in the future if the choice is right. With proper TA, you can identify and sell at or close to the highs.
TA is a tool for all. When mastered, it dramatically boosts the probability of success. Zero understanding on it is playing this game blind.
Part Two: What to Ignore
Now the longer list — the things you can drop from your chart and your reading list today. Most of these are not just useless; they're actively harmful because they make the game feel methodical and easy. They make you lazy. They keep you watching lagging data and arriving late.
Indicators Are Lagging. Period.
Indicator families to demote: MACD, MA, RSI, Fear & Greed Index, Retail TA Patterns (yes, those are retail), Volume. There's also The Ross Ulbricht indicator 🪄
If you do glance at indicators, use this thought process: "Ok, this indicator is showing X, which means retail is thinking/feeling Y, because they rely heavily on indicators and consensus."
Then flip to the whale/MM side (Whale Manipulation🐋):
- "How can I deceive as many retail investors as possible with the next moves?"
- "What can I print on the charts to make them feel bullish and then reverse price when they least expect it?"
- "What's the best move to stop/liquidate/bring loss to as many traders/investors as possible and profit to myself?"
- "How can I manipulate their sentiment, so I can profit again?"
MMs move the markets, not retail. Unless it's a small-cap rug-pull coin and an influencer is able to pump/dump it — but that's something else and a game you don't want to play. Play against the herd sentiment and try to come up with the potential outcomes that benefit whales rather than retail. The game will always play mostly to the whales' side.
If you stop thinking like a retail investor and understand MMs psychology, you can come up with the best decisions. That's basically what I do, paired with the understanding of liquidity games. This is a psychological game. Master the psychology of money / investing, and you're sorted for life.
The last question to keep in your head: "Where is most liquidity at? > CMP? Or < CMP?" Master that one skill — Liquidity — and you're sorted for life, on any market, at any time. See 🌊Liquidity (+Wicks).
The "I make money with indicators" rebuttal
Many "traders" will claim: "But I can make money with indicators!" Ok, show us your successful plays in 2022 (bear market) rather than during up-only momentum. You don't need any indicator for that. Buy any shitcoin and it will go up. Wow. Then share your setups early, and the outcome when in play. Can't find any indicator-based trader/investor doing so. Why? They're lagging tools and you arrive late.
It's not about making money from whatever — anyone can "make money" in some plays. It's about consistency / success rate. You will not have "high" on these, period.
You can try to sell fake wine to a newbie, but not to a Sommelier 🤝
Is OBV leading?
I thought OBV is a leading indicator? Also, the most important thing I realized that the trades I have taken following the influencers are 100% losing trades for me. Always — but still it sometimes looks too good and logical to not follow.
Oof, sure — for HTF it's alright. I'm talking about most indicators, especially the overrated ones like MAs, RSI, MacD"onald's", BBs, "MokuMoku" cloud, etc. These are the most basic and useless ones, and what's shown the most to newbies, because they make making $ consistently seem easy. This is what many YouTubers and influencers recommend and even sell despite being free.
What I actually look at
What indicators do you use?
I use PA. I look at Volume, VRVP, some MA's — mostly to understand what retail's thinking depending on their positioning.
Price Action is the only true "indicator"
When you grow as a trader, the best "indicator" is Price Action (PA). It's the only thing you can use to forecast what's next. The indicators 99% of retail investors/influencers use are lagging and close to useless (especially on lower timeframes). All the data you see on indicators is derived from PA.
Master PA and you don't really need any indicators:
- Learn to spot untapped liquidity areas — 🎁Hidden Liquidity Levels
- Learn to understand momentum and trading ranges
- Learn to spot if price is at extreme premium or extreme discount of the range it's trading at — 🔷Premium & Discount
- Learn to spot 🔷Fair Value Gaps (FVG's)
- Learn to spot Supply and Demand areas, so you trade alongside the banks instead of following the herd — 🎁Supply & Demand
Most indicators are OK as secondary information, but if you enter a long/buy or short/sell based on indicators and MA's, you will never have a high % of success. If using indicators at all, make sure that's on HTF's, where there's less "noise."
I know what all CT looks at. What huge influencers look at — which is what their followers look at. The truth is, they don't know themselves. Many never even traded in their life. Noobs arrive into this Twitter niche and qualify the sources by:
- Number of followers
- Verified
- Has a YouTube channel
- How many indicators and S/R lines are on these "gurus" charts
That's not it.
Used alone, indicators cannot be relied on
Most new traders begin their trading journey with indicators, as it's often considered the first stage in trading. For these traders, price action may not seem important — they rely solely on lagging indicators due to the influence of the communities they follow.
In doing so, they become lazy and hope to find some magical combination of indicators that will bring them riches. They make trading decisions solely based on a few dots and lines. That's amateur and provides no consistent profitable results, to anyone, at all. Whoever claims to be a consistently profitable trader off of indicators is lying to you.
This is not to say that all indicators are bad, or that traders who use them are wrong to do so. In fact, many successful traders use indicators — myself included use some — but truly mostly to see what retail is thinking/feeling depending on what indicator is showing at a certain moment, rather than entering/exiting a trade because something is flashing green or red.
It's crucial to recognize that price action is king. Before applying any indicators to the chart, you need to master the skill of reading PA and market makers/whales "footprints" (🐋Whale TA Analysis). That benefits you in the long run, even if you ultimately decide to use an indicators-based strategy.
Volume?
Volume doesn't forecast the next swings (where reversals will happen). I haven't used it for any HTF forecasts I've shared, yet I was accurate on each one — against consensus every single time. So, for me, it's not needed. Whales' footprints aren't written on Volume. In fact, anything basic that's used by retail and available for free is not it.
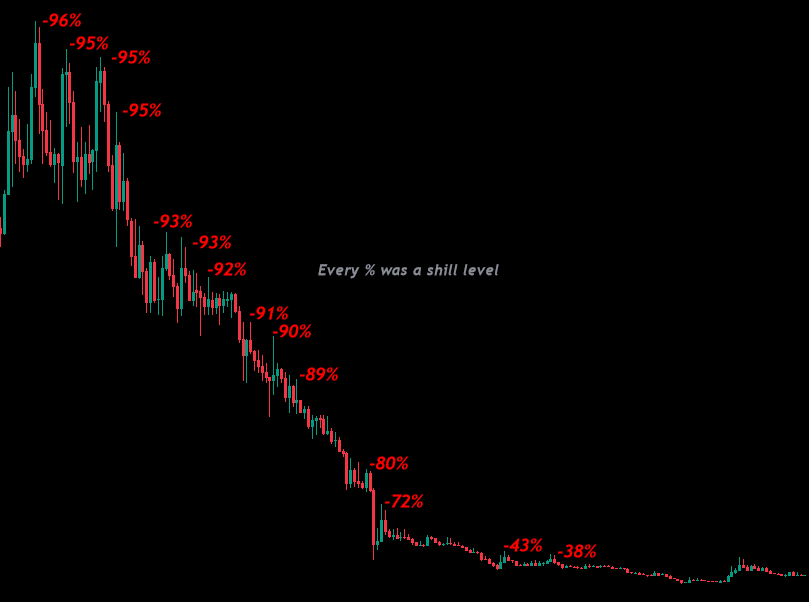
Charts: what indicator-chasing looks like
Yet, all these Bitcoin experts, 24/7 trying to forecast future moves with lagging indicators. NGMI.
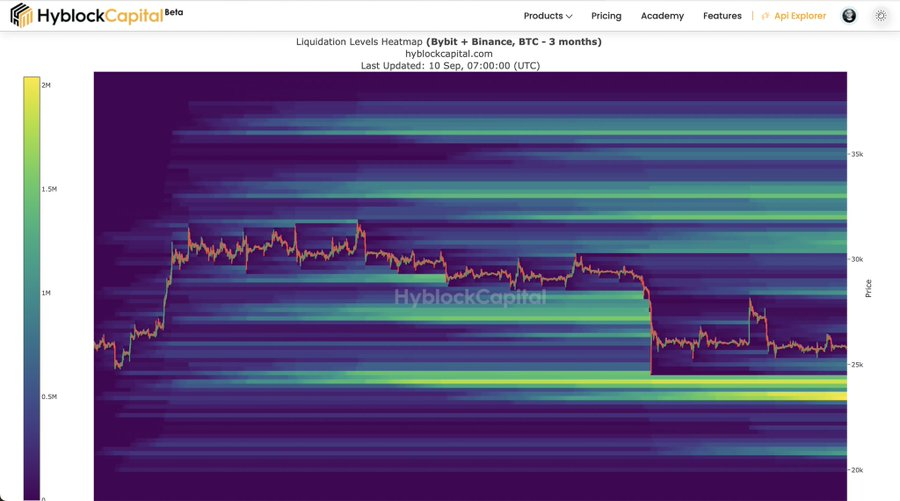
Beauty. I wish I could already afford Hyblock pro. I'm being sarcastic btw. — Learn to read PA properly and you don't need a heat-map. You cannot refine the levels with it either. Good tool for newbie investors/traders, though.
Funding rate manipulation
How many of you look at funding rate? It is highly manipulated in crypto. This is illegal in regulated markets:
- Find a shitcoin with small MC so it's easy to manipulate.
- Buy a BIG bag on Spot and begin exploiting the Funding rate.
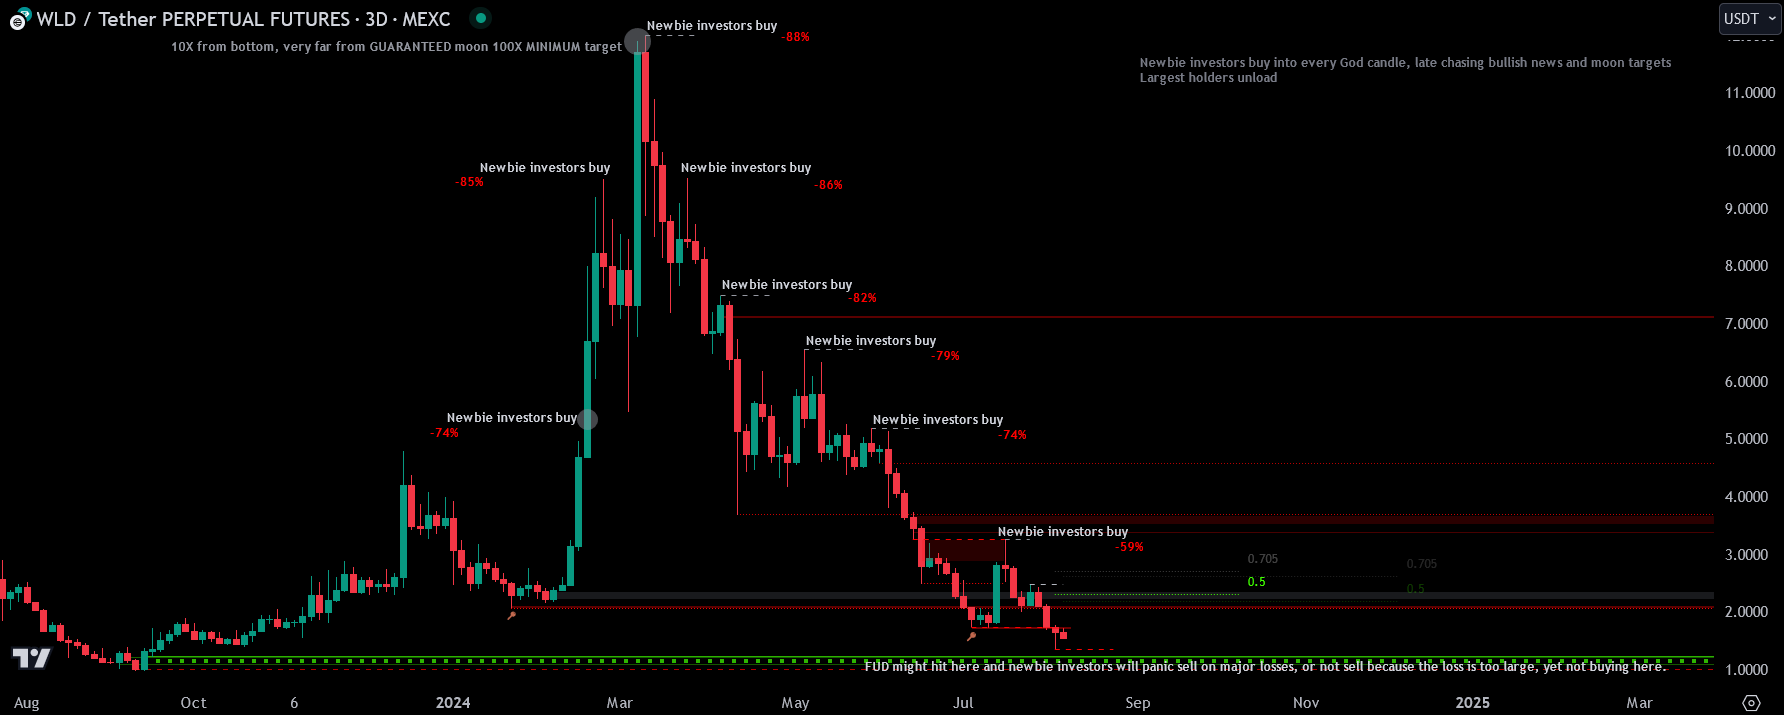
- Newbies will believe they will profit from a short squeeze and chase the move (bait).
- Biggest holders happy with the profit begin selling aggressively, and they further amplify their profits by placing short positions, anticipating the price to fall.
They aim to profit twice — from Spot price appreciation, then from shorting. Criminal behavior, but it's crypto. Gary Gensler will have more shit to talk about. For some "sharks" to steal a few million from retail, they deteriorate the image of something that should be the greatest thing of all time.
RSI: There's No Such Thing as Overbought / Oversold
In trading, 𝐭𝐡𝐞𝐫𝐞'𝐬 𝐧𝐨 𝐬𝐮𝐜𝐡 𝐭𝐡𝐢𝐧𝐠 𝐚𝐬 𝐎𝐯𝐞𝐫𝐛𝐨𝐮𝐠𝐡𝐭 / 𝐎𝐯𝐞𝐫𝐬𝐨𝐥𝐝. When you arrive, you're introduced to trading indicators by people that have no clue how to be profitable on the markets. They show you the RSI, Stochastic, and you learn about the concept of overbought/oversold. They do this because the game must seem easy to play and make money from, otherwise most people wouldn't jump in. It's a trap.
They tell you it's time to sell or expect a drop in price when the RSI reaches 70+ level, and that it's time to buy when the RSI breaks below 30. Using this method will gradually erode the balance on your account — a trap most newbies fall for, missing out on opportunity to buy lower and sell higher, and then they begin revenge trading into oblivion.
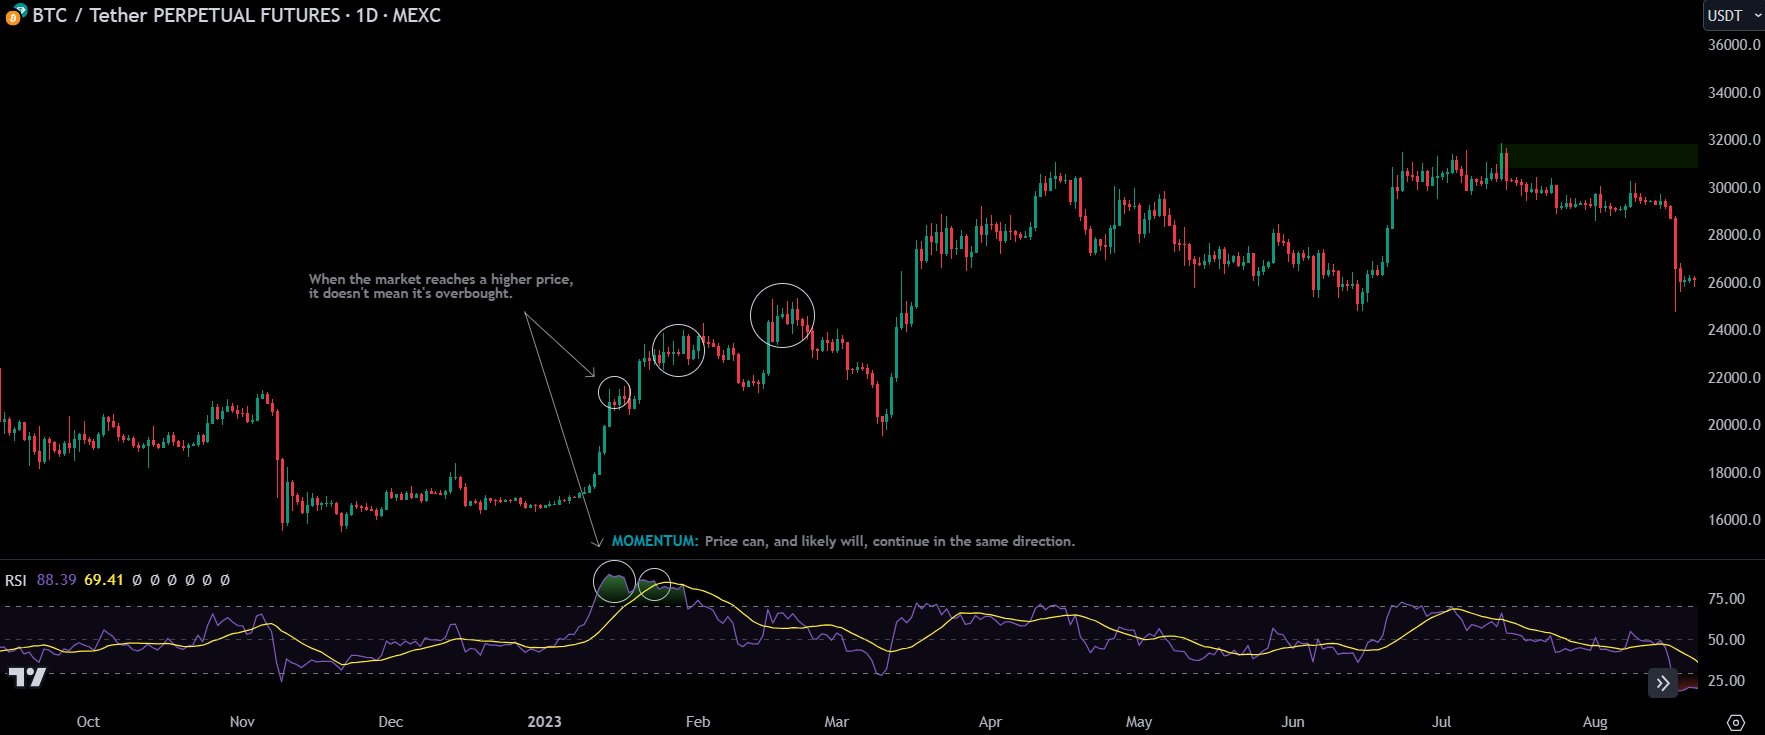
When prices have been rising for a good while, a lot of technical indicators will start telling you the market is "overbought," but these indicators move up and down all the time, even when prices are still climbing. They were designed to work that way. Whoever's showing TA mostly based on these indicators simply does not know how to read the markets accurately. They're reading data when it's already there, rather than forecasting, and this doesn't make money.
The reality: these indicators work best in a sideways market rather than when prices are trending up or down strongly. If you look at your platform during a big rally, you'll see a lot of markets flagged as "overbought." You were told you shouldn't buy/long, that you should be prepared to sell/short. This isn't a good strategy, because your job is to ride the trend.
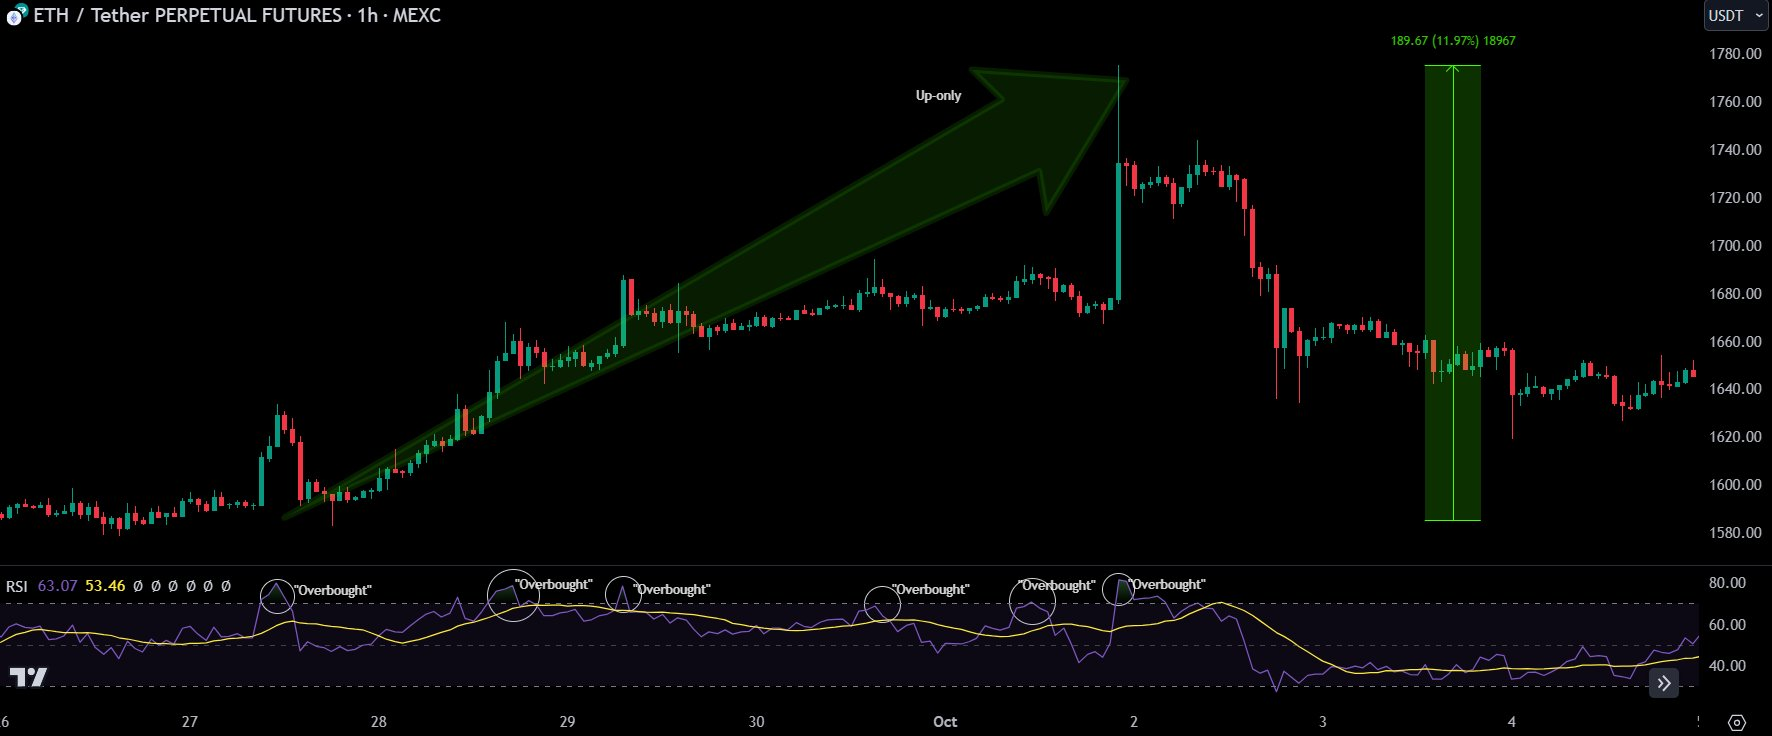
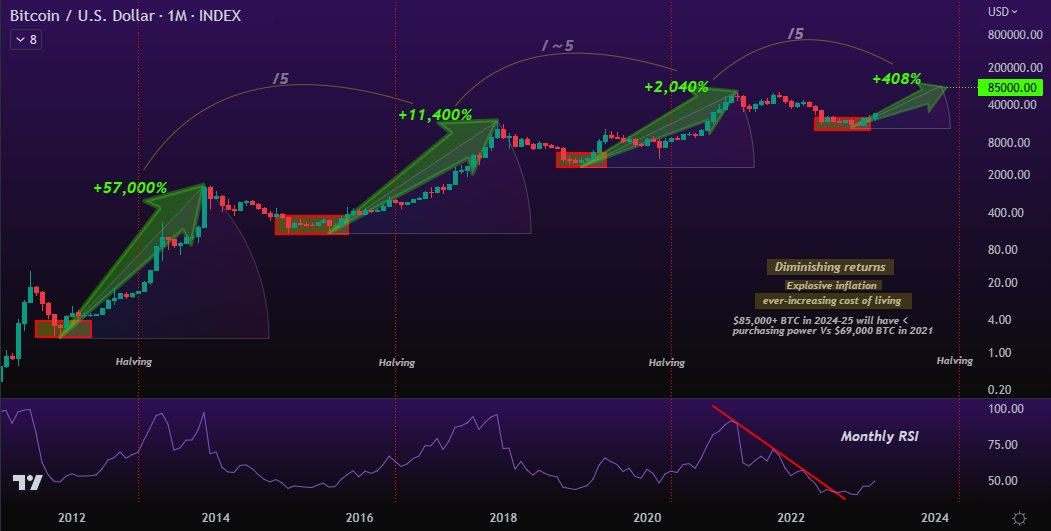
🚨 When the Relative Strength Index (RSI) says "overbought" it's actually telling you that the market is in a strong trend 🚨
So instead of just looking at "overbought" or "oversold" levels, pay attention to increasing momentum. This strategy is all about catching the strength of a price move. If a price movement has enough steam, it's likely to keep going in the same direction.
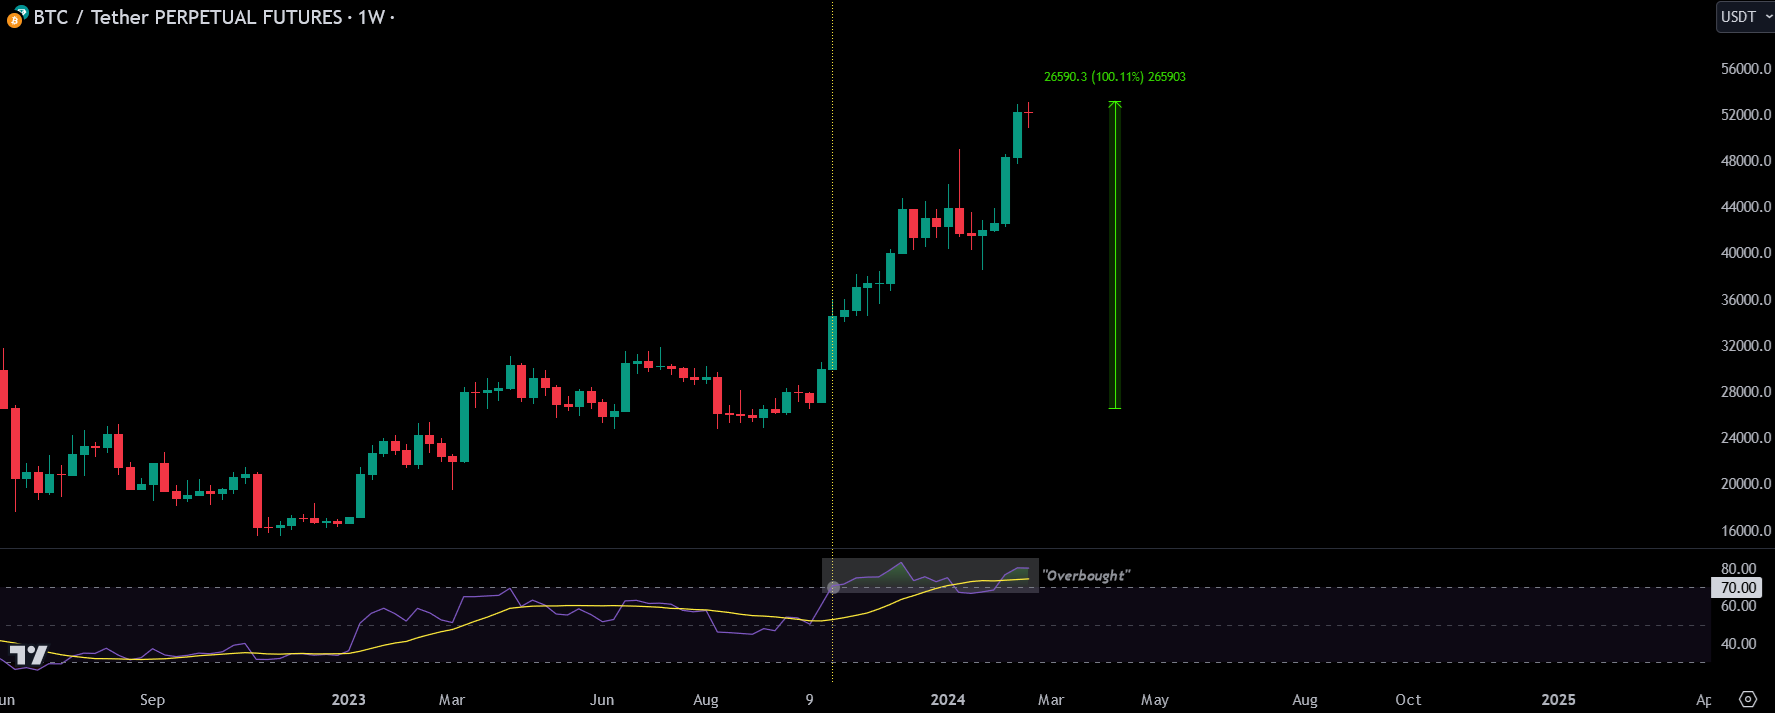
This doesn't mean Bitcoin is going to ATH (for the brainless non-followers that might bump into this post). Just sharing my opinion on this indicator — which I don't use, but most do, and they're consistently wrong.
A market can be oversold/overbought for months without correction.
Tell that to the "experts."
+100% for Bitcoin since "overbought!" RIP RSI'oooooooooors.
RSI in context
Similar for McDonald's (MACD) crossovers. They're lagging, and you will never become a high-success-rate trader with them. It's what retail newbies use FFS. ⚠️ Don't follow the herd ⚠️
CT will go bullish over Monthly RSI. Time to pay attention to sentiment and ♨️ level for Bitcoin, regardless of how many influencers are screaming "wen lambo?!". Most of them don't make any $ investing — they make it from online clout, or straight up rug-pulling their following.
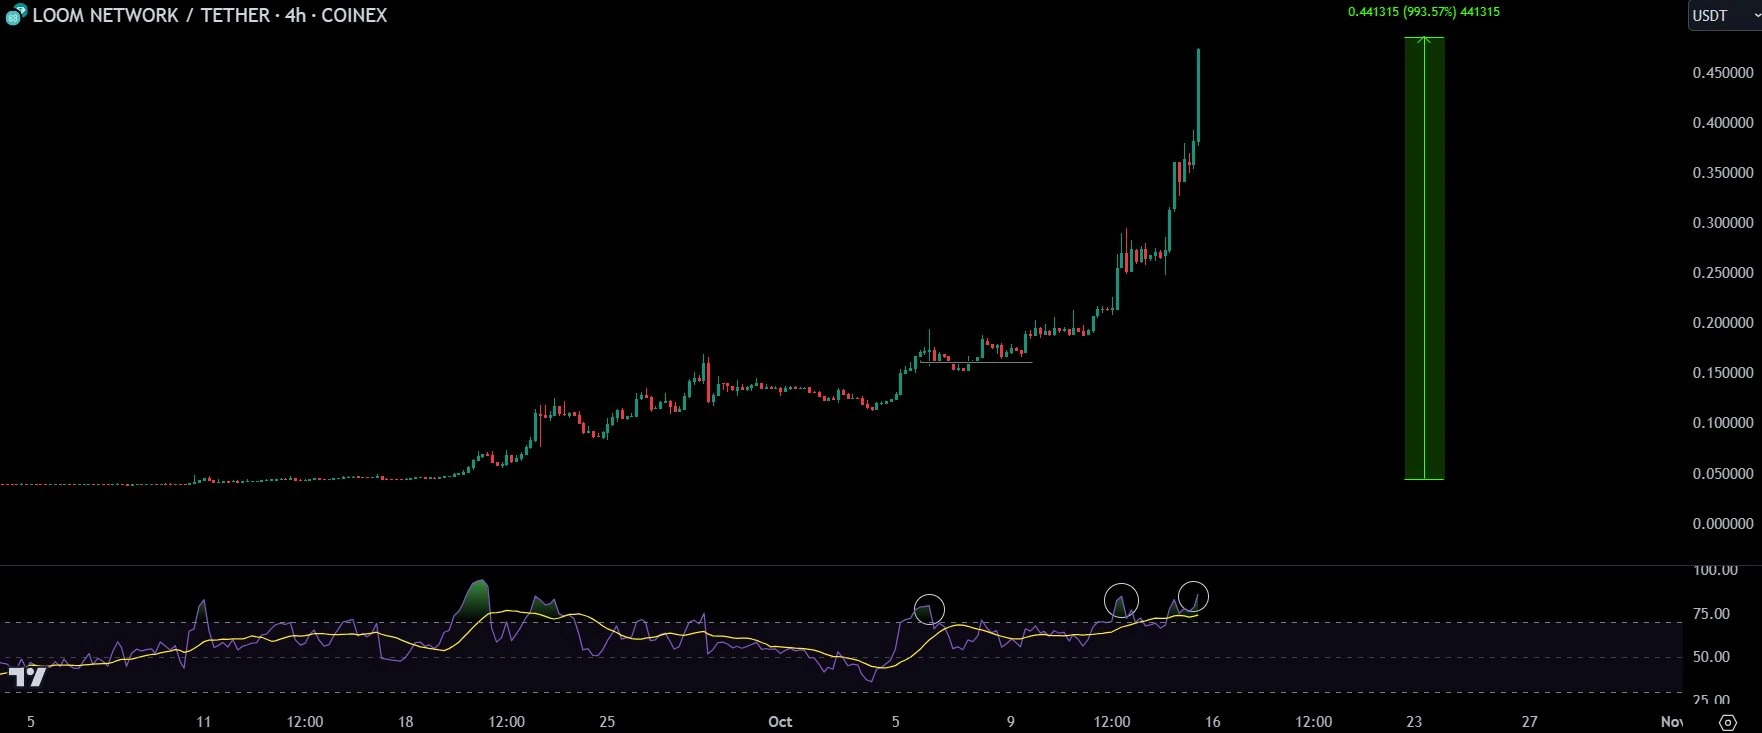
$LOOM ran 10X in 1 month (Spot). Momentum and short squeezing all the way, on nearly -3% funding rate. Newbies trying to short momentum lost all their $. Newbies relying on "overbought" RSI missed out on major gains. Don't get REKT shorting "momentum" or revenge-trading.
I would never trust an overbought RSI on the 4 hour.
Any TF.
MACD
Indicator. If MACD has any relevance at all, it's on very high timeframes. Use it as secondary confirmation (of many) — this is retail's indicator and generates signals after a trend has been established (lagging).
10D TF:
Which indicator is preferable for 4h or lower timeframes?
Price Action. PA
Moving Averages (EMA)
The Exponential Moving Average is a useful tool because it follows price closely and can serve as a strong support/resistance reference. However, its effectiveness is limited when price is moving sideways and not trending — it may not produce reliable trading setups.
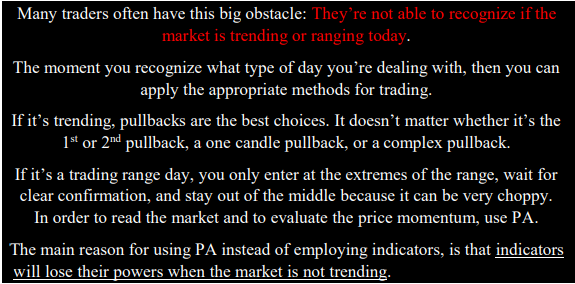
The main problem? Not only is it a lagging indicator (based on past price data, reacting after moves have already occurred), but recognizing whether the market is trending or ranging can be a major obstacle for many traders. Bitcoin is the fastest trading game on the planet — relying on lagging indicators here is definitely not the wisest strategy.
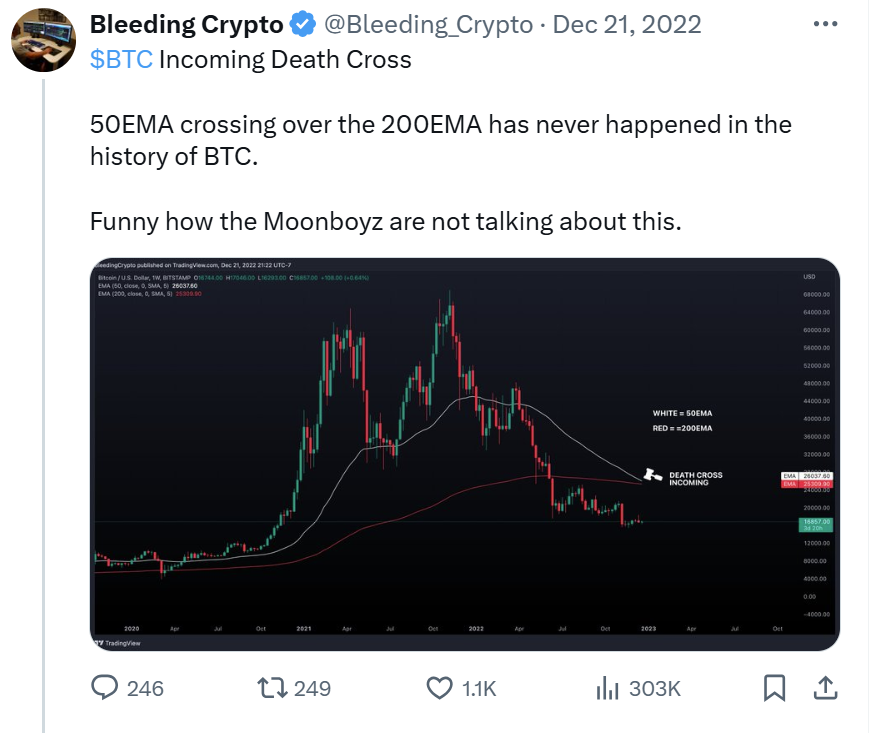
Death cross / Golden cross consensus
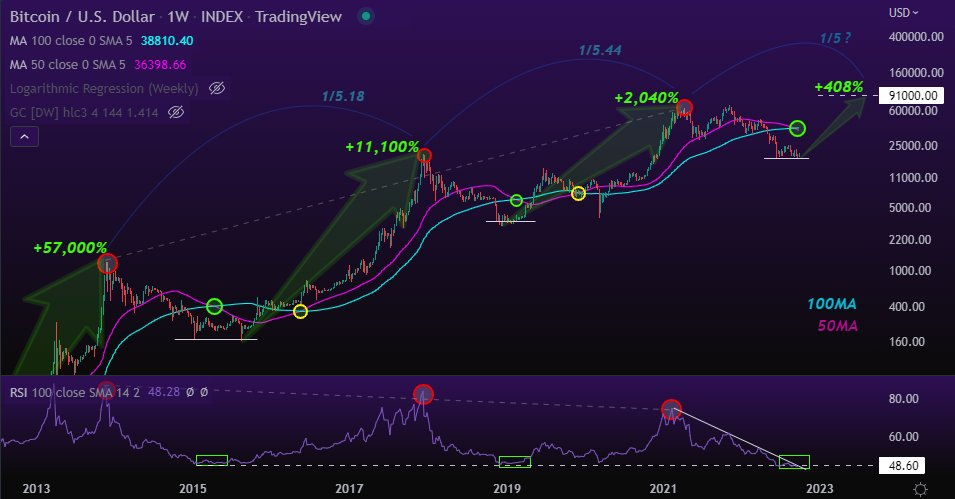
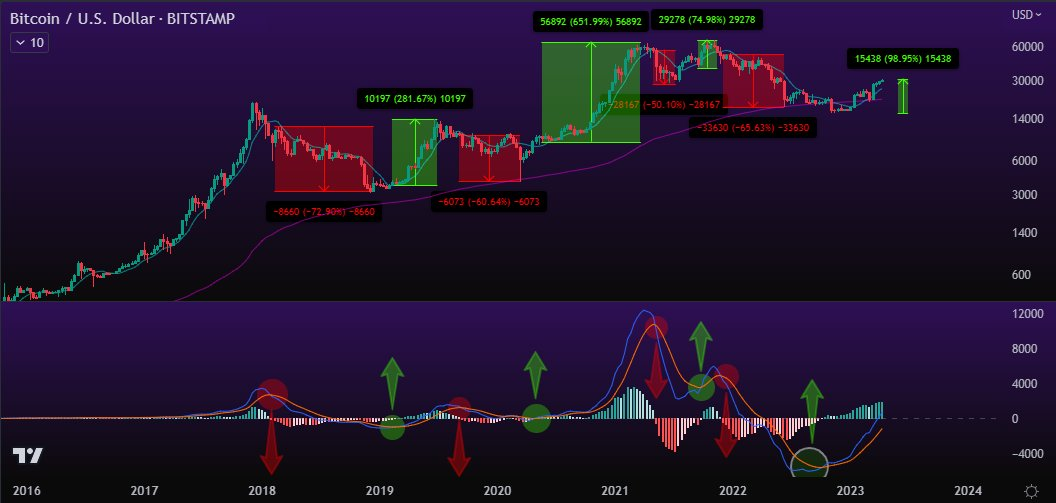
If the majority of influencers say a death cross means BTC will go down and possibly enter a bear market — pay attention. IF MAJORITY says that, it most likely can actually do the opposite. Bitcoin's death cross ended up being bullish. Golden cross less than 1 month away.
A Golden Cross appears when a coin's short-term MA crosses above its long-term MA — typically a pattern indicating potential for a major rally. Death Cross is the opposite. But the previous Death Cross became bullish.
Past couple years BCH 4H Death Cross traders have been making serious gains IF they understood it to be a bullish signal for Bitcoin Cash PA. Not a signal to ignore, but not the way retail reads it either.
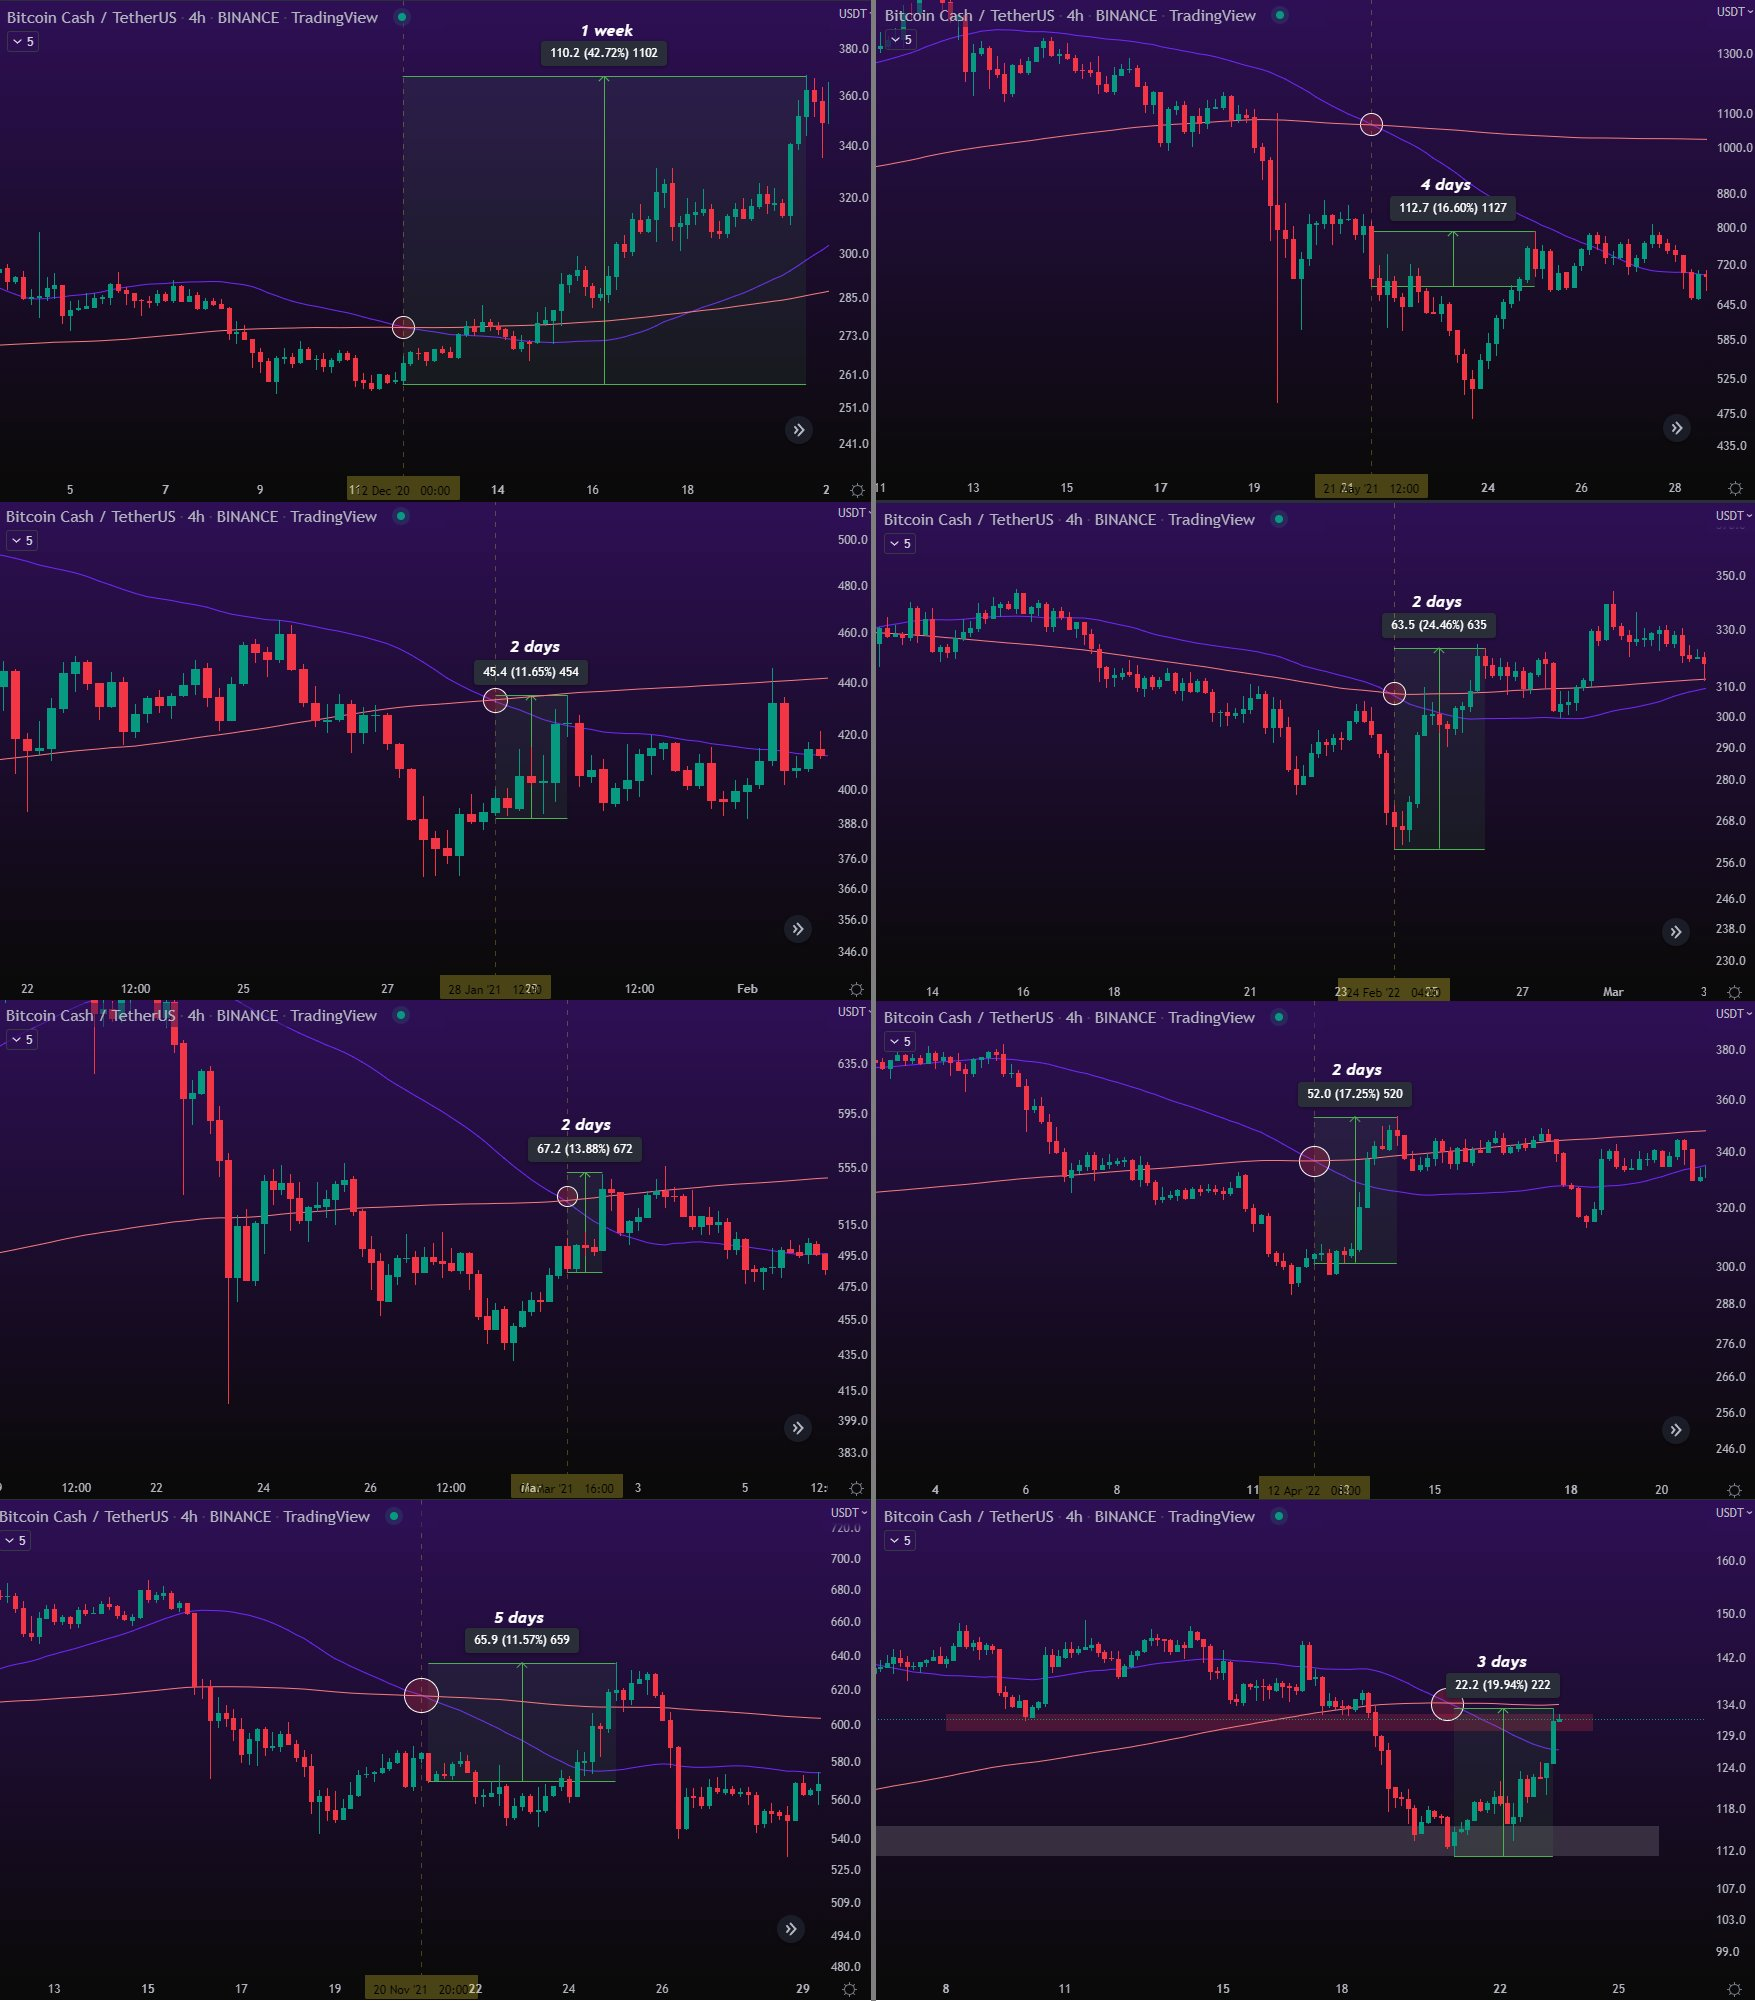
Lagging indicator. Learn PA. Look at the chart on HTF as well and find areas of liquidity untouched for a while. Find imbalance such as the CME gap on BTC at $9,750 — that's what magnets PA. Matters 0 how long you study something if you're studying it wrong. Followers count means nothing.
Candlestick Naming
The last thing you need when learning to read charts is knowing what to call each candlestick. Hanging man, shooting star, hammer, marubozu, harami, etc. This has no other purpose than to distract you from the real craft. It's usually added to courses and educational material to fill them with more content. Ok to know — but you need none of that. 🤦♂️
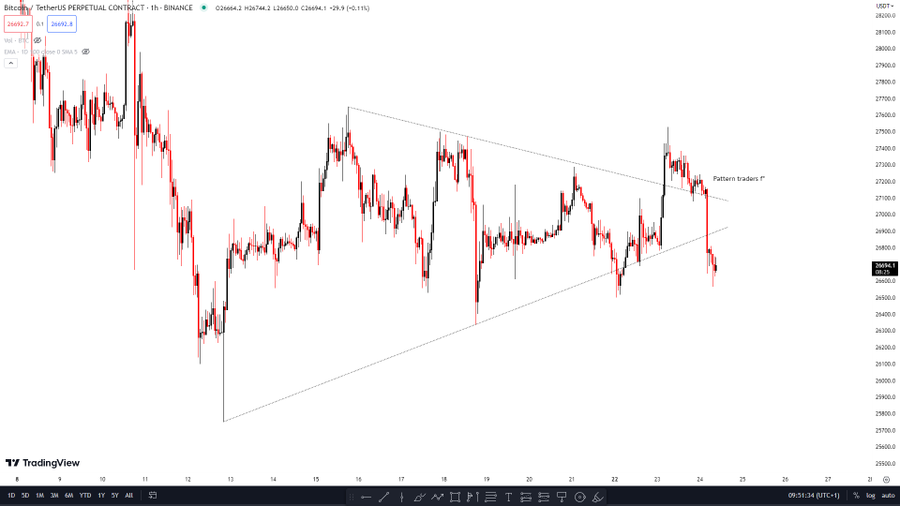
Retail TA Patterns: Triangles, Flags, Trendlines
Triangle patterns
When price is reaching the climax point of a triangle, when it has nowhere to go, that's the moment to anticipate a breakout. This is the easy part. The location of the pattern is also important. If the triangle is inside a big trading range, the resistance level might not be that significant, and that's where newbies fall.
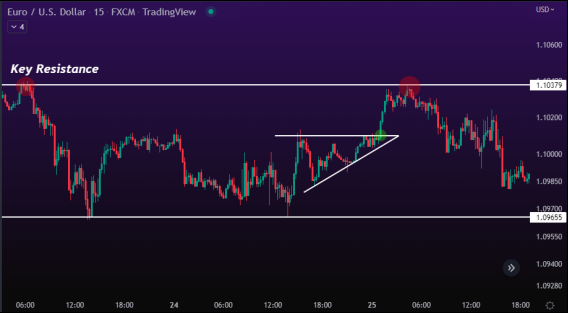
The problem here: it develops 𝐢𝐧𝐬𝐢𝐝𝐞 𝐚 𝐭𝐫𝐚𝐝𝐢𝐧𝐠 𝐫𝐚𝐧𝐠𝐞, so even with a small breakout, the upward movement is restricted by the other resistance. Yes, this is an FX chart, but valid for cryptos, stocks, etc.
If the ascending triangle develops in a trending momentum, that adds more weight to the pattern, because there's no major resistance ahead. Currently, Bitcoin isn't trending but ranging on a major downtrend (< 200W & DMA).
When the ascending triangle develops within a trend, we're interested in buying the breakout, like in this example:
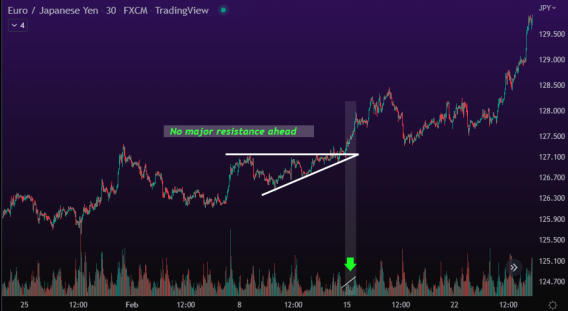
Regardless of location, during a trend, ascending triangles are bullish patterns indicating accumulation. The HL's in the pattern are a clue that buyers are not letting their positions go at lower price.
You also need a clear resistance level, with a series of highs occurring at or near the same price. You don't want one or two touches only — that might be a swing high or a double-top (Selling Tops). You need a number of attempts by bulls that go nowhere. Once the breakout happens, you need a pick-up in volume that results in a nice long trade. Not necessarily the highest volume of the last 24h — but acceleration to the upside. You want to see buyers participate in the move to increase the likelihood of follow-through.
That said:
Triangle patterns are retail patterns rather than smart $ patterns — unreliable, just a gamble. Especially if trading just the pattern itself without stronger confirmations.
Elliott Wave / unrealistic-target tools
A tool used by bullshitters with unrealistic targets if used improperly. Fie will be covering this, the basis for how I trade does not rely on EW.
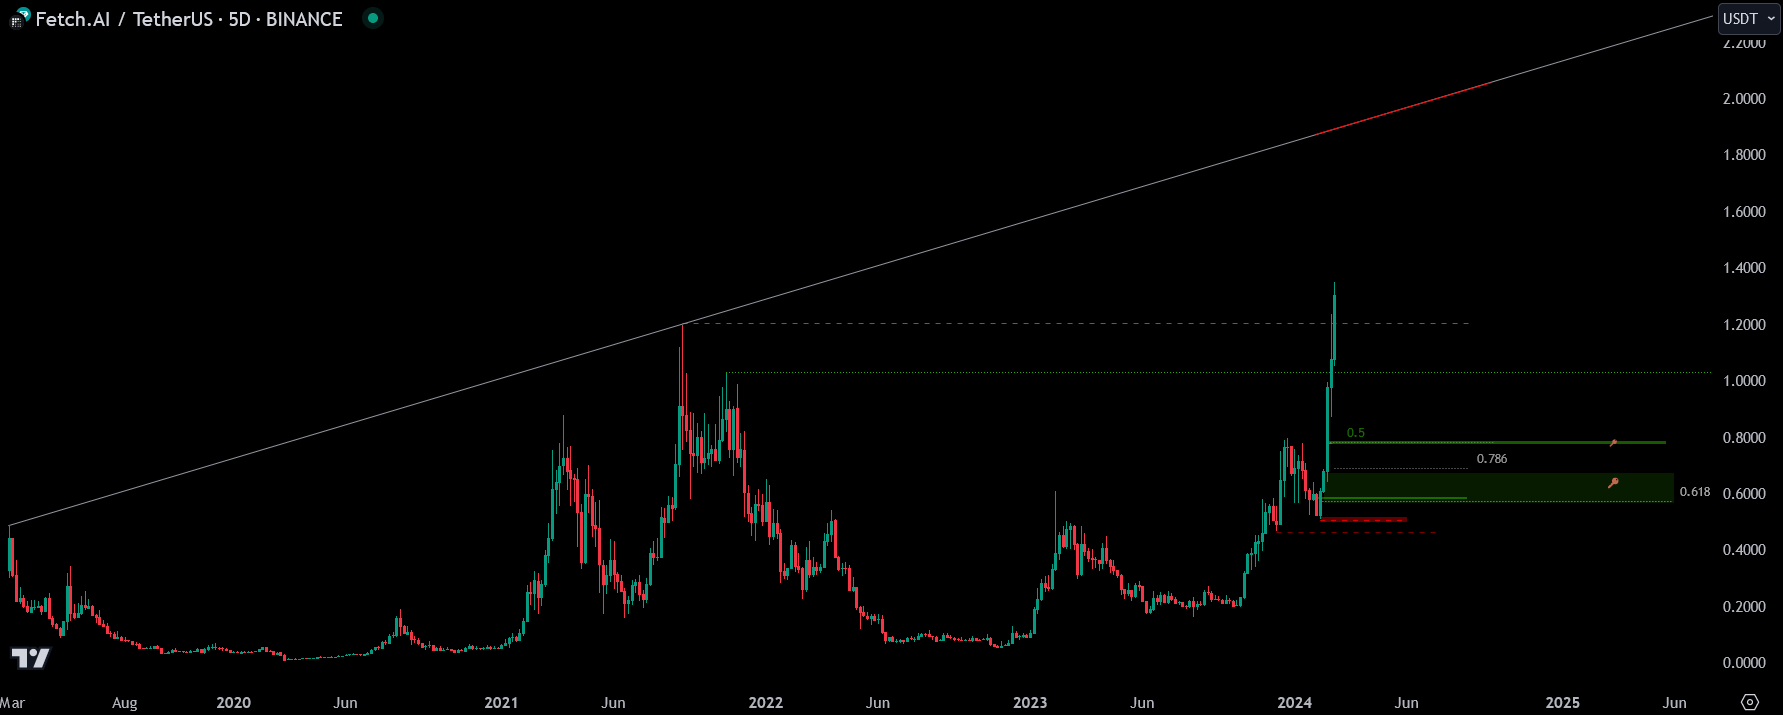
Trendlines
Trendlines are usually accurate enough — but you barely need one TL on your charts. FET:
Flags & "broken resistance, go long"
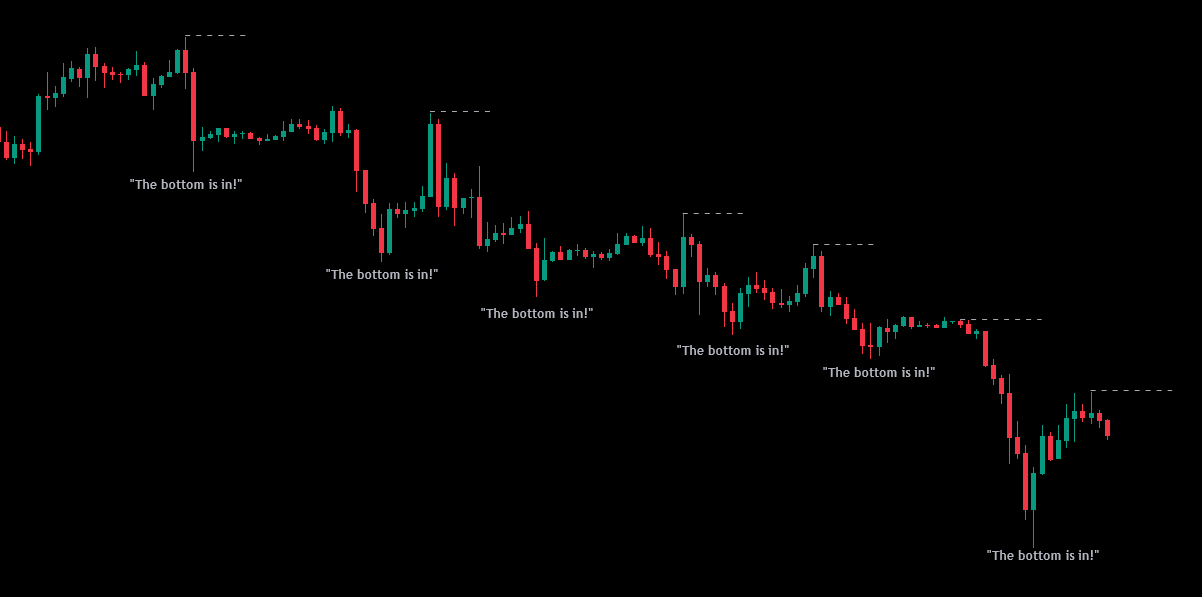
Flags are retail trading. Not institutional or algorithmic. There always has to be some % success on retail strategies, so they keep trying, believing they can optimize their game — but they cannot. Their success rate is from low to extremely low. The traders who can move markets do not look at flags, indicators, triangles. Retail's learning it all wrong. Perfect.
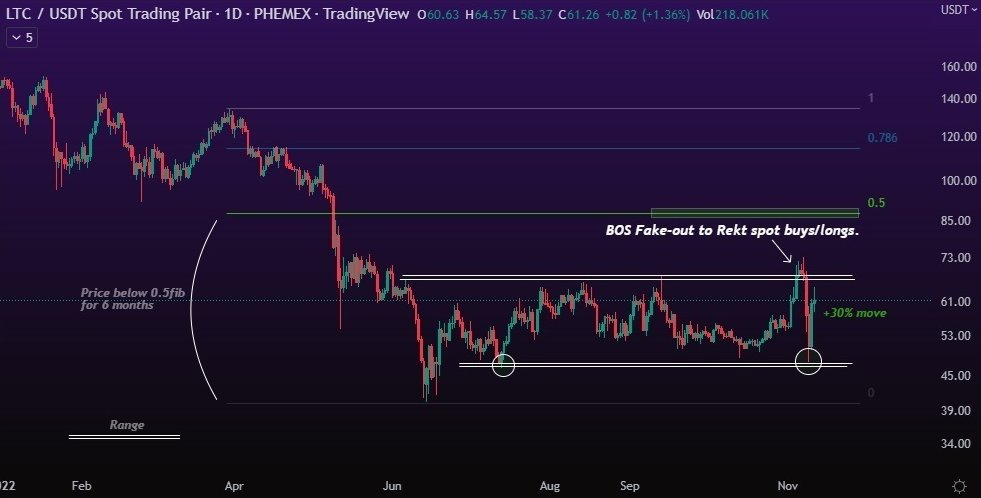
🔷Break of Structure: Most traders out there will long the BO, or wait for retest of "resistance turned support" — rather than looking for "fuel." They get REKT, and then price goes in their desired direction. See 🎁Hidden Liquidity Levels.
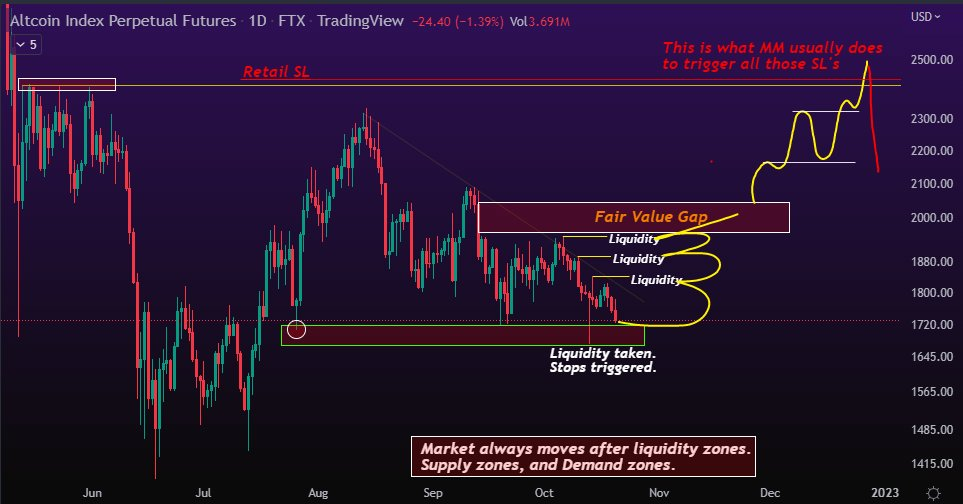
AltCoin Index — see that resistance? It will soon go there, break it, retail will think it's time to 🚀 because resistance broke, go long, and get REKT.
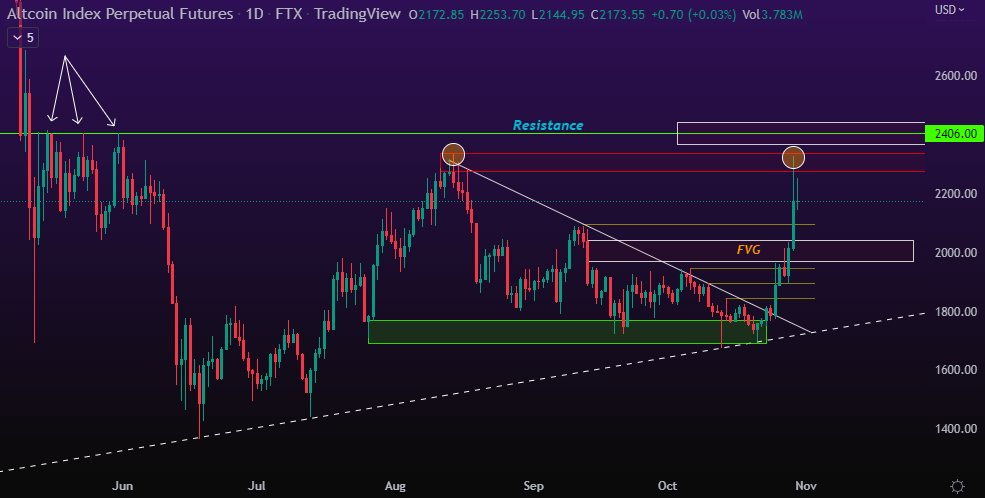
A "natural" pullback when hitting resistance is not REKT, is it?
Once it breaks resistance, they'll either long because "oh look, it broke this resistance, I should go long!" or they'll wait retest to R for continuation. It's likely to liquidate them. There's rarely anything "natural" in this market.
Single-timeframe S/R without refining
If they're showing charts with supply or demand levels on a single high timeframe rather than an analysis through timeframes (refining), without "fresh" candle bodies to be taken (mostly wicks) and claiming it to be strong support or resistance — they've learned TA from CAPO and you will get REKT.
"TA Doesn't Work" — From People Who Aren't Profitable
"TA doesn't work. It's just magic lines on a chart" — said by someone who's not a successful trader/investor.
Sure. Retail TA doesn't really work. I agree. No one will become a consistently profitable trader with retail TA, and that's why you don't see any influencer with high hit-rate in the game — they're retail influencers, which is why many try to sell pre-recorded courses with their magic "original" indicators.
Tell them to scan through my feed and I want to see "TA doesn't work" come out of their mouth. Only if they're retarded.
- TA shows you whales' moves and where liquidity is at. Train your eye to see that.
- You don't need to play every move, and you don't need to chase anything — ⚠️ Never Chase.
- Play alongside whales. They move > you move. That's it. Rather than: shillfluencer moves > you move. Wrong. REKT.
Then put in your mind that everything is staged, and you will truly 👁. Yes — a "matrix." You will see FUD news happen and price goes straight to major key liquidity Demand levels before reversal. You will see FOMO news happen and price goes straight to major key liquidity Supply levels before reversal.
I dare to say that 98% of what happens in the world is related to liquidity on investment markets. War included. Pandemic included. Price goes down (or up) to grab major long-term liquidity levels that wouldn't have a "reason" to be taken without a major "Black Swan" event. And when I say "investment markets," I mean ALL markets — RE, Commodities, FX, etc. The evidence is on the charts, if you know how to read them.
If you actually understand what I just wrote above, it can change your life forever. It's all a game 🤝 — 🏆Win the Game.
Retail Fail Galleries
Sometimes the lesson is just: "Don't be this guy."
This you?
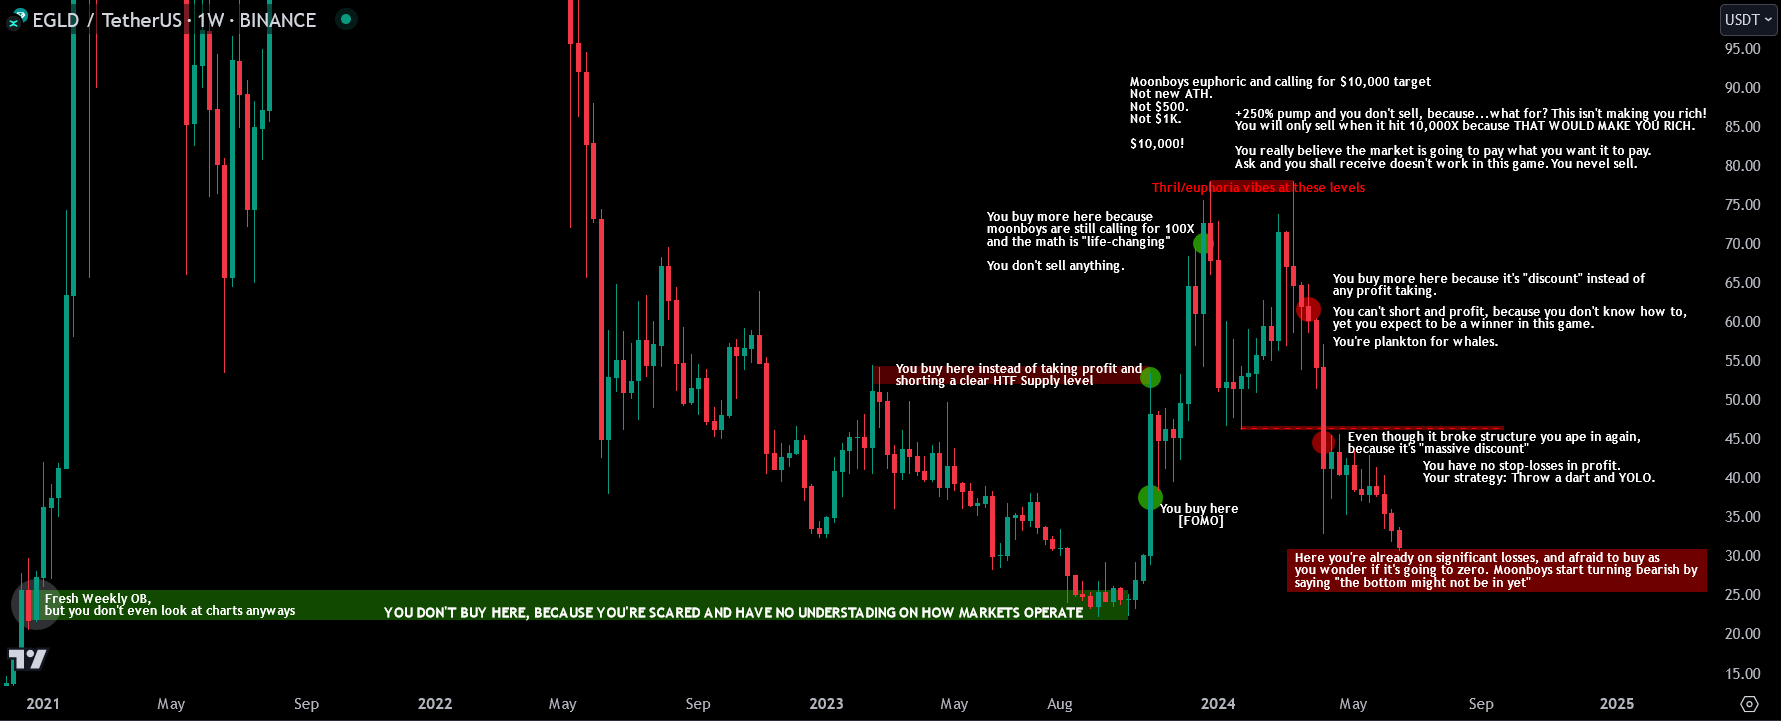
If you accept the reality, you can only improve. Learn from your mistakes and stop following the herd. Don't Be the Herd🐑
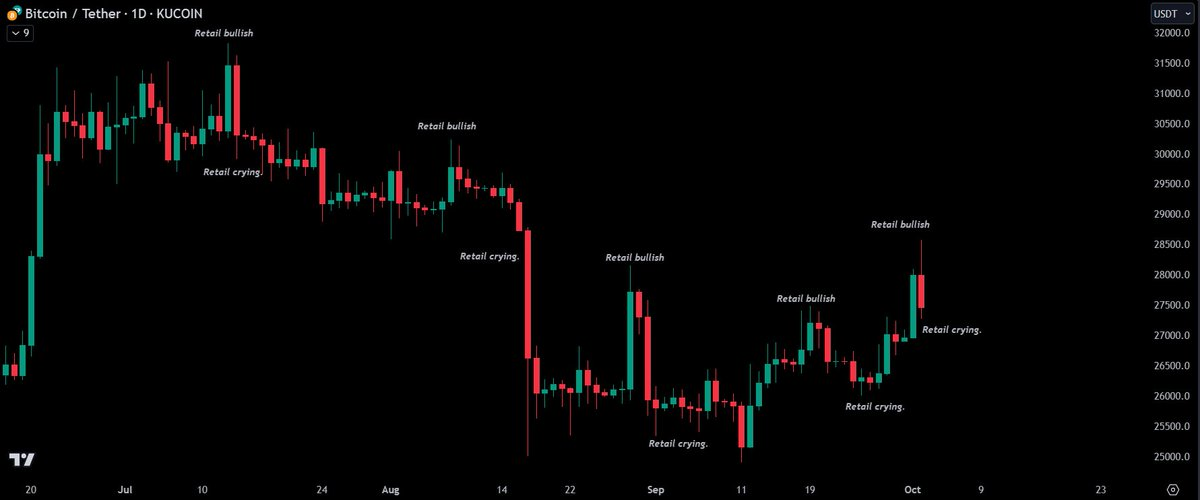
Just FYI: +$1,000 on Bitcoin doesn't mean it'll go to ATH. -$1,000 doesn't mean it will crash. It's about market structure on HTF. Liquidity levels decide where reversals happen. Retail's role is making whales richer. See 🎁Hidden Liquidity Levels / 🌊Liquidity (+Wicks).
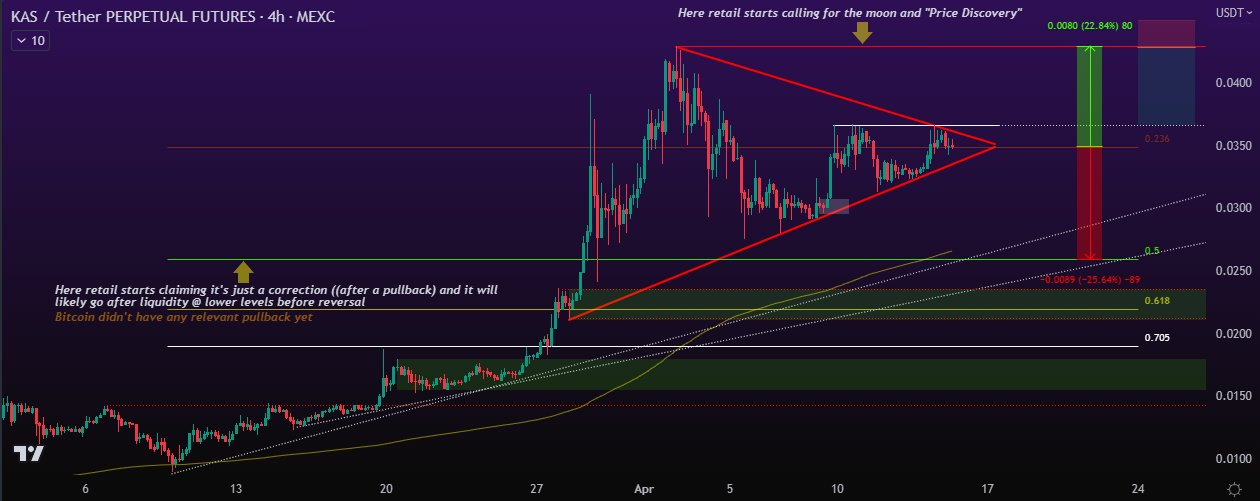
$KAS move soon ⌛️
Successful "investing" on CX:
Ain't that the truth:
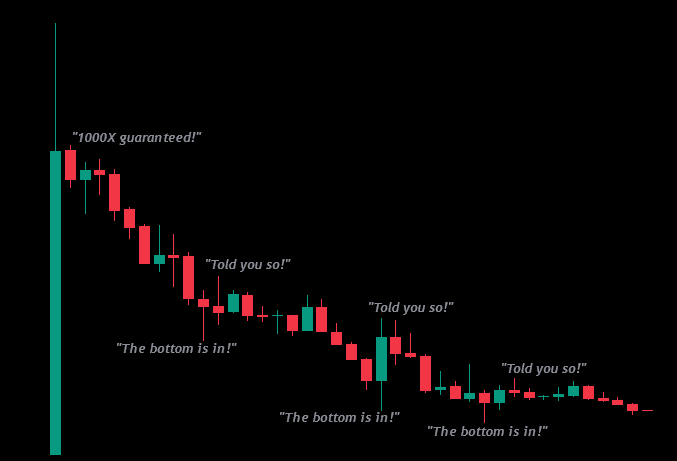
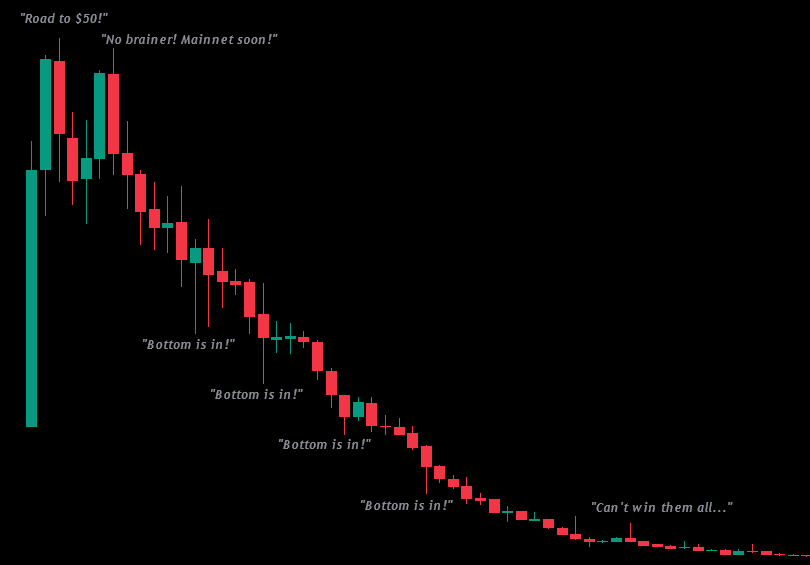
Crypto trading "Gurus" [detailed]:
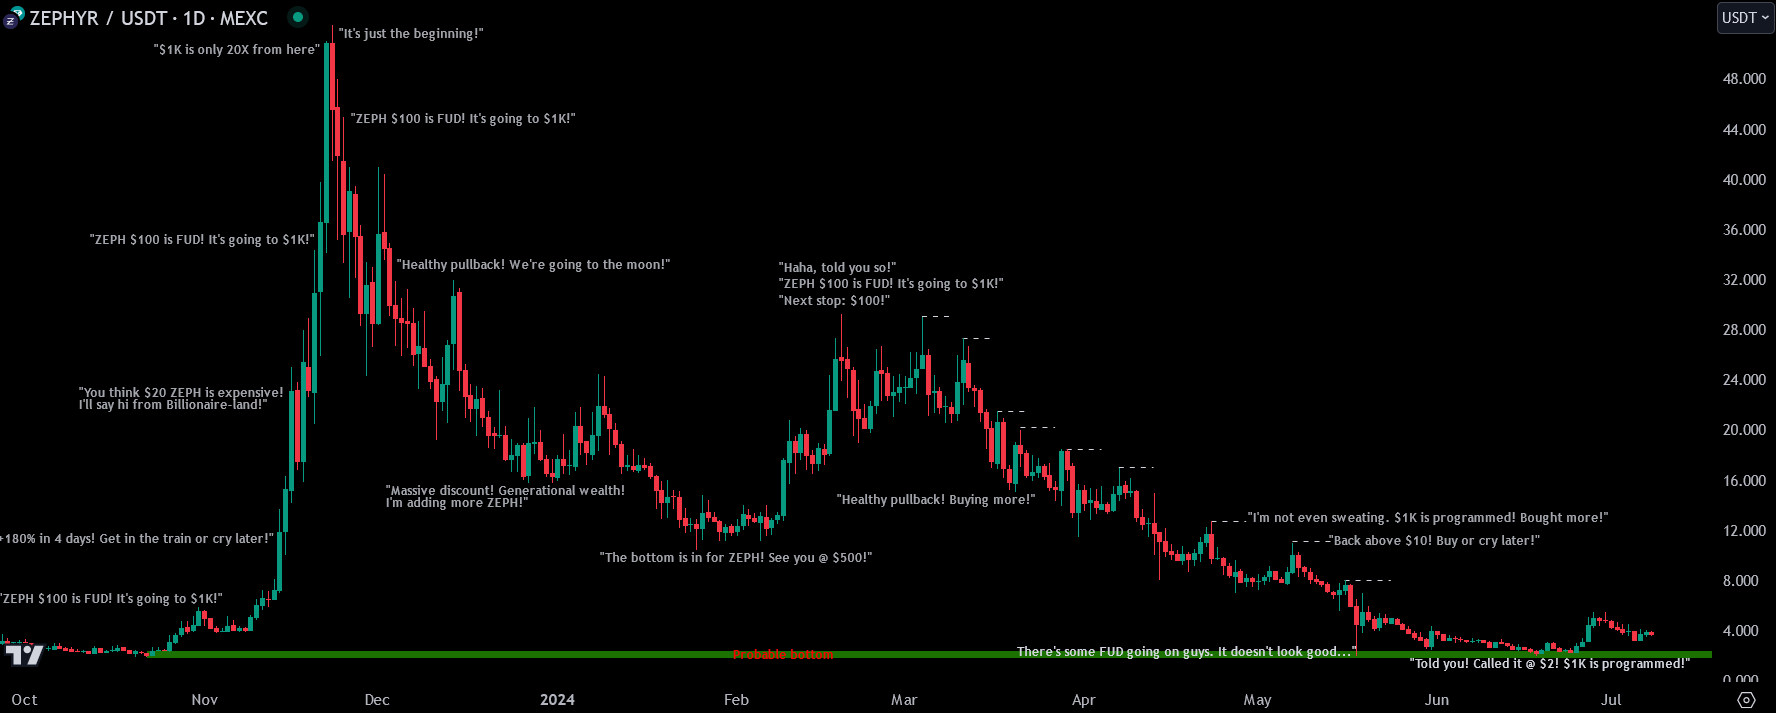
This is how you get fucked in this game. To avoid getting fucked like this, if you wish to play the nano and micro caps game, aim for much lower targets than what's shouted in this space — because they're all either inexperienced, retarded, selling opium, or a combination of the three.
Lastly, if you see a 20X in one month and take no profits, you do deserve to get REKT. It's not the market's fault you have micro positions and want 7 figures from each shitcoin bag.
Do those tards even look at charts?
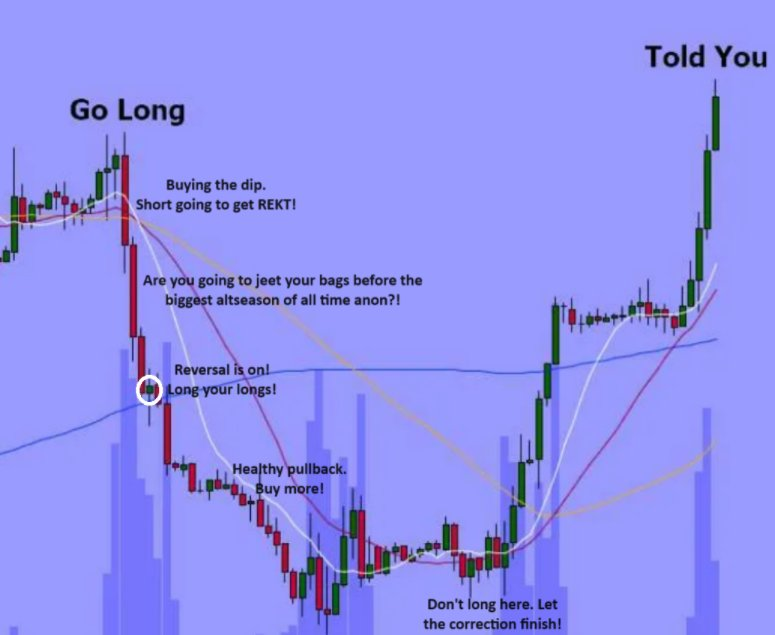
How to REKT break-out (BO) traders 101 👇
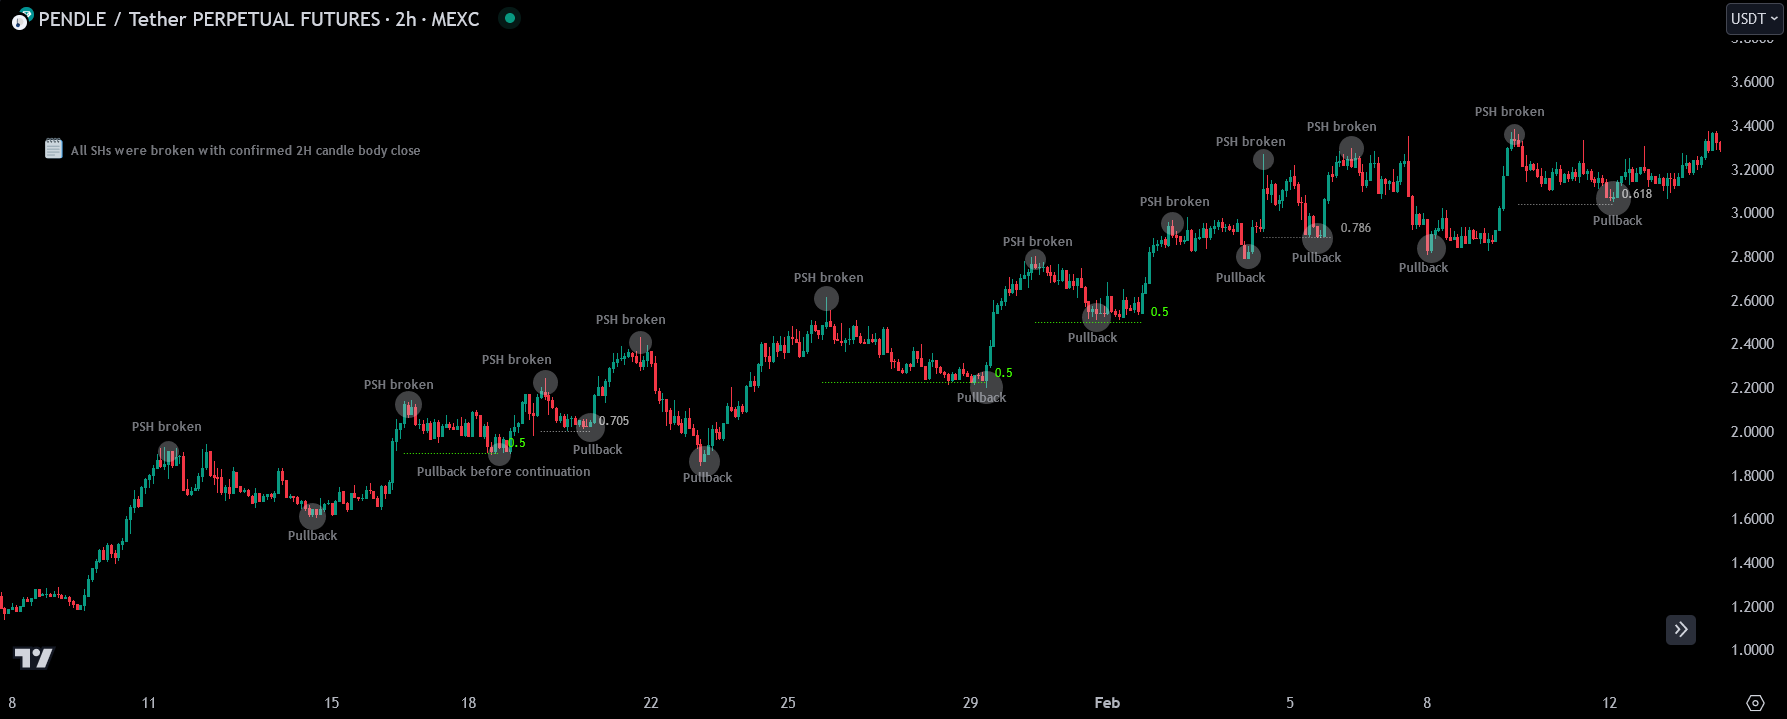
Your entry? On the pullbacks, at key levels, while retail traders get REKT.
When one of my trades doesn't work out, I don't double down. I accept the failure, allow for a loss of up to 1% of my account, and move on to make it back in one single perfect trade shortly after. In contrast, many "experts" recommend increasing your stake in a losing position. That is the most ridiculous strategy in this game. They had a plan, entered a position, and when it goes against them they forget their initial plan.
Two examples of the real moves when retail thinks "Oh, it broke resistance, I should go long!":
Your feed shapes you
Your results are a reflection of who you follow. If your feed is filled with wrecked traders, shillfluencers, and braindead moonboys — what do you think happens to your decision-making?
The top performers in this space — the ones calling major reversals before they happen, backed by solid risk management — are the very people who've leveled up their game by studying my free content. No point in arguing with the truth.
This isn't just about trading. It's about understanding the game and ceasing to be exit liquidity.
Mindset Closers
Repetition, the father of 🎓Learning, is the key to mastery. You can't cheat your way to mastery. See 🎓Learning Process.
You'll need to unlearn and relearn. Trying to mix what you've picked up from trading books or YouTube 'gurus' with what I teach will only give you a headache. If you're serious about mastering the most powerful strategies in this game, be ready to rewire your thinking.
I won't overwhelm you with information, because your mind needs time to absorb and process. Mastery is a journey, not a sprint. Stay patient and trust the process — 🎓Learning Process. If you decode my earlier plays — and there are hundreds of them with their updates — you will start seeing what I see.
Don't chase money. Chase mastery, and money will eventually chase you.
I feel like my mental state in this game is all over the place. I never feel like I'm great at this, but there comes times that I feel like I'm making progress, and then the next week I feel like I know nothing.
That sounds like you feel like a winner when a trade goes well, and when you're stopped out you feel bad. That's an emotions issue. You need experience and mastery. Above all, you need to believe you can master the game — or it will always be a rollercoaster of headaches.
Your future knowledge will change everything 🤝. Many of the answers you seek are found in the experience you have yet to gain. Your financial freedom is in this feed, in knowledge format. Your job is to convert that knowledge into the $ you're after.
The most important thing to thrive in life is to find the right knowledge early — that's hard, because the wrong knowledge is shared by 🦎s who go heavy on ads to pop on your feed, so you'll think they're the real deal, follow their "teachings," get REKT, and give up.
Everything contained in this course is verified info by me, Tac. This contains info from both myself and reconstructed from people I have learned from, my mentors. There is very little you need outside of this course to go from 4 figures to 8 in a few years. It is simply up to you if you decide to take this seriously and put in the work.